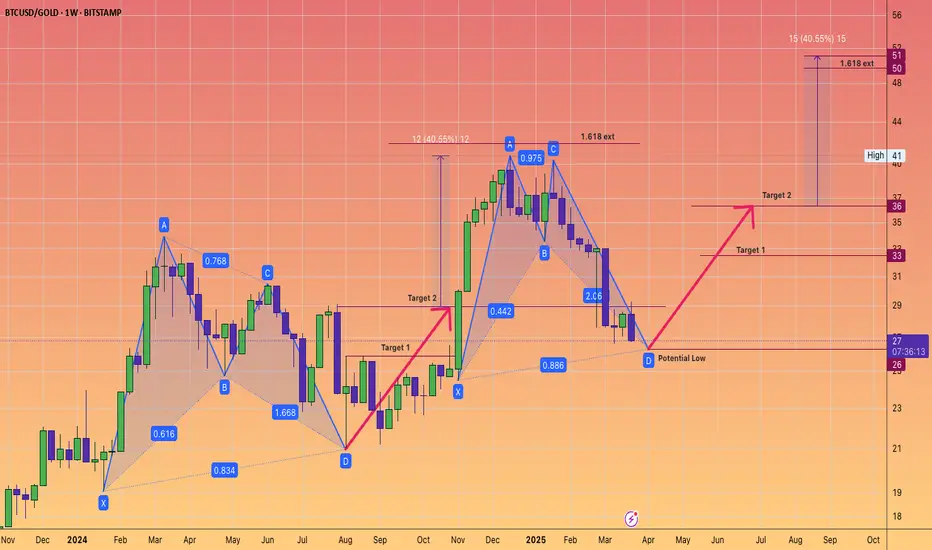
Bitcoin harmonic pattern. Back to back Gartley. BTCGOLD ratio.The BTC/GOLD ratio has experienced a significant correction, currently standing at 27 gold ounces per 1 Bitcoin, down from a peak of 41, representing a decline of 34%.
Gold, priced at $3,114 in US Federal Reserve notes, is in a sustained bull market.
It is reasonable to anticipate that the digital equivalent of gold will gain traction once gold stabilizes at a higher price point.
The Gartley pattern is recognized as the most prevalent harmonic chart pattern.
Harmonic patterns are based on the idea that Fibonacci sequences can be utilized to create geometric formations, which include price breakouts and retracements.
The Gartley pattern illustrated indicates an upward movement from point X to point A, followed by a price reversal at point A. According to Fibonacci ratios, the retracement from point X to point B is expected to be 61.8%.
At point B, the price reverses again towards point C, which should reflect a retracement of either 38.2% or 88.6% from point A.
From point C, the price then reverses to point D. At point D, the pattern is considered complete, generating buy signals with an upside target that aligns with points C and A, as well as a final price target of a 161.8% increase from point A.
Often, point 0 serves as a stop-loss level for the entire trade. While these Fibonacci levels do not have to be precise, greater proximity enhances the reliability of the pattern.
Will these consecutive Gartley patterns succeed in bolstering Bitcoin's strength? We will soon discover the answer.
Fiatcurrency
WHAT IS THE EXPECTED RETURN and DURATION of this GOLD Bull Run?Well, when measured against the DXY index, a clear trend becomes apparent.
A Golden Bull typically lasts about 40 quarters, which is essentially 1 decade (give or take a quarter).
Similar to #Bitcoin and its cyclical bull markets within a larger secular bull, the returns tend to decrease over time.
However, it seems that a triple-digit Gold price relative to the DXY is on the horizon at the very least.
What would that look like if the DXY were to hit a new low around 69? This would suggest a Gold price of $6900 at a ratio of 100:1.
A Gold price of $12K with a DXY of 80 only requires a ratio of 150...
Thus, a five-digit Gold price is certainly within the realm of possibility.
I have forecasts that extend as high as $12K.

DOW JONES TO 111 THOUSAND..in the the 2030's.
as an investor you must be thinking 2 decades down the line.
NOT 2 quarters.
They can not
stop
printing #FIAT
it's in the code.
A 8% compound rate puts the Dow Jones at 85,000 in 2034.
I'm long forever.

GOLD v DXY in breakout move --- HVF hunt volatility funnelAlways good to measure against the DXY not just the USD value
Not perfect of course as it is mainly the Euro and Yen but still insightful.
Been watching the relationship for a while
currently breaking out to the upside
HVF theory means this should be a violent expansion
Target 1 coming up.

UJthis is all technical with several confluences, its based on a 4 hour chart, I basically trade off this TF and go down just to refine my entries. thanks for watching and your support.

$JPIRYY -Japan Inflation Rate YoYECONOMICS:JPIRYY (March/2024)
The annual inflation rate in Japan ticked lower to 2.7% in March 2024 from February's 3-month peak of 2.8%, matching market consensus.
There were slowdowns in prices of transport (2.9% vs 3.0% in February), clothes (2.0% vs 2.6%), furniture & household utensils (3.2% vs 5.1%), healthcare (1.5% vs 1.8%), communication (0.2% vs 1.4%), and culture & recreation (7.2% vs 7.3%).
At the same time, inflation was stable for food (at 4.8%), housing (at 0.6%), education (at 1.3%), and miscellaneous (at 1.1%).
Meanwhile, prices of fuel, and light dropped the least in a year (-1.7% vs -3.0%), with electricity (-1.0% and -2.5%) and gas (-7.1% vs -9.4%) falling at softer paces as energy subsidies from the government would fully end in May.
The core inflation rate fell to 2.6% from a four-month top of 2.8%, slightly below forecasts of 2.7%. Monthly, consumer prices rose by 0.2% in March, the most since last October, after being flat in the prior two months.
source: Ministry of Internal Affairs & Communications

Gold Trading Sideways and Consolidating, RSI at 50 Gold is trading Sideway, but for how long?
Between $2280 and $2380, the longer this consolidates The better it is for Gold and the market is now accepting this price. Right now the RSI is at 50ish, so the price is neutral, but it will eventually break out one way or another.
Given this long consolidation period and the trend is still up, I suspect it will continue higher going into 2025 and beyond.
Central Banks are still net buyers and not selling... and the USD as the reserve currency will continue to come into question. Gold still has strong fundamentals for ownership.

EUR/USD -Approaching Resistances (update) - EUR/USD has been flirting past sessions with broken support trendline,
being faced now as resistance .
Seems more like a decisive time for EUR/USD to make up its mind and
find direction, either gravitated to the upside (1.20) or downside(1.01)
Both scenarios attached below
Market Structure still intact with the series of Higher Lows and Higher Highs.
(Gold Zone level coincides with the most recent HL of uptrend, must hold to avoid 1.01)
TRADE SAFE
***Note that this is not Financial Advice .
Please do your own research and consult your own Financial Advisor
before partaking on any trading acitivity based
solely on this Idea.

EUR/USD -Macro Resistance (update) -Anticipating upcoming week to have some bullishness in price action,
looking for Technical Bounce at Trendline Support to long,
while remaining opened in Short Positioning regarding Macro and Higher Time Frames.
Every bounce may be short-lived,
so bear in mind this scenario when looking for your
next Short Opportunity on EUR/USD.
Maybe you'll enjoy having a trade open for months periods of times
www.tradingview.com

USD/JPY -On its way to a Safe Short- We've seen USD/JPY uptrending for what will be
the fifth (5) consecutive Weekly Green Candelstick prints.
Some cool of may occurr in terms of price action,
further due for correction ?
Lots of Higher Highs levels as Support from below
Looking from the left,
a Weekly Supply Zone can be spotted ;
(you can refer it as a *W OB).
As well coinciding with the fact of approaching Resistance Trendline of
Ascending Channel Pattern (a.k.a Bearish Flag).
Short-Bearish case Opportunities are on its way for USD/JPY.
Bullish case would be the breakout of pattern through above average volume and the
Supply Zone being broken.
This would invalidate the Short Opportunities idea for $USD/JPY
Until the next one;
TRADE SAFE
*** NOTE that this is not Financial Advice !
Please do your own research and consult your own Financial Advisor
before even considering partaking on any Trading Acitivity based solely on this Idea.

GBP/USD -Flirting Resistance *W
- Great British Pound seen on a more broader picture of
Weekly Time-frame *W (tf) .
Flirting with Trendline Resistance that rejected price action
on 4 times of interactions previously.
Fakeout occurance would be put to stop by 200EMA coming down as
Resistance Ceiling for GBP/USD
Breakout of Trendline + 200EMA re-testing them as Supports would give
much more room for growth regarding GBP
Below Supports
- Daily Order-Block *D OB
- Last Higher Low at 1.18$
- Weekly Order-Block *W OB
TRADE SAFE !
*** Note that this is not Financial Advice !
Please do your own research and Consult your own Financial Advisor
before partaking on any trading activity based soly upon this Idea.

$USD/CHF - Bottom of Range Bound *M- $USD/CHF has been trading inside a range bound from basically
since 2012.
Past two months, price action came very close to testing
the Lows of printed on January 2021 at 0.87576$
At the current Monthly Candlestick,
Price its breaking out from a Falling Wedge (bullish pattern).
Its measured move would put $USD/CHF at 0.97$
There sits a great opportunity to Buy $USD/CHF from here,
while stoploss can be adjusted in different ways depending on
your trading style and your risk appetite .
(we'll zoom in more for market structure on smaller tf)
Bounce to at least 20 & 50 EMA is highly a probable outcome,
conflicting as well with a test of the nearest S/R area.
TRADE SAFE
***NOTE that this is not Financial Advice .
Please do your own research and consult your own Financial Advisor
before partaking on any trading activity based solely on this Idea

$USD/CAD - Big Monthly Range *M(tf)$USD/CAD seen on *Monthly time-frame
Price Action seems to have Broken Structure on *M.
However, price still on Strong Supports :
- *M mid-range S/R area
- Triangle Bottom Area of Support (broken for now)
- Support Trendline from Lows
More confirmations to come The Week ahead in terms of Price Action
for the BoS situation & wether supports will hold $USD/CAD or plunge it.

$USD/JPY -Giant Bearish Flag *W- Awaiting Change of Character (CHoCH) for $USD/JPY on *W tf (weekly time-frame).
Market Structure looks healthy in terms of Higher Lows on smaller time frames (1-4hr)
Decent probable Shorting opportunity in case $USD/JPY fails CHoCH.
Shorting opportunity on Resistance Trendline of Bearish Flag Pattern on *W is perfect.
Pullbacks to at least 20 EMA *W + S/R zone.
Volume is aswell below average on *W
Price seems over extended for now despite The Uptrend Market Structure on
smaller time-frames
(screenshot attached at comment section)

$EUR/USD - Approaching Resistances$EUR/USD is exploding today as a result of TVC:DXY plunging hard.
Fundamentally speaking , concerning is the fact of Euro-Zone's Recession .
TA speaking, $EUR/USD is about to be put on stop of it's impulsive price sky-rocketing
due to approaching Resistances such as ;
-8HR* OB
-Macro Broken Trendline which was firstly support but now found as Resistance.
If you're in a long, it would be a good move of taking some profits before price reaching at
resistances targets.
If you are looking for Buy, you should be very careful .
In case you are looking to Sell $EUR/USD, its best to remain patient and anticipate resistances
conflicting with Price Action .
TRADE SAFE
*** NOTE that this is not Financial Advice !
Please do your own research and consult your Financial Advisor
before partaking on any trading activity based solely on this Idea .

$EUR50 - Recession - Eurozone OANDA:EU50EUR is officially in Recession due to two consecutive
negative quarters in a row.
The Euro-Zone entered a Recession in the first quarter of this year and economists are not optimistic for the coming months.
Having said that, its Index OANDA:EU50EUR continues to hold its
head up high, but the question is, how much longer will it maintain to do so ?
Will the situation get better for Europe or domino
effect has just gotten started ?
TRADE SAFE
*** NOTE that this is not Financial Advice !
Please do your own research and consult your Financial Advisor
before partaking on any trading activity based solely on this Idea .

EUR/USD -Swing Trade 'Short Opportunity'- Swing Short Trade opportunity for $EUR/USD
Short trade within Ascending Triangle,
which is a Neutral Pattern that can be broken either
to Bulls or Bears.
Demand yells for lower $EUR/USD.
Even on Volume Profile ; 4Hr* (TF)
Stay Sharp !
Until the next one ..
TRADE SAFE
*** NOTE that this is not Financial Advice
Please do your own research and consult your own Financial
Advisor before partaking on any trading activity based
solely on this Idea

$DXY -Wave 'B' Completed- It seems TVC:DXY found temporary Support
on the Bullish Cross Over in the last Week,
by testing it thrice and jumping around.
Concerning is the Change of Character (CHoCH) in Wave A
of A-B-C correction ;
by violating the last
Higher High of 103.3 (where fibb is taken).
However, this may only be a small issue regarding
Higher Time Frames Uptrend.
Zones to watch the weekk ahead for TVC:DXY ;
- Support to hold at 103.3 ;
(1 Fibb' level + S/R + EMA's Area
- Wave B Continuation completion after Impulsive Wave A
*Resistance at 0.618 Fibb's Golden Zone
(or a bit Higher zooming in on Smaller TF Order Block)
- Wave C continuation putting TVC:DXY @ 102.6 fibb level and trendline

$DXY - A Big Range (100.8 - 105.9) - The Dollar Index TVC:DXY has a very interesting
short to mid term time frame ahead regarding
its Price Action and Decision Making Time ticking .
Currently TVC:DXY is bouncing around a Big Middline S/R
area of 100-106 Range.
Both 'ANIMALS' have their fair share of Case,
while for now,
Bulls are more dominant on medium term
while Bears have taken total control of short term *Hourly Time Frames
by CHoCH impulsively and having a realif bounce (completion of Wave
(Bulls) - - -> Break out & Retest + Bull Flag formation pattern post break-out
(Bears) - - - > Fakeout ; Wave C Headed Lower

$EUR/USD -Decisive Weekly CloseEuro has broken down it's giant Weekly Bearish Flag ,
forming within the pattern an uptrend coming from the lows of 0.95 ,
dating back in September 2022.
Having faced resistance at 200EMA *W (1.10) and printing a Doji at that
particular Candlestick , signaling so, an end to the uptrend.
A down-trend has been established, momentum of which,
broke down the bearish pattern by failing to hold Trendline support.
Completion of measured move would take $EUR/USD to near Lows of 2022 ,
while there is plenty of Supports underneath to stop the price going that much
in The South.
Perhaps, that would be an effect of post Debt Ceiling decision.
Will US default on their Debt Ceiling and TVC:DXY re-establishes the Dominance
it had through-out 2021 ?
In case they put a stop to money printing,
would be very intereseting to say the least
how TVC:DXY will impact the FOREX markets
TRADE SAFE
***
Note that this is not Financial Advice !
Please do your own research and consult your Financial Advisor before partaking
any trading related activities based soly on this idea.

Gold in a supercycleCould we be mid-way through a super-cycle in gold? Could we?
Judging by the news we are seeing a slow decline in the PetroDollar, which is a fiat currency built on trust and the number of nuclear weapons. This military power is denominated in Dollars, which used to be tracked in gold. Regardless of what the Crypto fanboys call out, there is only one money, and that is Gold, everything else is currency.
Are we about to see a massive surge in Gold as currency all over the world derates to make up for all the surge in prices and workers wanting take home more money?
NOTE: This is a 12months line chart, it could take 5-10 years before the surge represents itself....

BTC OutlookBitcoin will eventually hit $30 billion by the year 2064, according to my estimation. There is an enormous passion behind the blockchain technology. Many laugh, some underestimate and some enter. The ones who enter (for long, not short) will win. If one Bitcoin reaches $30 billion, its market cap will be $400 quadrillion which comes against the total amount of current fiat by $29 trillion. Some people then invalidate the idea of Bitcoin hitting that number; but, the question is: Why is there even that $29 trillion? Why not more or less? For many centuries, govts did what they wanted. Printing an unlimited amount of notes. Now, the decentralised system of blockchain is here.

It's called the world reserveGold investors have taken a pummeling so far this year.
The SPDR Gold Shares exchange-traded fund, which tracks the price of bullion, is down 5.3% in the year.
Many precious metals investors would have found that disappointing especially given that there is widespread belief that gold is believed to be a long term hedge against inflation. And yes, inflation has been rising this year, hitting a recent high of 9.1% in June and falling to 8.5% in July.
Gold continued its recent struggles on Friday to set a new two-year low after a slew of central banks followed the US Federal Reserve in raising interest rates to cool inflation.
Gold’s decline comes on the back of a rallying US dollar, which touched a 20-year high, curbing demand for the greenback-priced metal. Benchmark 10-year yields also jumped to their highest since April 2010, further dampening demand for bullion.
“We’re seeing relentless dollar strength here and that’s going to keep gold vulnerable in the short term,” Edward Moya
