XAUUSD August 2025 Monthly OutlookWelcome to August — and welcome to the top of the macro ladder. Gold is not just rising. It’s rewriting structure.
🔸 Macro & Fundamentals
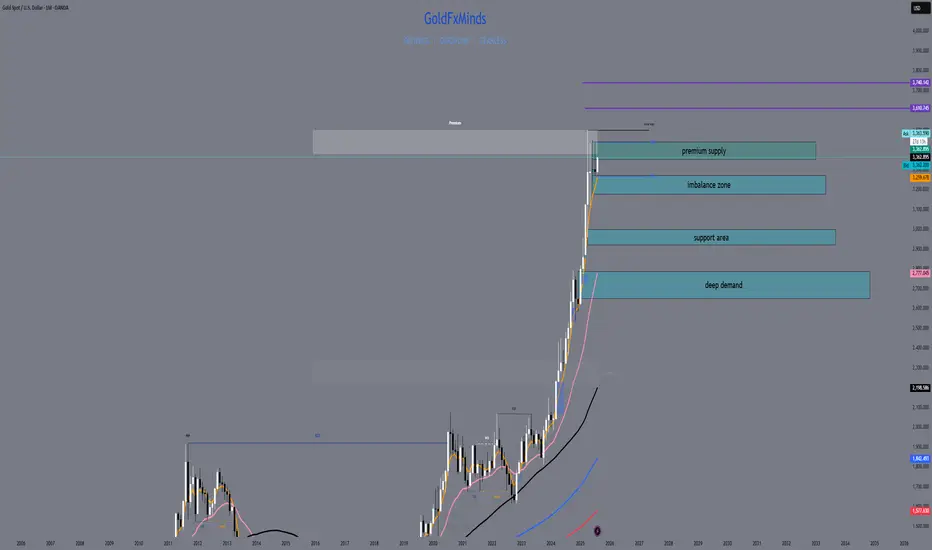
Gold opens August with a fresh impulsive breakout above $3360, fuelled by a weaker USD, rising global risk sentiment, and continued speculative positioning from institutional buyers. The upcoming Jackson Hole meeting and shifting Federal Reserve expectations create the perfect climate for volatility. All eyes are now on the premium structure top — but will gold expand beyond it or retrace to refill?
🔸 Monthly Trend & Bias (HTF Overview)
🔹 Structure: Clean bullish BOS, continuation leg in progress
🔹 Last CHoCH: April 2023 → Confirmed full trend shift bullish
🔹 Current Monthly Candle: Explosive push into supply with top wick rejection beginning to show
🔹 Bias: Still bullish but in extreme premium — watch for cooling/rebalancing
🔸 EMA Structure
| EMA Type | Status | Signal |
| ----------- | -------------- | ------------------------------------- |
| EMA 5 / 21 | Strong Bullish | Dynamic expansion, steep angle upward
| EMA 50 | Below | Clean breakout from range
| EMA 100/200 | Far below | Long-term uptrend deeply intact
🔸 Key HTF Levels (Wick-to-Wick Mapping)
Zone Type Price Range Confluences
🔴 Premium Supply 3350 – 3439 Monthly FVG + Wick exhaustion + RSI 80+
🔵 Bullish Imbalance 3180 – 3270 Monthly FVG + old BOS + EMA5 baseline
🔵 Mid-Level Support 2920 – 3000 Monthly OB + FVG + structure base
🔵 Deep Demand 2670 – 2780 HTF equilibrium zone + RSI support
✅ The current candle has pierced into the final wick supply, but with clear signs of loss in momentum.
⚠️ If 3439 breaks cleanly, next expansion zone opens toward 3505 → 3610 (Fibonacci projection). Otherwise, expect cooling to 3270–3180 first.
🔸 Fibonacci Context
🔻 Swing Low: 1810
🔺 Swing High: 3439
🎯 Current price ($3363) sits just below the 100% Fibonacci projection, with the 1.272 and 1.618 extensions at 3610 and 3740.
This confirms we are in a macro premium, and any long positions from here forward must be built only on strong LTF confirmation or clean pullbacks into value.
🔸 August Scenarios
🟢 Scenario 1 – Breakout + Price Discovery
If bulls break 3439 with strong volume and close:
New leg toward 3505 → 3610 opens
Watch for LTF continuation on H4–D1 with bullish OB reentry
Only valid if 3350 holds as new support
🔻 Scenario 2 – Rejection + Healthy Pullback
If price holds below 3439 and monthly wick exhausts:
Clean retracement toward 3270 → 3180 expected
EMA5/21 rebalancing will support bullish structure
Deeper rejection could retest 3070 zone if volatility spikes
🔸 Conclusion & Action Plan
We open August fully inside the last monthly supply zone. Trend is still bullish, but RSI, FVGs, and EMA distance warn us: this is not the time to chase — it’s time to wait for structure to speak.
📌 Key pivot = 3439.
Above it → Expansion.
Below it → Retracement.
Let August unfold — but stay sharp. The next big move will be born from this compression.
—
What’s your take — are we just getting started or about to cool off?
Drop your thoughts, chart it out, and stay ready for what August brings. ⚔️
—
❤️ Like if you enjoy clean, actionable updates🚀🚀🚀
🔁 Share with traders who love structure over noise
With clarity, confidence, and control,
GoldFxMinds
Fibo
SUI | Spot Buy Zone for PullbackPrice has pulled back after a local top and is heading toward a clear demand zone.
Key buy area sits around $3.12, aligned with 0.618 retracement and recent consolidation.
Strong structure below—if majors keep retracing, this is where risk/reward for new spot buys becomes attractive.
Plan:
Waiting for price to reach the green zone to accumulate spot.
Invalidation below $2.80, targeting a move back toward $4.45 and higher if momentum returns.

EURAUD → Correction for accumulation before growthFX:EURAUD reaches the zone of interest during a correction and forms a false breakdown of local support. Traders can switch to the buy side to support the trend.
Against the backdrop of a global bullish trend and a correction in the euro, the currency pair is following this movement, the essence of which is to consolidate funds for further growth. Liquidation is forming in relation to the liquidity zones of 1.785, 1.78, and 1.773, and the market imbalance is changing. The current movement is bringing the price to the zone of interest: the liquidity area of 1.773 and the order block. The capture of liquidity relative to 1.773 leads to the formation of a false breakdown and a pullback to the area of interest for buyers. Accordingly, price consolidation above 1.776 and 0.7 Fibonacci could support the main trend and allow the price to strengthen.
Support levels: 1.776, 1.773, 1.763
Resistance levels: 1.786, 1.795
The euro clearly demonstrates an upward trend, the structure of which has not been broken during the correction. Correction is a perfectly healthy movement within a trend, allowing positions to be opened at more favorable prices. If the bulls hold their defense above 1.776, momentum towards the specified targets may form.
Best regards, R. Linda!

XAUUSD Daily Sniper Plan – July 17-18, 2025Hello traders!
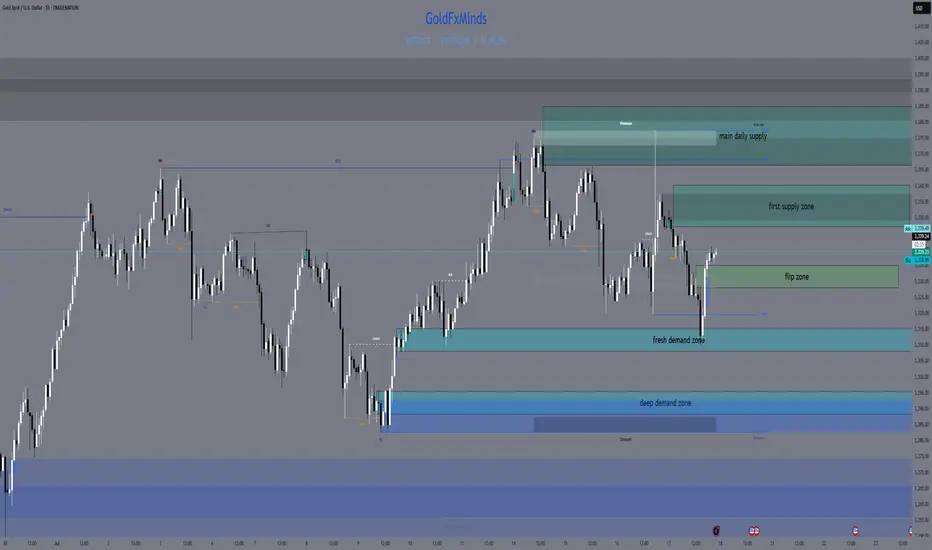
After yesterday’s high-volatility trap and NY session recovery, we now stand at a major structural junction. Buyers reclaimed 3310–3314 with precision, but price is pressing into multi-timeframe supply. Let’s break it down clearly
🔸 HTF Bias
Daily Bias: Bullish correction inside a larger range. Demand at 3310–3305 was swept and respected, but supply at 3347–3360 caps upside.
H4 Bias: Bullish flow into supply. Structure printed clean HLs from 3295–3310. However, current zone is full of short-term profit-taking risk.
H1 Bias: Bullish short-term trend. Price built higher lows from 3310, but now sits at 3340–3347 — reactive zone where momentum could fade if no breakout.
🔸 Key Structural Zones (with role)
🔺 Supply Zones (Above Price):
3347–3360 (D1/H4/H1 Supply)
🔹 Multi-timeframe confluence
🔹 Previous reaction + NY trap zone
🔹 Expect heavy rejection or false breakout wicks
3366–3385 (D1 Supply)
🔹 Final liquidity shelf for buyers
🔹 Only valid if 3347 breaks clean
🔹 Longs must wait for confirmation after breakout
⚔️ Decision Zones (Middle):
3335–3328 (Intraday Flip Zone)
🔹 M15-M30 structure control
🔹 Buyers can reload here on clean bounce
🔹 If price closes below, opens door for bearish momentum
🔻 Demand Zones (Below Price):
3314–3310 (H1/H4 Demand – Key Buy Area)
🔹 Institutional demand origin
🔹 Price tapped, swept, and reclaimed
🔹 Ideal sniper buys only on retest with bullish M15 BOS
3305–3295 (Deep Reversal Demand)
🔹 Extreme discount
🔹 Valid only if 3310 fails
🔹 High RR buys if liquidity sweep appears
🔸 Sniper Battle Plan 🎯
Scenario 1 – Fade from 3347–3360:
🔹 If rejection signs (M15 FVG + RSI divergence), short toward 3335, 3314
🔹 Only enter if NY open confirms exhaustion
Scenario 2 – Pullback to 3335–3328:
🔹 Ideal quick buys on bounce with confirmation
🔹 Watch for BOS on LTF for sniper entry
Today’s zones require real discipline: no rush, no panic — just clear steps, sharp entries, and clean rejections or retests. You already saw what 3310–3305 reacted. The next move? You plan it. You take it. You own it.
✨ Which zone are you watching for your next move?
Drop a comment, leave a 🚀🚀🚀and follow for more sniper-level clarity — every single day.
Let’s keep mastering this market. Together.
Disclosure: All plans are built on Trade Nation live feed. Educational only.
BTC — Long from Support Box (#4h) | BULLISH1. Buy: Limit order 115.5k–116.6k
2. Alert: If close < 113k, scenario invalid
3. Target: 125k

GH 3D: breakout forming inside ascending channelThe price of GH continues consolidating within the top of an ascending channel, confirming bullish structure. The rectangular accumulation has lasted for over three months, with price staying above all major EMAs and MAs - a strong trend confirmation. On the last impulse, volume increased, and now the price is compressing again. A breakout with a retest would serve as a valid entry. First target lies near 61.38, second at 73.66, and third at 87.37 - aligned with the upper range of the medium-term Fibonacci extension. Fundamentally, GH remains a promising biotech pick amid sector rotation and potential Fed easing. EMAs and MAs sit below price, and D/A supports the breakout scenario. Waiting for confirmation before entering.

PayPal: Rebound or Rerun?PayPal in 2025: A breakout with backbone or just another spineless fintech?
PayPal is still in the rehabilitation ward after its fall from grace in 2021. Management drama, growth slowdown — the full fintech fatigue package. But something has shifted behind the scenes. A new CEO is cutting costs, AI integration is being whispered about, and earnings have started to surprise again. Wall Street pretends not to notice — but volume tells a different story.
Technically, we’re looking at a well-formed inverse head and shoulders. The neckline stretches from $72.00 to $74.76, aligning with the 0.5 Fibonacci level. A confirmed breakout above this zone opens the path to a clear target at $93.66 — the 1.0 Fibonacci extension. Multiple EMA clusters and strong pattern symmetry reinforce the setup. But no fairy tales here: the real entry comes after a retest. Without confirmation, it’s just another pretty formation for chart enthusiasts.

XAUUSD 8H: This isn’t balance — it’s broadening distributionAt first glance, it may seem like gold is consolidating. In reality, price is unfolding inside a broadening formation — a structure where highs stretch higher, lows drop deeper, and real direction vanishes behind controlled volatility. This isn’t random noise. It’s Smart Money engineering a distribution phase under the cover of market indecision. And right now, the direction is forming clearly — downward.
The key moment was the failed breakout above 3357 on May 24. Volume spiked 19% above average, but the candle body collapsed. That’s a textbook deviation — a classic liquidity grab. The next candle confirmed the failure by closing back below the level, and no bullish recovery followed. Instead, price printed a lower high around 3305–3315, failing to retest the top. And when price can’t go higher — it usually goes lower.
Confirmation comes from the Anchored VWAP from May 13, which was broken cleanly and never retested. That’s a major shift in control — from buyer to seller. Now price trades below VWAP, with every bullish candle fading and every bearish reaction gaining strength. This is not trend continuation. This is exhaustion.
Volume profile shows the Point of Control between 3297 and 3301 — and price sits well below it. The bulk of liquidity is now overhead. That zone between 3305–3315 is where Smart Money already sold once — and if price returns there, it becomes an ideal re-entry short zone, especially if followed by rejection candles or low-volume pushups.
Targets are clean:
→ 3228 — first liquidity shelf.
→ 3164 — former impulse base.
→ 3084 — if breakdown accelerates.
Everything lines up: deviation, failed breakout, VWAP lost, volume fading, lower highs forming. This isn’t a pause. This is a phase transition — and the market already voted.

HOOD daily chart: breakout or fakeout? Key zone approaching.Robinhood's stock has formed a falling wedge pattern on the daily chart, indicating a potential bullish reversal. The price has broken above the 0.618 Fibonacci level at $44.00, suggesting further upside potential. Next targets are $48.40, $52.79, $58.22, and $67.00. RSI and MACD indicators confirm bullish momentum.
Fundamental Factors:
Robinhood continues to show revenue and profit growth, supporting positive investor sentiment. The company is expanding its services and attracting new users, strengthening its market position.
Scenarios:
Main scenario: continued rise to $48.40, then to $52.79 and higher.
Alternative scenario: pullback to $39.71 with potential decline to $36.00.

Bitcoin / Euro Pitchfork experimental ideaDoes Bitcoin / Euro give a new perspective compared to the usual Bitcoin / USD chart?
I drew a Modified Schiff Pitchfork with anchor-points December 2018, November 2021 and November 2022.
It seems to respect the Fib levels and 0.25, 0.5, 0.75, 1.0 levels well. Let´s see how it plays out.

BTCUSD down to 65k!!So in daily BTCUSD we have completed Elliott's wave 5.
Considering the doji as wave A 100% fibo, there's a 141,4% projection down to 65k near the Phicube's MME610. There are lower lows and lower highs being made.
There's another reading that the low around 78k was Elliott's C wave and we are starting a new cycle. However, the white LTB must be transpassed to confirm this possibility. Regarding this expressive green candle it was held back by LTB mentioned before.

SUI/USDTGlobally, the coin maintains an upward structure. A purchase of the coin can be considered during a Fibonacci correction.
Growth targets:
Target 1 = 4.2
Target 2 = 5.3

USD JPY Monthly Prospective Analysis up to 2060 (updated)This is the idea combined with elliott wave theory(I forgot to mention in the previous upload, but, in my chart, the number 2 wave corresponds to the 3 in the elliott and the 3 to the 5. The number 1 wave is the same as the 1 in the elliott). Up to 2027 the trend is down, bounced at around 85 and then going up all the way to reach around 170 (maybe does not reach 200 yen this time, that would be accomplished more than about 50 years later). Hope to live long to see if its correct!

Is This the Turning Point for BYBIT-SPECUSDT.P?Current Market Dynamics: A Pivot Moment for BYBIT-SPECUSDT.P
The cryptocurrency market often surprises, and BYBIT-SPECUSDT.P is no exception. Trading at $6.223, the asset finds itself 66.78% below its historical high of $18.735 from November 30, 2024, but also an impressive 46% above its absolute low of $4.262 in July 2024. Are we witnessing a buildup for the next major move?
The technical picture reveals key insights. The RSI14 on the hourly chart is deeply oversold at 26.15, indicating potential upward momentum brewing. Meanwhile, the MFI also signals undervaluation at 29.92. These indicators align with a possible bounce from the current consolidation zone.
A series of VSA Buy Patterns highlights a steady buying interest, with a recent 0.6% upward movement confirming bullish pressure. Yet, powerful resistance looms overhead at $7.055 and $7.452, which will need to break for a sustained rally.
The Intriguing Question: What's Next?
With prices hovering near critical levels, the stage is set for decisive action. Will bulls seize this as a launchpad for recovery, or are bears poised to press their advantage? The convergence of oversold signals and strong resistance tests could herald significant volatility.
Stay tuned for updates on this thrilling setup—your opportunity might just be around the corner.
Roadmap of BYBIT-SPECUSDT.P: A Playbook of Price Action
Understanding the market through its historical patterns is the key to staying ahead. Here’s a detailed breakdown of the major events shaping BYBIT-SPECUSDT.P, tracing each significant pattern and its price implications.
1. VSA Buy Pattern Extra 1st: January 23, 2025, 02:00 UTC
This bullish setup hinted at a potential upward movement. Price opened at $6.225, closed slightly lower at $6.216, and formed a low of $6.118. The main direction was Buy, signaling an impending bullish pressure.
Validation: The next pattern maintained a buying trajectory, closing higher in subsequent moves, confirming the accuracy of the bullish call.
2. VSA Buy Pattern Extra 1st: January 23, 2025, 01:00 UTC
A reinforcing bullish signal emerged, with an opening at $6.321 and a closing dip to $6.225, but this set the stage for a rebound. Low and high levels ($6.162 to $6.733) indicated market hesitation before the trend firmed up.
Validation: The direction remained consistent, as subsequent candles edged higher, confirming the trigger point's reliability.
3. VSA Buy Pattern Extra 1st: January 23, 2025, 00:00 UTC
This pattern marked an uptick in bullish confidence. The price action fluctuated between $6.277 and $6.912, with a clear move aligning with the Buy main direction.
Validation: A steady upward movement followed, further strengthening the bullish narrative.
4. Increased Sell Volumes: January 22, 2025, 20:00 UTC
A stark contrast emerged as the sell volumes peaked. Prices opened at $6.704 and plummeted to close at $6.456, setting a bearish undertone.
Validation: This pattern effectively predicted the selloff that extended into subsequent bars, proving its worth as a reversal indicator.
5. VSA Buy Pattern Extra 1st: January 22, 2025, 00:00 UTC
The market flipped bullish again, with the price moving from $6.905 to $6.628. A decisive direction shift was signaled.
Validation: True to its bullish call, this pattern initiated a recovery, validated by later price movement above the $6.7 zone.
Key Insights for Traders
Patterns that align with subsequent price action (e.g., VSA Buy Pattern Extra 1st) consistently deliver actionable signals. Increased Sell Volumes can provide crucial early warnings of reversals, enabling traders to hedge effectively. Adhering to trigger points ensures higher accuracy and confidence in trading decisions.
This roadmap not only reflects historical accuracy but also provides a guide for spotting actionable opportunities in real time.
Technical & Price Action Analysis: Key Support and Resistance Levels
Trading is all about catching the bounce or riding the breakout. Here’s the rundown of the key levels for BYBIT-SPECUSDT.P that traders should keep their eyes on. Remember, if these levels don’t hold, they’ll flip into resistance and become roadblocks for price action.
Support Levels:
First up, we’re looking at a soft landing zone that could provide a decent bounce opportunity. Monitor how the price reacts to this area to gauge momentum.
Resistance Levels:
The immediate barriers lie at $7.055, $7.452, and $7.968. These are the lines in the sand where bulls will face heavy fire. If the price can't break through, expect reversals back to support.
Powerful Support Levels:
Not much firepower here, meaning the price may lack strong buying interest on the downside.
Powerful Resistance Levels:
Eyes are on $5.539—this is the rock where many moves may stall. If this level flips into support, it’ll be a key confirmation of bullish dominance.
Pro Tip:
Keep an eye on how the price interacts with these levels. If a support doesn’t hold, it’s not just a miss—it’s a new ceiling traders will have to deal with. Always be prepared to pivot and adapt.
Trading isn’t about guessing—it’s about reacting. These levels are your roadmap to staying ahead of the pack.
Concept of Rays: Trading Strategies Based on Fibonacci Rays
The "Rays from the Beginning of Movement" concept provides a structured yet flexible system for analyzing and trading market movements. It combines Fibonacci principles with dynamic price behavior and technical analysis, creating a unique tool for identifying opportunities. Let’s dive into how to use this method effectively.
Core Idea
Fibonacci Rays form dynamic boundaries that guide price movements, signaling potential reversals or continuations. These rays interact with key levels and Moving Averages (MA50, MA100, MA200) to highlight zones where significant price action occurs.
The principle is simple: trade after price interaction with a ray and the appearance of a clear directional movement. This ensures higher confidence and allows riding the trend between rays.
Optimistic Scenario: Targets for Bulls
If the price interacts with ascending rays and shows strength, we target the next resistance levels.
First Target: $7.055 – A move above MA50 aligns with this zone, signaling continuation to $7.452.
Second Target: $7.968 – As price confirms momentum, this level becomes the next checkpoint.
Third Target: $10.057 – A breakout here could unlock higher levels, supported by interaction with MA200.
Pessimistic Scenario: Targets for Bears
Should price react to descending rays or fail to hold support levels, bearish setups become actionable.
First Target: $5.539 – Breakdown through MA50 and interaction with descending rays suggests further downside.
Second Target: $4.800 – A continuation of bearish momentum will likely test this zone.
Third Target: $4.262 – Retesting the absolute low completes this scenario.
Dynamic Price Interaction and Moving Averages
When price interacts with key Moving Averages, it strengthens the ray’s significance. For example:
Price holding above MA50 and interacting with an ascending ray indicates bullish continuation to the next ray.
Rejection at MA200, coupled with descending ray interaction, confirms bearish potential.
Suggested Trade Setups
Long Trade: Enter after price bounces off an ascending ray and moves above $7.055. First target: $7.452, then $7.968.
Short Trade: Enter after rejection at $6.800 (near MA100), targeting $5.539. Keep stops above MA100 to manage risk.
Swing Trade: If price consolidates near MA200 and interacts with rays, look for breakout or breakdown to capture the move toward the next ray level.
Scalping Trade: Use minor ray interactions for quick entries and exits, targeting the immediate next ray for profits.
Final Thoughts
The interplay of Fibonacci Rays, key levels, and Moving Averages provides a structured yet adaptive trading framework. By aligning trades with these dynamics, traders can capture movements with high confidence, knowing each step is guided by natural market principles.
Current Market Dynamics: A Pivot Moment for BYBIT-SPECUSDT.P
The cryptocurrency market often surprises, and BYBIT-SPECUSDT.P is no exception. Trading at $6.223, the asset finds itself 66.78% below its historical high of $18.735 from November 30, 2024, but also an impressive 46% above its absolute low of $4.262 in July 2024. Are we witnessing a buildup for the next major move?
The technical picture reveals key insights. The RSI14 on the hourly chart is deeply oversold at 26.15, indicating potential upward momentum brewing. Meanwhile, the MFI also signals undervaluation at 29.92. These indicators align with a possible bounce from the current consolidation zone.
A series of VSA Buy Patterns highlights a steady buying interest, with a recent 0.6% upward movement confirming bullish pressure. Yet, powerful resistance looms overhead at $7.055 and $7.452, which will need to break for a sustained rally.
The Intriguing Question: What's Next?
With prices hovering near critical levels, the stage is set for decisive action. Will bulls seize this as a launchpad for recovery, or are bears poised to press their advantage? The convergence of oversold signals and strong resistance tests could herald significant volatility.
Stay tuned for updates on this thrilling setup—your opportunity might just be around the corner.
Roadmap of BYBIT-SPECUSDT.P: A Playbook of Price Action
Understanding the market through its historical patterns is the key to staying ahead. Here’s a detailed breakdown of the major events shaping BYBIT-SPECUSDT.P, tracing each significant pattern and its price implications.
1. VSA Buy Pattern Extra 1st: January 23, 2025, 02:00 UTC
This bullish setup hinted at a potential upward movement. Price opened at $6.225, closed slightly lower at $6.216, and formed a low of $6.118. The main direction was Buy, signaling an impending bullish pressure.
Validation: The next pattern maintained a buying trajectory, closing higher in subsequent moves, confirming the accuracy of the bullish call.
2. VSA Buy Pattern Extra 1st: January 23, 2025, 01:00 UTC
A reinforcing bullish signal emerged, with an opening at $6.321 and a closing dip to $6.225, but this set the stage for a rebound. Low and high levels ($6.162 to $6.733) indicated market hesitation before the trend firmed up.
Validation: The direction remained consistent, as subsequent candles edged higher, confirming the trigger point's reliability.
3. VSA Buy Pattern Extra 1st: January 23, 2025, 00:00 UTC
This pattern marked an uptick in bullish confidence. The price action fluctuated between $6.277 and $6.912, with a clear move aligning with the Buy main direction.
Validation: A steady upward movement followed, further strengthening the bullish narrative.
4. Increased Sell Volumes: January 22, 2025, 20:00 UTC
A stark contrast emerged as the sell volumes peaked. Prices opened at $6.704 and plummeted to close at $6.456, setting a bearish undertone.
Validation: This pattern effectively predicted the selloff that extended into subsequent bars, proving its worth as a reversal indicator.
5. VSA Buy Pattern Extra 1st: January 22, 2025, 00:00 UTC
The market flipped bullish again, with the price moving from $6.905 to $6.628. A decisive direction shift was signaled.
Validation: True to its bullish call, this pattern initiated a recovery, validated by later price movement above the $6.7 zone.
Key Insights for Traders
Patterns that align with subsequent price action (e.g., VSA Buy Pattern Extra 1st) consistently deliver actionable signals. Increased Sell Volumes can provide crucial early warnings of reversals, enabling traders to hedge effectively. Adhering to trigger points ensures higher accuracy and confidence in trading decisions.
This roadmap not only reflects historical accuracy but also provides a guide for spotting actionable opportunities in real time.
Technical & Price Action Analysis: Key Support and Resistance Levels
Trading is all about catching the bounce or riding the breakout. Here’s the rundown of the key levels for BYBIT-SPECUSDT.P that traders should keep their eyes on. Remember, if these levels don’t hold, they’ll flip into resistance and become roadblocks for price action.
Support Levels:
First up, we’re looking at a soft landing zone that could provide a decent bounce opportunity. Monitor how the price reacts to this area to gauge momentum.
Resistance Levels:
The immediate barriers lie at $7.055, $7.452, and $7.968. These are the lines in the sand where bulls will face heavy fire. If the price can't break through, expect reversals back to support.
Powerful Support Levels:
Not much firepower here, meaning the price may lack strong buying interest on the downside.
Powerful Resistance Levels:
Eyes are on $5.539—this is the rock where many moves may stall. If this level flips into support, it’ll be a key confirmation of bullish dominance.
Pro Tip:
Keep an eye on how the price interacts with these levels. If a support doesn’t hold, it’s not just a miss—it’s a new ceiling traders will have to deal with. Always be prepared to pivot and adapt.
Trading isn’t about guessing—it’s about reacting. These levels are your roadmap to staying ahead of the pack.
Concept of Rays: Trading Strategies Based on Fibonacci Rays
The "Rays from the Beginning of Movement" concept provides a structured yet flexible system for analyzing and trading market movements. It combines Fibonacci principles with dynamic price behavior and technical analysis, creating a unique tool for identifying opportunities. Let’s dive into how to use this method effectively.
Core Idea
Fibonacci Rays form dynamic boundaries that guide price movements, signaling potential reversals or continuations. These rays interact with key levels and Moving Averages (MA50, MA100, MA200) to highlight zones where significant price action occurs.
The principle is simple: trade after price interaction with a ray and the appearance of a clear directional movement. This ensures higher confidence and allows riding the trend between rays.
Optimistic Scenario: Targets for Bulls
If the price interacts with ascending rays and shows strength, we target the next resistance levels.
First Target: $7.055 – A move above MA50 aligns with this zone, signaling continuation to $7.452.
Second Target: $7.968 – As price confirms momentum, this level becomes the next checkpoint.
Third Target: $10.057 – A breakout here could unlock higher levels, supported by interaction with MA200.
Pessimistic Scenario: Targets for Bears
Should price react to descending rays or fail to hold support levels, bearish setups become actionable.
First Target: $5.539 – Breakdown through MA50 and interaction with descending rays suggests further downside.
Second Target: $4.800 – A continuation of bearish momentum will likely test this zone.
Third Target: $4.262 – Retesting the absolute low completes this scenario.
Dynamic Price Interaction and Moving Averages
When price interacts with key Moving Averages, it strengthens the ray’s significance. For example:
Price holding above MA50 and interacting with an ascending ray indicates bullish continuation to the next ray.
Rejection at MA200, coupled with descending ray interaction, confirms bearish potential.
Suggested Trade Setups
Long Trade: Enter after price bounces off an ascending ray and moves above $7.055. First target: $7.452, then $7.968.
Short Trade: Enter after rejection at $6.800 (near MA100), targeting $5.539. Keep stops above MA100 to manage risk.
Swing Trade: If price consolidates near MA200 and interacts with rays, look for breakout or breakdown to capture the move toward the next ray level.
Scalping Trade: Use minor ray interactions for quick entries and exits, targeting the immediate next ray for profits.
Final Thoughts
The interplay of Fibonacci Rays, key levels, and Moving Averages provides a structured yet adaptive trading framework. By aligning trades with these dynamics, traders can capture movements with high confidence, knowing each step is guided by natural market principles.
Let’s Keep the Conversation Going!
Got questions about the analysis or want to dive deeper into the strategy? Drop your thoughts in the comments—I’m here to discuss, clarify, and explore new ideas with you.
If you found this post helpful, don’t forget to hit Boost and save it for later. This way, you can revisit it as the price action unfolds and see how it aligns with my ray-based levels. Trust me, understanding these key interaction points is a game-changer for your trading.
For those curious about the ray system: my indicator automatically maps out all the levels and rays, simplifying your analysis. It’s a private tool, but if you’re interested, send me a message—I’ll explain how you can access it.
Want a custom analysis for your favorite asset? Let’s make it happen! I’m open to creating free public insights or discussing private, tailored breakdowns for your strategy. My ray system works across all assets, and I can provide precise setups just for you.
If there’s an asset you’d like me to chart, simply comment below and hit Boost to show your interest. I’ll do my best to prioritize it.
Finally, don’t miss out—follow me here on TradingView for more insights, strategies, and unique ideas. Your feedback, questions, and engagement fuel this community, and I can’t wait to connect with all of you. Happy trading!

JUP/USDT: A Critical Crossroad - Is the Market Poised for a TurnThe Tides Are Shifting
As we step into 2025, JUP/USDT finds itself teetering on a fine edge. Trading at $0.8152, the pair has retraced by over 55.9% from its all-time high of $1.8496 reached in April 2024. Yet, the spotlight now turns to emerging bullish signals and a question looms: Are we witnessing a bottom or merely a pause before further declines?
The RSI (14) on the daily chart suggests oversold conditions at 32.68, signaling the potential for a rebound. Meanwhile, the MFI (60) at a low 29.68 reinforces this notion, reflecting dwindling sell-side pressure. However, the story becomes more intriguing when you factor in the interplay of patterns like the "Buy Volumes Takeover," hinting at a potential shift in momentum.
Yet, this is no time for complacency. With support levels lurking at $0.777 and $0.738, and resistance firmly set at $0.9017, the market faces a critical juncture. The breach of these barriers will likely define the trajectory for days to come.
What lies ahead? Will bulls seize control and drive a recovery, or does the market have further to fall? The answer could hold opportunities for both traders seeking short-term volatility and investors eyeing long-term gains.
Roadmap of JUP/USDT Patterns: Tracing the Moves
The Journey Begins: "Sell Volumes Max" (2025-01-20 17:00 UTC)
The pattern “Sell Volumes Max” kicked things off with a strong bearish vibe, closing at $0.912 after opening at $0.9657. True to its direction, subsequent patterns confirmed the continuation of selling pressure, with the next session plunging further into bearish territory. This was the moment where the bears took the reins.
A Glimpse of Hope: "VSA Buy Pattern Extra 2nd" (2025-01-20 17:00 UTC)
Enter the bullish contender. The “VSA Buy Pattern Extra 2nd” hinted at a recovery, but the subsequent “Sell Volumes Max” overpowered the buy signal, showing that bulls failed to secure dominance. This invalidated the potential reversal from the extra buy setup.
Reconfirmation of Bears: "Sell Volumes Max" (2025-01-21 04:00 UTC)
Another bearish signal appeared, and this time it delivered. Prices continued their southward journey, reinforcing the bearish momentum as the market respected the trigger points. The consistency here set the stage for further declines, proving this sell pattern’s reliability.
The Turnaround Begins: "VSA Buy Pattern Extra 1st" (2025-01-21 04:00 UTC)
Finally, the bulls struck back. This time, the pattern held its ground, with the market beginning to pivot upward in the following sessions. The trigger was validated, and the price began building upward momentum, signaling a potential long-term shift.
Bullish Revival: "VSA Manipulation Buy Pattern 4th" (2025-01-22 15:00 UTC)
The fourth iteration of the “VSA Manipulation Buy” emerged as the hero pattern. After a slow build-up, the market began respecting its bullish bias, breaking past the three-bar low triggers. Prices closed higher, confirming a significant turn in market sentiment.
Buy Dominance Confirmed: "Buy Volumes Take Over" (2025-01-22 16:00 UTC)
To seal the deal, the “Buy Volumes Take Over” reinforced the bullish sentiment, with prices moving decisively upward from this point. The sequence of bullish patterns successfully outperformed previous sell signals, marking this as a pivotal point in the trend’s evolution.
What’s Next?
Looking at the roadmap, we’ve seen a fascinating interplay between buyers and sellers. Patterns like “Sell Volumes Max” set the tone for a bearish leg, but it’s the precise recovery of buy patterns that brought balance back to the game.
Stay tuned, traders. The next chapter could redefine the market’s direction—are you ready to catch the wave?
Technical & Price Action Analysis: Key Levels on the Radar
Here’s the breakdown of the key zones that every trader should have pinned to their charts. These levels are where the action happens—either as bounce points or barriers. If the price fails to respect these zones, don’t sweat it; they’ll likely flip into resistance or support depending on the move.
Support Levels
0.777 – The first line of defense. If buyers can’t hold it, expect it to flip and act as a ceiling. 0.738 – A critical level for bulls to step in. If breached, it’s game over for a deeper dip.
Resistance Levels
0.9017 – The big hurdle. Bulls need to clear this to reclaim control. If not, it turns into a tough ceiling that could cap any rallies.
Powerful Support Levels
1.371 – The heavyweight champion of supports. If tested, it’s where we’d expect some serious buying pressure. But if it breaks, buckle up for some turbulence.
Powerful Resistance Levels
0.5783 – A fortress in the bears’ favor. Bulls breaking through here would signal a major shift in momentum.
The Golden Rule
Respect the levels, but stay nimble. If a support level cracks or a resistance gets shattered, flip your bias—these same levels will play for the other team as the market evolves. As always, let price action be your guide and keep it sharp!
Trading Strategies Using Rays: The Power of Fibonacci Dynamics
Concept of Rays
The "Rays from the Beginning of Movement" concept redefines precision trading. By leveraging Fibonacci mathematical and geometric principles, we construct rays that act as dynamic guides, predicting where the price might pivot or accelerate. These rays are drawn from the inception of a trend, not traditional extremum points, allowing traders to stay ahead of new trend phases or corrections.
Why It Works
Markets are complex, and predicting exact levels is often a fool’s errand. However, rays provide zones of high probability for price interaction. When paired with moving averages (MA50, MA100, etc.), these zones highlight key areas of potential reversals or continuations. Each ray and corresponding MA serve as stepping stones in the market, marking paths for price action.
Price interaction with rays, supported by Volume Spread Analysis (VSA), signals the ideal moment to enter trades—whether it's bouncing off a ray or breaking through it toward the next.
Optimistic Scenario
Price respects the Fibonacci ray levels and moving averages, triggering bullish momentum.
Entry: After price interacts with Support 0.777, supported by MA233 at 0.8756, and confirms upward movement. First Target: Resistance 0.9017 – Watch for a breakout or a pause. Second Target: Powerful Resistance 1.371 – Anticipate heightened activity at this zone.
Pessimistic Scenario
Bearish pressure dominates, breaking supports and interacting with descending rays.
Entry: After price breaks below Support 0.738, retests it, and interacts with descending rays, signaling continuation. First Target: Dynamic MA support near 0.675 – Aligns with descending ray zone. Second Target: Powerful Support 0.5783 – A likely point for consolidation or bounce.
Proposed Trades Based on Ray Interactions
Bullish Bounce from 0.777
This level, supported by ascending rays, presents a strong buying opportunity. Wait for confirmation through volume spikes or bullish candle patterns.
Breakout Trade Above 0.9017
If price interacts with ascending rays and MA50 before breaking this resistance, initiate a long trade targeting 1.371.
Bearish Breakdown Below 0.738
A clean break of this support, coupled with descending ray interaction, opens a short setup targeting 0.5783.
Dynamic MA Trade at 0.8756 (MA233)
If the price reverses near this level, supported by rays, it signals a strong continuation setup for trend followers.
Key Takeaways
Patience is Key: Always wait for price interaction with rays and MAs before entering.
Target the Rays: Movement from one ray to the next is often enough to secure solid profits.
Adaptability: Rays automatically adjust to new patterns, keeping you ahead in dynamic markets.
Trade smart, let the rays guide you, and ride the trends from zone to zone!
Let’s Stay Connected!
Hey there, fellow traders! If you’ve made it this far, it means you’re serious about improving your trading game, and I’m here to help. Have questions or thoughts about the analysis? Drop them in the comments below—I read and respond to everything, and your feedback is always appreciated. Let’s keep the conversation going!
Liked the roadmap? Don’t forget to hit Boost and save this idea to revisit later. Watching how price respects these rays and levels is crucial for sharpening your trading instincts. Remember: it’s not just about predictions—it’s about understanding key reaction points.
By the way, the rays and levels you see here? They’re automatically plotted by my private indicator-strategy. If you’re curious to use it, feel free to send me a private message to discuss access.
Need a custom analysis for your favorite asset? Let me know in the comments. I can create a detailed breakdown—either publicly for the community or privately if you prefer to keep your strategy under wraps. Whether it’s crypto, forex, or stocks, these rays work on all markets, and I’d be happy to personalize them for you.
Lastly, don’t forget to follow me here on TradingView to stay updated on all my latest ideas. Let’s build a community of smarter, more confident traders—starting with you. 🚀

BITCOIN → Correction before further flight to 112-120KBINANCE:BTCUSD surprises everyone again with this week's rally. After retesting the panic and risk zone, when many started selling, the price turned around and flew 18% in a few days....
One week old idea: BITCOIN → Retest of key support. What can happen?
There could be several factors behind the gains that have been forged over the past 3 days:
New reports point to increased activity from major players, including institutional investors,
Trump's upcoming inauguration, the crypto community is expecting the new president to take active steps. And overall, the bullish three-day run is a combination of macroeconomic factors, technical breakdown and fundamental confidence in the future of cryptocurrencies. All of this created a strong bullish momentum that attracted new buyers and increased institutional investor interest.
From a technical perspective, the 100K and 102.5K area plays an important role for me. If the bulls can keep the price above this zone, the growth will continue in the medium term.
Support levels: 102.5K, 100K
Resistance levels: 103.6K, 105.7K, 107.5K
Technically, at the moment, a pre-breakdown situation is forming on H1 against the support at 102.8. Accordingly, bitcoin may form a correction to both 100K and 97.5K. But, if the fall will quickly recover or the bulls will keep the defense above 100-102.5K, then further we can count on growth up to 108-112K.
Regards R. Linda!

Is AIDOGEUSDT Ready to Bark Back? Key SignalsAIDOGEUSDT is sitting at a critical juncture with the current price at $0.002035, reflecting a steep decline of 78.08% from its all-time high of $0.009286, set just under a year ago. After bouncing 25.07% off its absolute low, the asset finds itself on a knife’s edge—oversold according to the RSI14 at 19.2. This could indicate a brewing shift in momentum.
Recent patterns in sell volumes and VSA buy signals are fighting for dominance, with key resistance levels like $0.002174 looming ahead. Coupled with macroeconomic uncertainty and rising speculative interest, the question remains: is this a trap or the start of a reversal?
For traders and investors, the urgency is palpable. With long-term averages slumping below key supports, and a convergence of powerful resistance near $0.0024, today’s setup demands attention. Will AIDOGEUSDT claw its way back, or is the worst yet to come?
Stay tuned—this could be your defining moment in this unpredictable crypto saga.
Roadmap: Tracing the Momentum of AIDOGEUSDT through Recent Patterns
Dive deep into the pulse of AIDOGEUSDT as we dissect the most recent series of patterns using a roadmap that tracks not just their presence but their actual impact on price action. Here's how the action played out:
1. VSA Buy Pattern Extra 1st (2025-01-19 09:00 UTC)
Direction: Buy
Analysis: The "VSA Buy Pattern Extra 1st" signaled potential upward momentum after the close at $0.002174. Despite this signal, the next pattern saw a "Sell Volumes" direction take control, showing no upward breakout from the previous trigger. This invalidated the buy setup, making it a "watch-and-wait" moment for traders.
2. Increased Sell Volumes (2025-01-19 11:00 UTC)
Direction: Sell
Analysis: Here comes the game-changer. With a close at $0.002035, the sell direction hit hard, accurately reflecting the downward momentum predicted by the pattern. The next movement confirmed the strength of the selling wave, solidifying this as a reliable bearish signal.
3. VSA Buy Pattern Extra 1st (2025-01-19 08:00 UTC)
Direction: Buy
Analysis: The earlier "Buy Pattern" appeared again, but the rally was short-lived as subsequent sell volumes dampened enthusiasm. This reiteration failed to confirm a buy breakthrough, showcasing the dominance of bearish pressure.
4. VSA Sell Pattern 3rd (2025-01-18 15:00 UTC)
Direction: Sell
Analysis: True to its nature, this sell pattern accurately set up a bearish swing, with the next candles reflecting a consistent downward drift. A textbook example of pattern precision that delivered what it promised.
5. Increased Buy Volumes (2025-01-18 00:00 UTC)
Direction: Buy
Analysis: Bulls finally showed some teeth here, pushing the price from $0.002649 to $0.002776. This pattern proved spot-on, as it marked the beginning of a brief recovery before sellers regained control.
6. VSA Manipulation Sell Pattern 3rd (2025-01-17 17:00 UTC)
Direction: Sell
Analysis: Bears ruled the show again, with the price tracking downward in line with the signal. The movement reinforced the bearish bias and gave traders a clear shorting opportunity.
7. Buy Volumes Max (2025-01-17 02:00 UTC)
Direction: Buy
Analysis: This buy signal didn’t disappoint, as the price pushed upward momentarily. While it didn’t lead to a long-term trend change, it offered short-term traders a golden scalp opportunity.
8. VSA Buy Pattern 3 (2025-01-14 21:00 UTC)
Direction: Buy
Analysis: The buy pattern highlighted an early rally, but its short lifespan reflected the broader market weakness. The directional signal worked in the moment, although macro bears soon overwhelmed the momentum.
Conclusion
Patterns don't just tell a story—they set the stage for actionable insights. For AIDOGEUSDT, the roadmap reveals a fascinating interplay of bullish and bearish pressures, with sell patterns delivering some of the most reliable setups. Keep this roadmap in mind as we watch the next moves, and remember: in the crypto game, patterns are your allies, but confirmation is king.
Technical & Price Action Analysis: Key Support and Resistance Levels
Here's the breakdown of the most critical levels for AIDOGEUSDT that every trader should have on their radar. These zones will act as battlefields between bulls and bears. If they fail to hold, expect these same levels to flip and become stubborn resistance on the way back up.
Support Levels:
These are the lifelines for the bulls. Watch for bounces here:
0.002174 – The immediate support zone that needs to hold to maintain any bullish vibe.
0.002392 – A deeper dip could see buyers stepping in here to defend.
0.002806 – A solid mid-range level that can act as a springboard for recovery.
Resistance Levels:
These levels are where the bulls will face heavy resistance if the price moves upward:
0.003052 – A critical line in the sand. A break and hold above this could ignite bullish momentum.
0.003158 – The upper limit where sellers might hit back hard.
Powerful Support Levels:
Stronger zones that bulls must guard fiercely:
0.004612 – A major inflection point. If price reaches this, it’s a do-or-die level.
0.005384 – Bulls would need to regroup here if the sell-off gets intense.
0.00743 – A key long-term zone that may decide the trend direction.
Powerful Resistance Levels:
Big money might step in here to cap upward moves:
0.001873 – Immediate resistance that’s been a thorn for bulls.
The Takeaway
Respect these levels like they’re your trading roadmap. If a support fails, it’s not the end of the story—it’s the beginning of a new resistance. Keep your eyes sharp, manage your stops tight, and let the price action guide your decisions.
Trading Strategies with Rays: A Systematic Approach to Market Movements
Concept of Rays
The "Rays from the Beginning of Movement" methodology leverages Fibonacci-based dynamic levels that align with natural proportions. Unlike traditional analysis focused on static extremum points, these rays adapt to new patterns and highlight interaction zones where price either reverses or continues its trend. By incorporating moving averages (MAs) as dynamic factors, this system offers a robust approach to identifying trade setups.
How It Works
Fibonacci Rays: Define key movement boundaries based on the initial movement pattern.
Dynamic Interaction: Price reactions at ray intersections with MAs confirm trade opportunities.
Action Zones: Use VSA rays and MAs for confirmation before entering positions.
Scenarios: Price moves from one ray to the next, creating clear targets for trades.
Two Scenarios: Optimistic and Pessimistic
Optimistic Scenario: Price interacts with ascending rays and finds support at dynamic MA levels, signaling a bullish continuation.
Entry Zone: $0.002174 (immediate support and ray interaction).
Target 1: $0.002392 (first ascending ray).
Target 2: $0.002806 (next ray with strong resistance potential).
Moving Averages: A price break above MA50 and MA100 strengthens bullish confidence.
Pessimistic Scenario: Price fails to hold critical support and interacts with descending rays, leading to bearish continuation.
Entry Zone: $0.002035 (near powerful resistance, now acting as support).
Target 1: $0.001873 (next descending ray).
Target 2: $0.001627 (powerful historical support ray).
Moving Averages: A breakdown below MA233 confirms further downside pressure.
Suggested Trade Setups
Buy Setup (Bullish Scenario): Enter long at $0.002174 if the price interacts positively with ascending rays and MA50. Exit partially at $0.002392 and hold for $0.002806.
Sell Setup (Bearish Scenario): Short at $0.002035 if the price breaks below descending rays and MA233. Partial profits at $0.001873, and hold for a possible test of $0.001627.
Scalp Strategy: Use ray-to-ray movements for quick trades, focusing on dynamic resistance and support zones, such as $0.002174 to $0.002392.
Swing Trade: Aim for extended movements, aligning with ray trajectories and MA trends, such as $0.002035 to $0.001627 in a bearish scenario.
Key Notes
Every trade begins with interaction at the rays and requires confirmation from volume analysis (VSA) or price patterns. Whether bullish or bearish, the journey from one ray to the next provides traders with clear, actionable targets while minimizing guesswork.
Trading is all about precision, understanding, and growth—and I’m here to help you navigate the market with confidence. If you’ve got questions about this analysis or want to share your thoughts, drop them in the comments below. Let’s discuss, learn, and grow as a community.
If you found this roadmap useful, don’t forget to hit that Boost button and save the idea to revisit later. Track how the price reacts to the levels and rays I’ve outlined—because mastering those key points is the foundation of successful trading.
My custom indicator draws all the rays and levels automatically, making analysis faster and more accurate. It’s currently available privately, so if you’re interested in trying it out, feel free to send me a private message for details.
Need analysis on another asset? Let me know in the comments! I can create setups for any instrument, and while some will be free for public access, I’m open to creating personalized setups for private use as well. My rays work on any asset, so whether it’s crypto, forex, stocks, or commodities, I’ve got you covered.
If you enjoy this kind of content, make sure to follow me here on TradingView. It’s where I share all my ideas and strategies to help traders like you make informed decisions.
Let’s build something amazing together—one trade at a time. 🚀

Solana Pulse: Is the Breakout Just Around the Corner?The Solana Market Stirs: A Turning Point Ahead?
The Solana (SOL) market, trading at $186.41, is teetering at a critical juncture. Despite standing 29.6% below its all-time high of $264.88 reached in November 2024, recent patterns indicate brewing momentum. The 50-day Moving Average (MA50) now sits below the 200-day Moving Average (MA200), signaling cautious sentiment, yet its proximity hints at a potential reversal. Simultaneously, the RSI at 46.38 suggests a market leaning toward oversold conditions, adding fuel to speculative buy signals.
Yesterday’s candlestick unveiled a notable VSA Buy Pattern—an archetypal signal for an upward move after price manipulation. Will the market surge past resistance levels at $192.57 and beyond? Or does this rally face exhaustion against bearish currents? The next move might determine the trajectory for weeks to come.
Are traders ready to seize this opportunity, or will hesitation cost them the climb? The market waits for no one—today could be the moment to act.
Historical Roadmap of Solana Market: Pattern Analysis That Worked
January 13th, 2025, 15:00 UTC – The Surge: VSA Buy Pattern Meets Momentum
A classic VSA Buy Pattern 3 emerged, forecasting a bullish breakout. The trigger point at $185.53 was perfectly tested as the price soared, closing higher at $186.58 in the following session. This pattern held its ground, with the market respecting the bullish direction and moving upwards, confirming the anticipated trajectory. Investors caught in the buy zone saw a 4.52% movement unfold, reinforcing this as a textbook upward setup.
January 14th, 2025, 07:00 UTC – Market Turns: Sell Volume Dominance
In contrast, the VSA Sell Pattern 2 hinted at a downward move with its main direction pointing south. The price began its decline from an open of $186.24, confirming the sell-off by closing at $185.51. This bearish sentiment played out accurately as subsequent prices respected the lower lows. Smart money taking shorts at this level maximized gains on this predictable pivot.
January 14th, 2025, 17:00 UTC – Reversal Play: Bulls Take Charge Again
The VSA Buy Pattern 3rd reappeared with bullish energy. Starting from $186.42, the market crept up to $186.58. This movement, though smaller in scale, validated the pattern’s bullish main direction. Buyers holding positions here witnessed steady upward momentum, setting the stage for further resistance tests.
Connecting the Dots: Patterns That Shaped the Chart
Directional Accuracy: Each confirmed pattern respected its forecasted direction, with subsequent candlesticks affirming the anticipated moves. Momentum Drivers: Bullish setups like the VSA Buy Pattern thrived, especially when trigger points aligned with market sentiment. Misses to Note: Any unconfirmed patterns have been excluded, ensuring focus remains on actionable insights. Key Takeaway: Both traders and investors gained confidence as historical patterns not only worked but provided strategic entry and exit opportunities.
What’s Next for Solana?
The roadmap shows a pattern of precise movements, confirming the strength of technical setups. With resistance at $192.57 just ahead, will the bulls manage to keep their momentum alive, or is the next turn a bearish storm waiting to brew? Stay tuned as these patterns continue to shape the market’s destiny.
Technical & Price Action Analysis: Key Levels to Watch
Here’s a rundown of the most critical support and resistance levels in play for Solana. These levels are magnets for price action, and if they fail to hold, expect a swift role reversal, with former support becoming resistance and vice versa.
Support Levels
$223.20 – A powerful support zone. If bulls lose their grip here, this level could quickly flip to resistance, capping future rallies. $192.57 – The immediate line in the sand for the bulls. Failure to defend this level may invite aggressive selling pressure. $185.68 (MA100) – A dynamic support area aligning with moving averages. Watch for bounces or breakdowns around this point. $184.48 (MA50) – The frontline for near-term support. A break here could spell trouble for bullish momentum.
Resistance Levels
$192.57 – The first major barrier for bulls to conquer. This double-duty level is both a resistance and potential support pivot. $201.17 – A key psychological and technical zone. Watch for volume surges to confirm a breakout. $203.61 – A higher target within range. Failure here could indicate exhaustion. $214.76 – A line of strong resistance. Bulls need conviction to claim this territory. $224.20 – Top-tier resistance aligned with the powerful support zone at $223.20. If bulls reclaim this, it’s game on.
Powerful Resistance Levels
$157.83 – Previously a stronghold, now a ceiling. This level must be broken for a sustainable recovery. $99.98 – A key historical pivot. Any moves here signal high stakes. $73.07 – A distant checkpoint, currently irrelevant but critical in extended downtrends.
The Golden Rule
If these levels don’t hold their ground, their status flips, and they’ll act as tough hurdles for any future price moves. In this market, every level tells a story—watch for the clues!
Trading Strategies Using Rays: A Dynamic Approach
Concept of Rays: The Art of Dynamic Price Prediction
Rays, based on Fibonacci principles and geometric alignments, offer a predictive framework for price interaction zones. Unlike classical methods focusing on static highs and lows, rays begin from the start of a movement, adapting dynamically to new patterns. They are designed to define the movement’s boundaries and allow traders to identify optimal entry points post-interaction.
When price touches a ray, it often signals either a reversal or a continuation, with dynamic factors—like moving averages—playing a decisive role. Each movement is likely to progress from one ray to the next, offering clear targets for your trades.
Two Scenarios for Trading Rays
Optimistic Scenario
Price interacts positively with a key ray and finds support at MA50 ($184.48) or MA100 ($185.68), confirming a bullish continuation.
The first target becomes $192.57, aligning with a critical resistance zone.
Subsequent movements aim for $201.17 and $203.61, following a breakout above resistance.
Pessimistic Scenario
Price fails to hold above MA50 ($184.48) and tests lower dynamic supports near $157.83, a powerful resistance turned support.
If bearish momentum intensifies, the price targets $99.98 for the next support interaction.
Lower ray interactions at $73.07 may attract opportunistic buyers seeking a long-term reversal.
Potential Trades Based on Dynamic Levels
Trade 1: Long at $184.48 (MA50)
Price interaction with the ray and MA50 confirms support. Enter long, targeting $192.57 as the first goal. Breakout leads to $201.17 and potentially $203.61.
Trade 2: Short at $192.57 (First Resistance)
After a failed breakout attempt, initiate a short position targeting $185.68 (MA100). Monitor for support recovery or continuation lower.
Trade 3: Long at $157.83 (Powerful Support)
If price dips to $157.83, strong buying momentum is likely. Enter long, aiming for $184.48, and watch for further upside toward $192.57.
Trade 4: Short at $99.98
Breaking below $157.83 shifts sentiment bearish. Enter short as the price approaches $99.98, with $73.07 as a secondary target.
Key Notes for Execution
Always wait for confirmation at a ray level and ensure price respects the ray before entering a position.
Dynamic interactions with moving averages (MA50, MA100) strengthen trade setups.
Price tends to move from one ray to the next, offering clear staging points for partial profit-taking or re-evaluation.
Traders utilizing this structured approach can achieve clarity, discipline, and an edge by integrating ray dynamics with technical insights. Stay patient, and let the market confirm your strategy before diving in!
What’s Your Next Move? Let’s Talk!
Got questions? Drop them in the comments below! I’d love to hear your thoughts, ideas, or even challenges you're facing with your favorite assets. Don’t forget to hit Boost if you found this post insightful—save it to revisit later and see how the price action unfolds according to my analysis. After all, understanding those key levels is the secret sauce to successful trades!
The rays and levels you see here are mapped automatically using my private indicator-strategy, tailored to predict price movement with precision. Interested in accessing it? Shoot me a private message—I’ll walk you through the process. It’s available exclusively, and trust me, it takes the guesswork out of trading.
Need analysis for a specific asset? Let me know in the comments or DM me. I’m happy to create detailed setups—some I’ll share for free with the community, and others can be customized just for you if privacy is what you prefer. Whether it’s crypto, stocks, or forex, the rays work on every market, capturing the true flow of price action.
Make sure to follow me here on TradingView! That’s where I’ll be sharing more of these insights and strategies. Let’s build a smarter, more profitable trading journey together. 🚀

XRP: Poised at the Edge of Momentum – What's Next?The cryptocurrency market never sleeps, and XRP is the perfect reflection of this restless spirit. Currently trading at $2.8295, XRP finds itself teetering on the brink of a crucial breakout, with just a 2.9% gap from its all-time high of $2.9138, achieved 43 days ago. The question on every trader's mind: is this the moment of ignition, or will the asset take a breather?
Recent patterns highlight a tug-of-war between buyers and sellers. Volume Spread Analysis (VSA) patterns reveal the persistence of increased buy volumes, though intermittent sell-offs indicate a battle for control. From a technical perspective, the Relative Strength Index (RSI) stands at 74.95, signaling that XRP is flirting with overbought territory. Yet, this could either confirm a surge or warn of an impending pullback.
Fundamentally, Ripple’s ongoing legal clarity and the adoption of RLUSD stablecoin are boosting market confidence. Combined with the upward trend supported by key moving averages—MA50 at $2.5597 and MA100 at $2.5201—XRP could be primed for its next big leap.
Your Move: XRP's future is a coin flip between testing its psychological barriers at $3.00 and retracing to stronger support at $2.66. Are you ready to seize the opportunity as XRP prepares to define its next chapter? Stay tuned, as the market reveals its hand.
XRP Tradingmap: Patterns in Motion
Step 1: The Build-Up Begins - Buy Volumes Max (01:00 UTC)
The sequence kicks off with the "Buy Volumes Max" pattern. At this point, the price opened at $2.6765 and closed higher at $2.7918, signaling strong buying momentum. The main_direction was bullish, validated by the immediate follow-up pattern. This set the stage for the next price action.
Step 2: Rally Confirmed - Increased Buy Volumes (02:00 UTC)
True to the bullish call of the previous pattern, the price climbed further, opening at $2.7918 and closing higher at $2.8474. This confirms the integrity of the earlier pattern and keeps the bullish sentiment alive. Trigger points were respected as prices didn’t dip below the lows of the previous three bars ($2.6383). Confidence grows as buyers continue to dominate.
Step 3: Profit-Taking Warning - VSA Manipulation Sell Pattern (03:00 UTC)
Here comes a shift. The market signals caution with a "VSA Manipulation Sell Pattern." Despite opening high at $2.8474, the price closed lower at $2.8304. The main_direction flipped bearish, and this was confirmed as the subsequent pattern saw a slight price drop. Traders who spotted this sell signal had a chance to lock in gains before the retracement deepened.
Step 4: Brief Reprieve - Increased Buy Volumes (17:00 UTC)
Bulls briefly regained control, as prices opened at $2.6146 and closed higher at $2.6553. However, the movement lacked the strength seen in earlier buy patterns. While the main_direction of this pattern was bullish, subsequent price action indicates that this bounce was fleeting—a classic bull trap for unprepared traders.
Step 5: The Market Takes a Turn - VSA Manipulation Sell Pattern (19:00 UTC)
The sell-off resumes with another VSA sell pattern. The price slid lower, respecting the bearish direction outlined earlier. Opening at $2.682 and closing at $2.6626, this pattern further solidified bearish control. Trigger points were cleanly activated as prices failed to regain previous highs, providing traders with an opportunity to ride the downtrend.
Step 6: Strategy Reset - The Bigger Picture Emerges
The sequence highlighted above demonstrates the power of reading patterns within a cohesive framework. Early buy signals paved the way for strong upward momentum, but the subsequent sell patterns hinted at deeper corrections. By following the roadmap, investors could have avoided traps and maximized profits during the transition from bullish to bearish phases.
What’s Next?
XRP’s roadmap reveals its inherent volatility. Each pattern offers insight into market behavior, but success comes from aligning these signals with a broader strategy. Stay tuned for the next move—will bulls or bears take the crown?
Technical & Price Action Analysis: Key Levels to Watch
Support Levels:
$2.6666 – First line of defense. If this level doesn’t hold, it’s likely to flip into resistance, attracting sellers like bees to honey.
$2.5783 – A deeper support level where buyers might regroup. If broken, expect it to act as a ceiling for any bounces.
$2.2748 – Critical zone for bulls to keep control. If this level is lost, momentum shifts decisively in favor of the bears.
$2.1349 – The market’s last-ditch effort to keep things afloat. Failure here could open the floodgates.
$1.9667 – A psychological barrier where value hunters might step in. But remember, if it cracks, it’s a wall on the way up.
Resistance Levels:
While the chart doesn’t scream significant resistance levels, any failed support will naturally transform into tough barriers for a comeback rally.
Powerful Resistance Levels:
$1.1047 – A long-term level where sellers are likely to dig in their heels. Watch for strong rejections here.
$0.5538 – Key zone for the long game. If this level is reached and rejected, the bears could strengthen their grip.
$0.5032 – An area that will attract big players if prices retrace this far. Keep an eye on the price action here.
$0.3646 – The fortress of resistance. If bulls manage to breach this, it’s a signal of a major shift in market sentiment.
Trading Strategies Using Rays: A Path Through the Fibonacci Framework
Concept of Rays
The "Rays from the Beginning of Movement" approach is a unique method that applies Fibonacci-based geometric principles to map the dynamics of price movement. These rays act as predictive tools, marking zones where significant price interactions occur—either signaling a continuation or a reversal. By focusing on interactions with these rays, traders can better gauge probabilities without attempting to pinpoint exact levels in a nonlinear financial system.
How Rays Work
Fibonacci Rays: Constructed at mathematically significant angles starting from the initial movement, not extremum points. This increases accuracy in trending or corrective phases.
Dynamic Levels: These rays adapt to new patterns, automatically updating ranges for potential price movements.
Moving Averages as Dynamic Factors: Key levels align with Moving Averages (MA50, MA100, MA200), providing strong zones of interaction.
Ascending and Descending Rays: These define movement boundaries, marking pathways for price to travel from one ray to another.
Optimistic Scenario
Entry Point: Interaction with a descending ray around $2.6666 (support). If the price bounces above this ray and confirms with a close above MA50 at $2.5597, the movement could head upward.
Target 1: $2.8295 – Interaction with the next ray above creates an opportunity to scale out partial profits.
Target 2: $2.9138 – Absolute high from recent history; a breakout here could extend gains toward higher Fibonacci levels.
Dynamic Factors: If RSI remains above 70 while interacting with ascending rays, the bullish scenario strengthens.
Pessimistic Scenario
Entry Point: Price interaction with an ascending ray near $2.6666, but fails to close above MA50, confirming bearish sentiment.
Target 1: $2.5783 – Initial support zone becomes the first profit target in the downtrend.
Target 2: $2.2748 – Second ray below and the next potential reaction level for a partial exit.
Target 3: $2.1349 – A critical area where price may consolidate or reverse.
Dynamic Factors: Watch for Moving Averages flipping into resistance zones, confirming further downward pressure.
Trade Ideas Using Rays
Long Trade from $2.6666 to $2.8295: Enter long when price interacts with the ray at $2.6666, confirming with a bullish close above MA50. Scale out at $2.8295, targeting the upper ray.
Short Trade from $2.6666 to $2.5783: Enter short if price interacts with $2.6666 but fails to break above MA50. Target $2.5783 for a clean exit at the next ray.
Breakout Trade above $2.9138: Go long if price cleanly breaks $2.9138, with a tight stop below the breakout candle. Use dynamic Fibonacci rays to set extended targets.
Reversal Trade at $2.1349: A bounce off the $2.1349 ray could signal a countertrend move. Enter with confirmation from price closing above MA200, targeting $2.2748.
Trading is all about finding those key levels where the magic happens, and now it's your chance to engage. Have questions about the analysis? Drop them right in the comments—I’m here to discuss, clarify, and brainstorm with you!
Found this idea helpful? Don’t forget to hit Boost and save it for later so you can track how price moves along the rays. Observing these levels in real-time will not only sharpen your skills but also deepen your understanding of how market dynamics work.
Curious about my indicator? The strategy you see here, drawing all the rays and levels automatically, is part of a private setup. If you’re interested in using it, feel free to reach out to me via direct message—I’ll explain how we can make that happen.
Need a custom analysis for your favorite asset? Whether you want it shared publicly or kept private for your eyes only, I’m open to discussing options. Just let me know in the comments or via DM, and I’ll do my best to help.
Remember, these rays work across all assets, and the price often respects them like clockwork. If you want me to mark up specific assets for you, write in the comments and don’t forget to hit Boost. I’ll tackle requests as time permits.
Finally, make sure to follow me here on TradingView for more in-depth ideas and strategies. This is where I share all my updates, and I’d love to have you as part of my trading community.
Let’s trade smarter together! 🚀

Apple Inc. (AAPL) Comprehensive Market Analysis and StrategyGreetings traders and investors! Denis Mikheev here with an in-depth analysis of Apple Inc. (AAPL) using advanced tools from TheWaved™. Buckle up as we dive into the technical, fundamental, and price action analysis to forecast price movements and provide actionable trading strategies.
Current Market Overview
Apple’s current price stands at $235.43, approximately 9.48% below its absolute high of $260.10 reached on December 26, 2024. Despite this pullback, the stock shows strong resilience, supported by robust fundamentals and technical setups.
Support and Resistance Levels
Support Zones:
$228.75
$224.05
$217.13
Resistance Zones:
$237.05
$242.41
$244.67
Key Levels for Monitoring:
Powerful Resistance at $258.55
Critical Support at $217.55
Technical Indicators Analysis
Moving Averages (1-hour interval):
MA50: $238.39
MA100: $241.09
MA200: $247.59
Relative Strength Index (RSI):
1-hour RSI: 49.41 (neutral zone)
Daily RSI: 34.6 (oversold zone suggests potential reversal)
Volume Indicators:
MFI60 (Money Flow Index): 49.28 (neutral, no divergence noted).
Key Patterns and Historical Analysis
From recent pattern sequences:
January 13, 2025: Increased Sell Volumes with a 6.84% movement, indicating short-term bearish pressure.
January 10, 2025: Multiple “Sell Volumes Take Over” patterns with mixed buy and sell signals.
January 8, 2025: VSA Buy Pattern Extra suggests a medium-term bullish rebound pending confirmation.
These patterns align with a potential range-bound movement in the near term before a decisive breakout.
Price Action Analysis
Apple’s price action over the past week has formed a consolidative structure near key support levels. Observations include:
Lower highs and consistent testing of the $228.75 support.
A potential inverted head-and-shoulders pattern forming on the 1-hour chart, with a neckline at $237.05.
Price tightly correlates with the 50-day MA, suggesting a tug-of-war between bulls and bears.
Fundamental Insights
Apple’s upcoming quarterly results are projected to beat consensus estimates, driven by robust iPhone and service segment sales. Furthermore, macroeconomic conditions, such as softening interest rate hikes, could favor tech stocks in the medium term.
Trading Strategy
Short-Term Strategy:
Entry: Buy near $228.75 support level.
Stop Loss: $224.05 to minimize downside risk.
Targets:
$237.05
$242.41
Confirmation: Look for RSI divergence or a bullish engulfing candle.
Medium-Term Strategy:
Monitor breakout above $237.05 for long positions.
Resistance to Watch: $244.67 and $250.34.
Use trailing stops to secure profits.
Long-Term Strategy:
Accumulate near $217.13 if tested, considering its historical significance as a strong support level.
Target: $258.55 with a 6-12 month horizon.
Risk Management
Employ disciplined risk management:
Risk-to-Reward Ratio: Maintain a minimum of 1:2.
Position Sizing: Limit exposure to 2% of your trading capital per trade.
Stop-Loss Placement: Use dynamic stop-loss levels based on ATR (Average True Range).
Market Outlook
1. Short-Term: Expect consolidation between $228.75 and $237.05, with potential for a breakout.
2. Medium-Term: A bullish continuation is likely if $242.41 resistance is cleared.
3. Long-Term: A test of the $258.55 resistance is probable, contingent on broader market sentiment.
Concept of Rays
Explanation of the "Rays from the Beginning of Movement" Concept
Core Idea
My proprietary analysis method is based on using rays constructed on Fibonacci mathematical and geometric principles. These rays create a system of dynamic levels that help predict precise asset movements and identify key zones where price interactions occur. Price interaction with these rays signals probable scenarios: either a reversal or a continuation of movement, but only after interaction and the appearance of dynamic factors and patterns.
Why Predicting Specific Levels is Not Possible
Financial markets are nonlinear systems, where price movement is determined by numerous variables, including market volumes, liquidity, macroeconomic factors, and participant psychology. Instead of attempting to predict specific levels, I propose analyzing probabilities of price reaction at pre-calculated key zones. Price interaction with rays provides additional insights into the direction and strength of movement.
How Rays Work
Fibonacci Rays: Each ray corresponds to a specific angle of inclination, which is mathematically significant and correlates with natural proportions and the start of movement.
Primary Advantage: Rays are constructed from the beginning of a movement pattern, rather than traditional extremum points commonly used in classical technical analysis. This allows for the rapid and accurate accounting of new trend or corrective movement phases.
Adaptability: When a new pattern emerges, rays are automatically adjusted to show the potential movement range. Price may exit this range and enter another, interacting similarly with a different ray.
Rays are Ascending and Descending: They define the boundary of the movement channel.
How to Use Rays
Historical Analysis: On historical charts, observe how price interacted with rays. This helps evaluate how often levels defined by rays led to significant movement changes.
Real-Time Monitoring: By observing current price behavior relative to rays, you can highlight key points where scenarios such as reversal or continuation are likely.
Confirmation Tool: Rays do not replace other analysis methods but enhance them, adding a structured perspective on market behavior.
Conclusion
Apple remains a solid investment with clear technical setups and a favorable long-term outlook. Utilizing TheWaved™ tools, we’ve pinpointed actionable strategies to navigate its price movements effectively. Remember to follow your trading plan and adapt to market conditions.
For any queries or further clarifications, feel free to reach out via direct messages. All our professional-grade indicators are accessible via the link in our profile. Let’s trade smarter, not harder!
Stay disciplined and trade safely,
Denis Mikheev
TheWaved™

Tesla Inc. (NASDAQ: TSLA) Comprehensive AnalysisOverview
Tesla Inc. (NASDAQ: TSLA) has been a focal point of market activity, showcasing significant volatility and creating substantial opportunities for both short-term traders and long-term investors. The current price is $411.58, with the stock trading below its absolute high of $488.54 recorded on December 18, 2024. This represents a deviation of approximately -15.75% from the peak. This technical and fundamental analysis will leverage advanced tools, including VSA patterns, price action analysis, and volume dynamics, to project future movements.
Technical Analysis
Key Support and Resistance Levels
Support Levels: $383.30, $376.04, $358.62.
Resistance Levels: $420.00, $430.50, $448.00.
Moving Averages
MA50: $394.08
MA100: $397.55
MA200: $413.63
The price currently trades above the MA50 but below the MA200, suggesting consolidation within a broader bullish trend. The RSI (14) at 70.76 signals overbought conditions on shorter intervals, necessitating caution for immediate buy entrie.
Volume Spread Analysis (VSA) and Patterns
Recent trading data reveals patterns indicative of institutional activity:
Buy Volumes (Jan 13): Closing at $391.96 with increased buying pressure, marking a 14.61% movement from its three-bar low of $380.07.
VSA Manipulation Patterns: A confirmed "Buy Pattern 3" formed on January 13, showcasing a potential bullish continuation with a high of $396.95.
Predicted Scenarios
Short-Term (1 Week):
Tesla appears poised to test its $420 resistance level based on bullish volume patterns. A break above $420 with significant volume could target $430 as the next level of interest. However, failure to breach $420 may result in a retracement to $400-$405 support.
Medium-Term (1 Month):
Given the observed bullish manipulation patterns and technical support at $383, Tesla may aim for a recovery toward its MA200 at $413. If sustained buying interest persists, the stock might challenge its December highs.
Long-Term (3-6 Months):
Tesla’s trajectory could see it revisiting the $450-$470 range, contingent upon macroeconomic conditions and its quarterly earnings surpassing market expectations. The psychological level of $500 remains a potential long-term target if the broader market maintains bullish momentum.
Stop-Loss and Target Levels
Proposed Trade Setup:
Entry: $412.00
Stop-Loss: $400.00
Target 1: $420.00
Target 2: $435.00
Target 3: $450.00
Fundamental Analysis
Tesla remains a key player in the EV market, with growing adoption of its vehicles worldwide. Its latest production numbers exceeded market expectations, signaling robust demand despite economic headwinds. Recent initiatives in energy storage and AI-based technology further diversify its revenue streams, underpinning its premium valuation.
Conclusion
Tesla's technical and fundamental indicators suggest a cautiously bullish outlook. While short-term retracements are possible, the stock's overall trend aligns with upward momentum, supported by strong institutional interest and robust fundamentals.
For further inquiries or personalized trading setups, feel free to contact me directly. All relevant indicators and tools used for this analysis can be found in the profile header.
Concept of Rays
Explanation of the "Rays from the Beginning of Movement" Concept
Core Idea
My proprietary analysis method is based on using rays constructed on Fibonacci mathematical and geometric principles. These rays create a system of dynamic levels that help predict precise asset movements and identify key zones where price interactions occur. Price interaction with these rays signals probable scenarios: either a reversal or a continuation of movement, but only after interaction and the appearance of dynamic factors and patterns.
Why Predicting Specific Levels is Not Possible
Financial markets are nonlinear systems, where price movement is determined by numerous variables, including market volumes, liquidity, macroeconomic factors, and participant psychology. Instead of attempting to predict specific levels, I propose analyzing probabilities of price reaction at pre-calculated key zones. Price interaction with rays provides additional insights into the direction and strength of movement.
How Rays Work
Fibonacci Rays: Each ray corresponds to a specific angle of inclination, which is mathematically significant and correlates with natural proportions and the start of movement.
Primary Advantage: Rays are constructed from the beginning of a movement pattern, rather than traditional extremum points commonly used in classical technical analysis. This allows for the rapid and accurate accounting of new trend or corrective movement phases.
Adaptability: When a new pattern emerges, rays are automatically adjusted to show the potential movement range. Price may exit this range and enter another, interacting similarly with a different ray.
Rays are Ascending and Descending: They define the boundary of the movement channel.
How to Use Rays
Historical Analysis: On historical charts, observe how price interacted with rays. This helps evaluate how often levels defined by rays led to significant movement changes.
Real-Time Monitoring: By observing current price behavior relative to rays, you can highlight key points where scenarios such as reversal or continuation are likely.
Confirmation Tool: Rays do not replace other analysis methods but enhance them, adding a structured perspective on market behavior.
Scientific Basis
Fibonacci proportions, underlying the construction of rays, are observed in nature, physics, and financial markets, making them a universal tool.
Geometric angles and trends are based on mathematical analysis of historical price behavior.
The principle of minimizing subjectivity in analysis is also applied: rays are constructed strictly algorithmically, excluding human bias.
Why It Matters
My name is Denis Mikheev, and my method does not offer magical solutions or "predictions" of exact price movements. Instead, it identifies key interaction zones where market participants, as well as automated market-maker algorithms, are likely to make decisions. This allows you to act based on probabilities, not guesses.
Example Visualization
On a chart with rays already constructed, you can see:
How price reacts to intersections or proximity to rays.
Where current interaction points may signal potential changes in movement dynamics.
Trade Safe!
Denis MikheevTheWaved™ Team

Long Position Idea for GBP AUDUsing Fibonacci retracement. Risk Reward 1:3 ! Let's see what happens.

EURJPY → Support breakdown. Attempt to change the trendFX:EURJPY seeks to renew lows. The dollar rally is negatively affecting both JPY and EUR. The Eurozone has yet to face Trump's policies, while Japan is already going through a rough patch....
The currency pair is exiting the ascending channel, hinting at a trend change. The price breaks support and consolidates in the selling zone. Ahead is the key support at 161.2, the breakdown of this zone may provoke the bears to more active actions.
Technically and fundamentally, the currency pair is entering the downward rally phase, so the trend change is just the beginning....
Resistance levels: 162.04, 162.5, 163.2
Support levels: 161.16, 158.4
The focus is on the channel boundaries, resistance at 162.04 and support at 161.16. From these zones an aggressive fall may be possible, as buyers do not believe in a positive outcome at the moment
Rate, share your opinion and questions, let's discuss what's going on with ★ FX:EURJPY ;)
Regards R. Linda!
