Gold Short: Wave 5 of C In this video, I explained my change in the Gold Elliott Wave counts on the cycle level (red font numbering) and how I think the Gold price movement will go down in a double combination (because the previous 2 waves are double combinations).
I also go through how I set the short target using Fibonacci extensions.
Fibonacci

ATKR is near to best buying priceATKR is near the best buying price. It has already retraced to Fib 0.786.
A long term investment plan

GOLD → Within range. Retest resistance at 3347FX:XAUUSD continues to correct after a false breakdown of support at 3300. Due to uncertainty, the price may remain in the range of 3300-3340 for some time.
Gold is fluctuating amid a weak dollar and uncertainty over Fed rates. Gold is struggling to hold on after rebounding from weekly lows, despite the US dollar falling to multi-year lows. Pressure on the dollar has intensified due to Trump's criticism of the Fed and rumors of a possible replacement for Powell. However, gold is limited in its growth due to a pause in geopolitical tensions and hawkish signals from the Fed chair. Investors are awaiting key macro data from the US (e 12:30 GMT Durable goods orders, GDP, Initial Jobless Claims) and especially the PCE inflation report on Friday.
Technically, the focus is on key areas of interest: 3300, 3306, 3340, 3347. Until strong news emerges, an intraday trading strategy should be considered.
Resistance levels: 3347, 3357
Support levels: 3320, 3307, 3300
Technically, a false breakout of resistance at 3347 and a retest of the local liquidity zone at 3320-3307 are possible before growth continues for the reasons mentioned above. Targets could be 3347, 3364, 3372, and 3396.
Best regards, R. Linda!

GBPUSD → Pre-breakout consolidation. One step away from a rallyFX:GBPUSD is trading in consolidation. Against the backdrop of the falling dollar index, the currency pair is testing resistance at 1.3632 but is not yet ready to bounce down.
Against the backdrop of the dollar's decline due to fundamental reasons, the GBPUSD currency pair is strengthening. Technically, this could lead to the price breaking out of consolidation upwards. A pre-breakout base is forming relative to the upper boundary of consolidation. The price is compressing towards the level, volatility is decreasing, which in general could lead to a breakout of resistance - trigger 1.3632. The exit from consolidation may be accompanied by distribution. The liquidity zone with W1 can be considered as a target.
Resistance levels: 1.3632, 1.3743
Support levels: 1.3593, 1.3508
The global and local trends are bullish. After growth, consolidation is forming. Against the backdrop of the falling dollar, GBPUSD is testing resistance. The reaction to the false breakout of resistance is weak. The chances of a breakout are quite high.
Best regards, R. Linda!

CADJPY - Looking To Sell Pullbacks In The Short TermM15 - Strong bearish move.
No opposite signs.
Currently it looks like a pullback is happening.
Expecting bearish continuation until the two Fibonacci resistance zones hold.
If you enjoy this idea, don’t forget to LIKE 👍, FOLLOW ✅, SHARE 🙌, and COMMENT ✍! Drop your thoughts and charts below to keep the discussion going. Your support helps keep this content free and reach more people! 🚀
--------------------------------------------------------------------------------------------------------------------

LTCUSD - Bottom in, starting wave 3In green we see the levels to be taken out as a corrective wave, but the structure is very much impulsive, so we aim fot the impulsive fib targets of 1.6 and 2.3.
Let's go!!

Is Gold Ready to Rally, Elliott Wave 5 at Key Trending SupportGold is sitting right at a critical ascending trendline support—this could be the make-or-break level between wave continuation and deeper retracement.
I have identified this as the potential end of sub-wave 2 of the final Wave 5. This makes the current support zone a high-probability long entry—as long as it holds.
📈 Bullish Scenario: Sub-wave 3 Kickoff
If support holds, we likely begin Wave 3 of 5, which is typically the strongest and fastest-moving wave.
Look for:
Breakout above the previous minor high to confirm impulse.
Increasing momentum / bullish RSI divergence.
Volume confirmation, if available.
Target: A move past recent highs, potentially up toward $2,475–$2,500, depending on wave length projections.
📉 Bearish Scenario: Breakdown to Fib Retracements
If the trendline breaks decisively:
Expect a retest of the 0.5 to 0.618 Fibonacci retracement from the previous major swing low to the recent high.
This would align with Wave 2 or a complex correction structure.
Key Support Zones:
0.5 Fib ≈ ~$2,285
0.618 Fib ≈ ~$2,250
Watch for price action behavior and wick rejections in that area—those will give you clues for a potential bullish reversal.
🌐 Fundamental + Intermarket Thoughts
You're thinking very well here with capital rotation logic:
S&P 500 (ES) is likely in a Wave 5: If true, a correction in equities could free up capital and drive risk-off inflows into gold.
Two likely macro triggers:
ES reversal after ATH retest → Hedges start shifting to gold.
Immediate correction in ES → Faster rotation into safe havens like gold.
Watch the DXY and 10Y yields—if they weaken, that could also fuel gold's breakout.
My trading plan:
Long Entry - Price holds support and starts bouncing with strength Below trendline (tight SL ~$2,300) ~$2,475–$2,500
Wait/Short Bias - Trendline breaks cleanly, closes below on 4H/Daily — Look for long setup at $2,285–$2,250 zone

October remains the targetA parabolic move to 200k or higher by October is far from unlikely — we’ve seen it play out before.

NQ Power Range Report with FIB Ext - 6/26/2025 SessionCME_MINI:NQU2025
- PR High: 22488.25
- PR Low: 22450.25
- NZ Spread: 85.0
Key scheduled economic events:
08:30 | Initial Jobless Claims
GDP
Durable Goods Orders
Session Open Stats (As of 12:25 AM 6/26)
- Session Open ATR: 358.17
- Volume: 20K
- Open Int: 252K
- Trend Grade: Neutral
- From BA ATH: -1.7% (Rounded)
Key Levels (Rounded - Think of these as ranges)
- Long: 22667
- Mid: 21525
- Short: 20383
Keep in mind this is not speculation or a prediction. Only a report of the Power Range with Fib extensions for target hunting. Do your DD! You determine your risk tolerance. You are fully capable of making your own decisions.
BA: Back Adjusted
BuZ/BeZ: Bull Zone / Bear Zone
NZ: Neutral Zone

Gold may continue to rebound to 3350-3360If gold can stand above 3330 today, it will stimulate long trading behavior to a certain extent, especially the self-rescue behavior of trapped longs. Gold may continue to rebound and is expected to reach the 3345-3355 area. So there is no need to risk shorting gold near 3330 for the time being; although gold may continue to rebound, it is still under pressure in the 3350-3360-3370 area; and gold is still weak overall, so we can consider shorting gold in the 3350-3360 area and look at the target area of 3325-3315.
The Premium privilege of my account will end on June 26, and it will stop updating here from tomorrow. Friends in the channel have already made a lot of money by following my trading strategy. Friends who have not joined yet can join and receive the latest trading strategies and trading signals as soon as possible to escort your trading!

GOOGL on WatchLooking to buy GOOGL above $171 if it holds.
Why:
Broke through .50 fib resistance and held the retest (orange circle)
Relative strength compares to SPY
EMAs are nearby and may act as support if it breaks through them
Stop loss under .50 fib.
Taking profit just under swing high


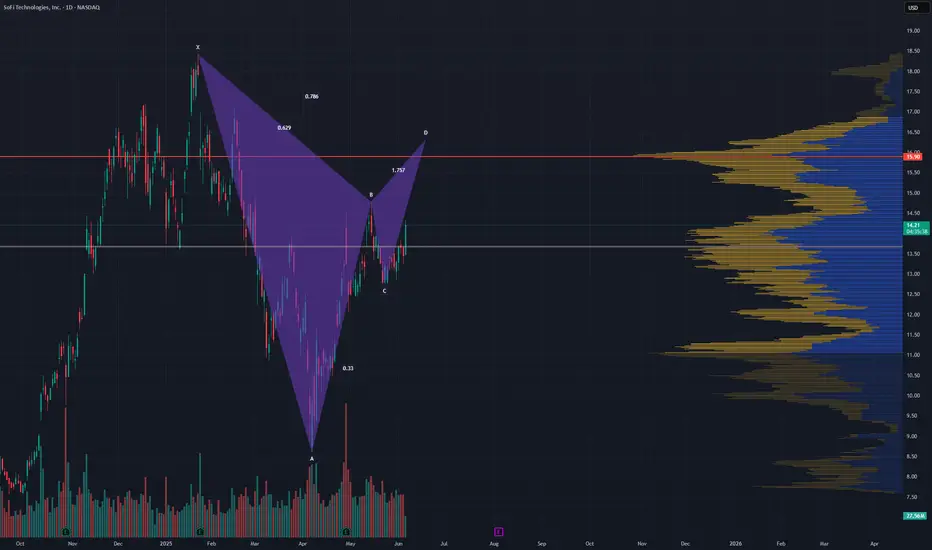
$SOFI looks like its forming a bearish Gartley Noticed this potential #Gartley #Harmonic on #SOFI the other day. I hope my 14c calls do get blessed with its completion.
I expect a retrace to 13.30 then 11.55 of the completion.
AMD Wave Analysis – 25 June 2025
- AMD rose above the resistance level 136.16
- Likely to rise to resistance level 150.00
AMD recently broke the resistance zone between the resistance level 136.16 (former strong support from 2024) and the 61.8% Fibonacci correction of the downward impulse from last October.
The breakout of this resistance zone accelerated the active short-term impulse wave 3, which belongs to the multi-month upward impulse sequence (3) from the start of April.
AMD can be expected to rise to the next resistance level 150.00, former monthly high from November and the target for the completion of the active wave (3).

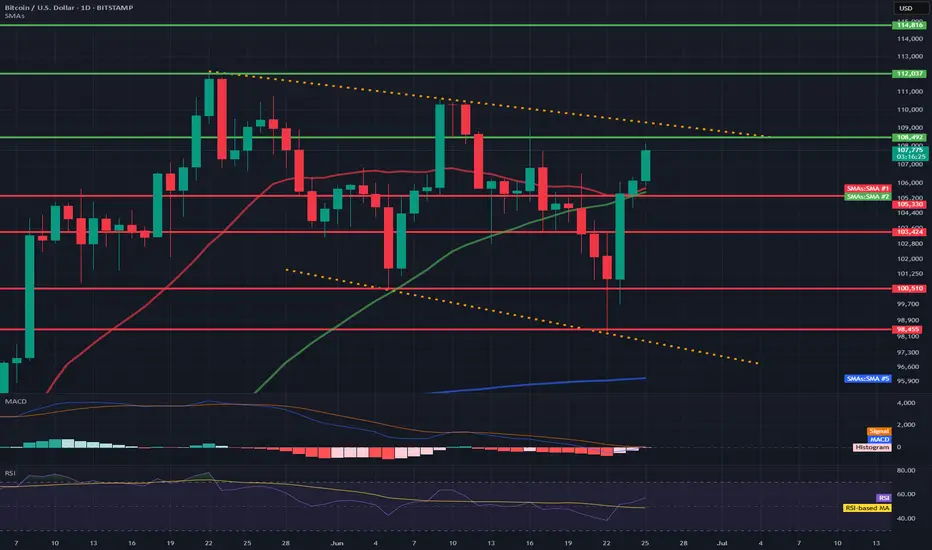
BTC/USD 1D Chart📊 1. Technical formation: Downtrend channel marked with orange lines
Upper trend line (resistance): ~108,200 – 110,000 USD
Lower trend line (support): ~98,455 – 97,000 USD
➡️ Such a formation usually ends with a breakout. The direction of the breakout will be key – currently, the price is testing the upper resistance line.
💵 2. Support and resistance levels
📈 Resistance:
108.202 – currently tested
112.037 – psychological level
114.816 – local top
📉 Support:
105.300 – SMA 50 + local support
103.424 – local lows
100.510 – key psychological support
98.455 – lower edge of the triangle
📉 3. Moving averages (SMA)
SMA 50 (green): currently as dynamic support (~105.300)
SMA 200 (blue): far below the price (~96.000), inactive in the short term
SMA 20 (red): price broke through it upwards – a signal of bullish strength
➡️ A bullish crossover took place between SMA 20 and SMA 50 → bullish signal.
📉 4. MACD (Momentum)
MACD line is approaching the intersection with the signal line from below.
The histogram is becoming less and less red → a potential intersection and a bullish crossover signal may occur any day now.
📉 5. RSI (Relative Strength Index)
Currently: 57.19
RSI is rising and approaching the overbought zone (70), but it is not overheated yet.
Exceeding 60 would be a signal of further bullish strength.
🔍 6. Volume and context
There is no volume marking on the candles, but:
The current bullish candle is strong and breaks through the key averages (SMA 20, 50).
This indicates buyer activity with technical support.
🟢 Bullish scenario (if a breakout occurs up)
A breakout above 108.200 with a close of the daily candle could open the way to:
112.037 (next resistance)
then even 114.816
🔴 Bearish scenario (false breakout)
A rejection from 108.200 and a drop below 105.300 → a possible return to:
103.424 or even 98.455 (lower triangle line)
USD/CAD Battlelines Drawn at Former SupportUSD/CAD briefly registered in intraday low at 1.3540 last week before mounting a massive outside-weekly reversal off the yearly lows. The subsequent rally extended more than 1.9% off the low with the advance exhausting into resistance this week at 1.3795-1.3836- a region defined by the 61.8% retracement of the late-2023 advance, the April low-close, and the 23.6% retracement of the yearly range. Looking for inflection off this mark to offer guidance with the immediate recovery vulnerable while below.
Initial weekly support rests with the 61.8% retracement of the June range at 1.3639 with key support steady at the 1.618% extension of the February decline / 78.6% retracement at 1.3504/23- look for a larger reaction there If reached with a close below needed to mark resumption of the yearly downtrend. Subsequent support objectives rest with the 2024 low-week clow (LWC) at 1.3360 and the 2023 LWC at 1.3218.
A topside breach / close above the 2022 trendline (red) is needed to suggest a more significant low is in place / a larger recovery is underway with the next major technical consideration eyed at 1.3963-1.4018- a region defined by the 52-week moving average, the 2022 swing high and the 38.2% retracement. A weekly close above this key pivot zone is ultimately needed to invalidate the yearly downtrend in USD/CAD.
Bottom line: A rebound off the yearly channel is now approaching initial resistance at former support- looking for possible price inflection off the 1.3795-1.3835 zone into the monthly cross. From a trading standpoint, rallies would need to be limited to the 2022 trendline IF price is heading lower on this stretch / to validate a break of the multi-year uptrend with a close below 1.3504 still needed to mark resumption.
-MB

Technical Analysis of CRCL (4H Timeframe): A Test of Key SupThis 4-hour chart for CRCL illustrates a classic "impulse and correction" pattern within a powerful uptrend. After a parabolic surge to a peak near $300, the asset is now in a healthy pullback, seeking to establish a new level of support before its next potential move. The key question for traders is whether this correction is a pause or a reversal, and the chart provides critical levels to watch.
The Bullish Thesis:
A Confluence of Support
The primary area of interest is the $160 to $170 zone. This is not just a random level; it represents a powerful confluence of four distinct technical indicators, making it the most critical support zone to watch:
1. Previous Breakout Level: This zone was a clear area of prior resistance. Following the principle of "resistance becomes support," the price is now retesting this level from above, which is a classic bullish confirmation pattern.
2. Fibonacci Golden Pocket: The retracement from the recent high finds the 0.618 Fibonacci level—often called the "golden pocket" and a prime target for buying in an uptrend—located at approximately $153. The 160−170 zone sits just above this, making it the logical area for buyers to step in.
3. Ascending Trend Channel: The price action is contained within a well-defined ascending channel. The lower boundary of this channel, which has provided support throughout the uptrend, is currently intersecting with this key price zone.
4. Anchored VWAP: The light blue line, an Anchored Volume Weighted Average Price (AVWAP) starting from the beginning of the rally, is also trending directly into this support zone. Price holding above the AVWAP signifies that the average buyer from the start of the move is still in profit, which is a strong sign of underlying trend health.
The "Last Stand" Support
Should the primary support fail, the chart highlights a secondary, more significant demand zone at $110 to $120. This is identified as the Point of Control (POC) from the volume profile on the left. The POC represents the price level where the most trading volume has occurred, signifying it as an area of "fair value" and a magnet for price. A drop to this level would represent a much deeper correction but would likely be met with significant buying pressure.
Conclusion and Key Scenarios
Bullish Scenario : The most immediate bullish outcome is for the price to find a bottom within the 160−170 support zone. A strong bounce from this area, confirmed by bullish candlestick patterns and increasing volume, would signal the end of the correction and a likely continuation of the primary uptrend, with the previous high near $300 as the next logical target.
Bearish Scenario : A decisive break and close below the $160 level on the 4-hour chart would be a significant warning sign. This would invalidate the immediate bullish structure and open the door for a deeper retrace towards the Point of Control at 110−120.
In summary, CRCL is at a critical juncture. The chart is constructively poised for a continuation of its uptrend, but traders should watch the 160−170 confluence zone as the definitive line in the sand.
Disclaimer:
The information provided in this chart is for educational and informational purposes only and should not be considered as investment advice. Trading and investing involve substantial risk and are not suitable for every investor. You should carefully consider your financial situation and consult with a financial advisor before making any investment decisions. The creator of this chart does not guarantee any specific outcome or profit and is not responsible for any losses incurred as a result of using this information. Past performance is not indicative of future results. Use this information at your own risk. This chart has been created for my own improvement in Trading and Investment Analysis. Please do your own analysis before any investments.

DOGEUSDT: Time For Bulls To Rule! The Dogecoin is currently trading at a key buying level, making it a potential opportunity to buy. However, we need confirmation before making a purchase or entering a trade. This trade could take time to develop as we are currently in the accumulating phase. To be certain of the price direction, we need to enter the distribution phase. While a single swing trade could be a target, you can set your own risk management parameters.
Good luck and trade safely!
Team Setupsfx_

AMC | Long-Term Setup BrewingAMC has been a battlefield stock for retail traders, and while the meme frenzy has calmed, the chart shows signs of a long-term consolidation that may lead to a breakout.
We’re not chasing hype we’re playing levels. The current zone offers asymmetric risk/reward for patient swing or position traders looking for a reversion move back toward key psychological and technical levels.
🔍 Entry Zones:
✅ Market Price: ~$2.99 (initial momentum position)
🧲 Pullback #1: $2.75 (former pivot + fib level)
🧨 Pullback #2: $2.50 (key support floor and high-risk/reward entry)
🎯 Profit Targets (Swing/Position):
🎯 TP1: $3.30 – reclaim of early resistance
🎯 TP2: $4.00 – volume spike zone
🎯 TP3: $5.00+ – potential sentiment surge / short squeeze zone
📢 Disclaimer: This is not financial advice. Always manage your own risk and do your own due diligence.

Start going long on goldAlthough gold is under pressure and weak at present, gold still rebounded near 3295 under the influence of yesterday's major negative news, proving that there is still a large amount of buying funds below, limiting the retracement space of gold; and from 3295 to 3335, there is still a rebound space of $40, proving that gold is not extremely weak. Moreover, there is a gap left above, and there is a technical need to rebound to fill the gap;
In addition, yesterday gold fell sharply due to news, and there should be many longs trapped in the market. If gold is relatively stable, there may be self-rescue behavior of the trapped longs, so gold longs still have the opportunity to rebound to 3340-3350. At present, the main focus is on the short-term support area of 3315-3305, and we can moderately consider going long on gold in this area.

COINBASE (COIN) – Smart Money Accumulation Confirmed | Eyes on $The structure has shifted decisively.
🔹 Smart Money Concepts in Action
Price has reclaimed equilibrium, flipped BOS zones, and left behind a weak high in premium territory. Current PA suggests institutional accumulation with a clear intent to drive price towards inefficiency above $400, targeting the historical supply near $470.76.
🔹 Key Zones
Equilibrium: ~$240
Discount Zone (Demand): $154.13 - $200
Premium Zone (Supply): >$348
Volume Surge confirms conviction behind the breakout.
📌 Expect a reaction near $380–400, but if momentum holds, the liquidity vacuum toward $470 may get filled faster than most expect. Watch for continuation signals and manage risk accordingly.
💡 This is not financial advice – just tracking footprints of capital.
#COIN #Coinbase #SmartMoneyConcepts #SMP #VolumeProfile #VWAP #LiquidityGrab #TradingView #SMC #Equilibrium #BreakOfStructure #CryptoStocks #WaverVanir

Aptos APT price analysis💰 We will soon find out whether the price of #APT has finally begun to recover, or whether this is just a rebound before a further decline.
📈 For growth to continue, it is important that buyers manage to keep the price of OKX:APTUSDT above $4
◆ Next, the price will exit the falling channel and move towards the strong mirror level of $8
◆ And only after the #APTOS price consolidates above this level will it be possible to talk about an ambitious uptrend.
🐻 Well, the negative scenario is a lackluster fall from $4 to $3, or maybe even lower...
_____________________
Did you like our analysis? Leave a comment, like, and follow to get more
