ETH Retracement 50% FibHi there, I think there will be a retrace at ETH to 50% fib. My new buy zone will be 2300 and I am short at the moment to 2300. Hope this helps you out. Do your research and this is no financial advice, just an idea. Oh and by the way, I got my SL just above the current high (~2490).
Let me know what your thoughts are in the comment below!
Fibonacci

Patanjali Foods: A Potential Reversal Brewing Near Demand Zone?The price has now retraced back into a key value zone between 1,610 - 1,635, which has previously acted as a strong base. This zone also coincides with high volume activity on the visible range volume profile - suggesting accumulation interest.
Technically, the stock is near the 0% Fibonacci extension with multiple confluences of past support and volume, forming a potential base.
If this holds, look for retracement targets:
• First bounce zone: ₹1,687 (50% Fib)
• Further recovery: ₹1,745–₹1,775 (Fib 61.8–78.6%)
Long-term: ₹1,861 (161.8% Fib extension), ₹2,016 (261.8%)
Fundamentals Snapshot:
• Market Cap: ~₹58,000 Cr
• P/E: ~34x | P/B: ~3.8x
• Promoter Holding: 80.82% (No pledging)
• Debt-to-Equity: ~0.25
• ROCE: ~13.2% | ROE: ~10.4%
• FII Holding: 3.6%, DII Holding: 6.3%
Patanjali’s brand strength in edible oils, packaged foods, and growing FMCG integration offers secular demand visibility. The recent correction seems sentiment-driven, not structural.
Keep in Focus:
A decisive close above 1,660 could indicate a short-term reversal.
This chart is for educational use only and not a buy/sell recommendation.

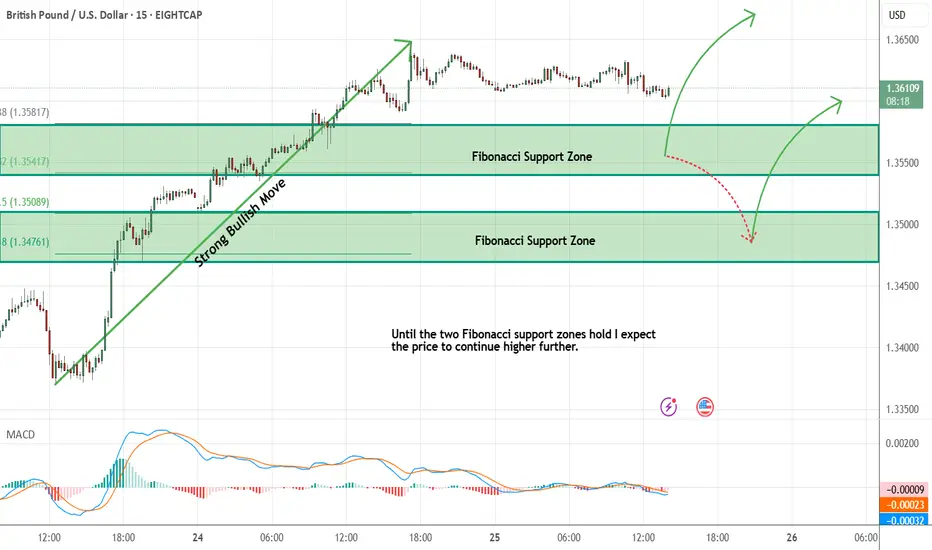
GBPUSD - Expecting Bullish Continuation In The Short TermM15 - Strong bullish momentum followed by a pullback.
No opposite signs.
Until the two Fibonacci support zones hold I expect the price to move higher further.
If you enjoy this idea, don’t forget to LIKE 👍, FOLLOW ✅, SHARE 🙌, and COMMENT ✍! Drop your thoughts and charts below to keep the discussion going. Your support helps keep this content free and reach more people! 🚀
--------------------------------------------------------------------------------------------------------------------
SOLUSDT | T.A.P.E. Method Breakdown: Has Solana Bottomed Or Not?Let’s walk through the T.A.P.E. Method I use to read every chart. This isn’t about price alone — it’s about structure, behavior, pressure, and clarity. Solana is at a critical decision point. I’ll explain what smart money is likely seeing, and how I’m approaching this chart with logic — not guesses.
T — Territory (Know the Zone Before You Clone)
I started with the Fibonacci retracement from the all-time low to all-time high. It’s clear SOL is reacting near the golden pocket zone — a historically strong area for reversals.
We also saw strong support at the 2618 extension after the first major leg down. This alone gave an 87% rally. That’s how clean setups work — clarity beats complexity.
Market structure remains bullish on higher timeframes. Yes, we’ve had a wick below prior lows, but no clean break — structure still holds for now.
A — Activity (Price Behavior Over Indicators)
I don’t use RSI or crossovers. I look at behavior.
From the local low to the swing high, the retracement again held the 618 zone, showing buyer defense.
However, on a second leg down, SOL broke below the 2618 level — a key difference. This shift in behavior is what I’m watching closely. Price pushed past 236 on the retrace — that can hint at a stronger bullish leg forming.
But...
P — Pressure (Pain Points and Traps)
Here’s where most traders get caught.
Early longs that entered during the last local rally are underwater. Especially those who bought around the value area high — they are likely hoping to exit break-even, adding sell pressure.
This is classic: a liquidity zone stacked with pain.
That pressure zone sits just above the current range, near $153–$164. If we get a strong move into that zone without structure, I’ll be watching for short setups — not breakouts.
E — Execution (No Setup Is Complete Without a Plan)
Here’s how I’m structuring it:
No-trade zone: Where we are now. No edge here.
Short area 1: $153 — trendline + resistance
Short area 2: $164 — invalidation just above
Target: Sweep lows + retest $138/$128
Invalidation: Clean breakout above $164 with structure
Support zones to watch:
$138 (value area low)
$128 (786 Fib)
$122 (old structure pivot)
If price forms structure and pushes through the golden pocket cleanly, then I shift bias. But for now — pressure remains to the downside.
Summary & Context:
This T.A.P.E. breakdown keeps me from chasing noise and protects capital. Too many early longs, weak structure, and clean resistance zones make this a potential short setup — not a long.
If price flips those resistance zones into support with structure, I’ll adapt. Until then: Plan the move. Let the market prove.
Disclaimer:
This is not financial advice. All opinions are my own, based on chart behavior and analysis. Do your own research. This is a paper money breakdown shared for educational purposes only.

STAR Health: Building Strength Quietly?STAR Health has shown a clear Wave (2) bottom and now appears to be in early stages of Wave (3). Price recently bounced from the 50–61.8% Fibonacci zone, retesting volume-supported levels around ₹425–₹430.
If this impulse unfolds cleanly, bullish targets lie ahead:
• Short-term: 506
• Extension: 562 (1.618 Fib)
Volume support + structure suggests institutional interest is active.
Fundamentals:
• Market Cap: ~₹25,000 Cr
• ROE: ~20%, Solvency Ratio: ~2.1x
• P/E: ~45x | P/B: ~9.2x (Premium valuation due to sector position)
• Promoter Holding: 58.28% (No pledging)
• Strong DII & FII interest, rising institutional exposure
STAR is India’s leading standalone health insurer with over 8 lakh agents, expanding presence, and structural demand tailwinds post-COVID. Long-term fundamentals support technical recovery.
Keep on radar: Break and close above 440–₹445 can ignite further momentum.
NOTE: This post is for educational purposes only not a buy/sell recommendation.

USD/CHF – Rejection at Key Fib Confluence, Bearish Continuation We’re seeing a beautiful textbook rejection off the 0.79Fib zone (0.8200), precisely where price tapped into a previous structure break and minor supply block. Price surged into the red zone, wicked just above the 200 EMA, and was instantly met with heavy sell-side pressure — a strong signal of institutional distribution.
📌 Technical Confluences at Play:
Price failed to break the 200 EMA cleanly — acting as dynamic resistance.
0.79 Fib levels aligning with prior supply.
Rising wedge structure broken to the downside.
Entry candle printing a solid engulfing rejection — institutional footprint.
📉 Target Zone:
Primary TP sits at the 0.236 Fib level (0.8101), but the full measured move of this wedge gives us a final downside target near 0.8038, with intermediate stops at key Fibs. Invalidation above 0.82294
🧠 Trader’s Insight:
“Patience is power. You don’t chase moves, you position for moments.”
Let the market come to your zone of interest, validate your thesis, and then strike with precision. The best trades come from areas where multiple confirmations stack in your favor.
📉 Trade Plan:
Entry: 0.81933 rejection zone
TP1: 0.8130
TP2: 0.8101
Final TP: 0.8038
SL: Above 0.82294 (tight invalidation)
@WrightWayInvestments
@WrightWayInvestments
@WrightWayInvestments

XAUUSD 1H Analysis – Golden Point in SightPrice is currently making its way toward the Golden Point zone at 3365.120, aligning with the 0.786 Fibonacci retracement from the recent bearish leg. This area also coincides with a descending trendline, adding confluence for a potential reversal setup.
📍 Key Levels:
🔹 Resistance: 3365.120 (Golden Point / 0.786 Fib)
🔹 Support: 3302.571 (Target zone)
🔹 Swing High: 3393.776
🔹 Swing Low: 3295.200
🎯 Trade Idea:
Watching for a potential rejection from the 3365 zone to catch a short down to the 3302.571 area. Bearish confirmation required around the Golden Point before entry.
📌 This setup follows the HurricaneFx Signature Strategy.

SOLUSDTCryptocurrency Futures Market Disclaimer
Trading cryptocurrency futures involves high risks and is not suitable for all investors. Cryptocurrency prices are highly volatile, which can lead to significant gains or losses in a short period. Before engaging in crypto futures trading, consider your risk tolerance, experience, and financial situation.
Risk of Loss: You may lose more than your initial capital due to the leveraged nature of futures. You are fully responsible for any losses incurred.
Market Volatility: Crypto prices can fluctuate significantly due to factors such as market sentiment, regulations, or unforeseen events.
Leverage Risk: The use of leverage can amplify profits but also increases the risk of total loss.
Regulatory Uncertainty: Regulations related to cryptocurrencies vary by jurisdiction and may change, affecting the value or legality of trading.
Technical Risks: Platform disruptions, hacking, or technical issues may result in losses.
This information is not financial, investment, or trading advice. Consult a professional financial advisor before making decisions. We are not liable for any losses or damages arising from cryptocurrency futures trading.
Note: Ensure compliance with local regulations regarding cryptocurrency trading in your region.

LONG - USD/JPYCurrently in the 4H timeframe I can see that the price itself has given me a shift of momentum and this indicates that there could a chance for a possible bullish movement.
Now I have marked my zones base on fibonacci levels and gotten my zones to participate in the market.
Base on the market structure we can see that the price has now shifted its direction coming from a bearish momentum and now is pushing into a bullish momentum. This is where we can try to look for an opportunity to buy within those zones.
Why I am looking for a buy is because the price has already touched our support zone and respected the zone itself. Combining it together with Market Structure there seems to be a much more clearer view of how the market is moving.
Entry Point - 144.341
Stop Loss - 142.387
Take Profit - 148.585

Looking for an immediate rebalance on USDJPY daily chartLooking for an immediate rebalance on USDJPY daily chart

NQ Power Range Report with FIB Ext - 6/25/2025 SessionCME_MINI:NQU2025
- PR High: 22412.00
- PR Low: 22384.50
- NZ Spread: 61.5
Key scheduled economic events:
10:00 | Fed Chair Powell Testifies
- New Home Sales
10:30 | Crude Oil Inventories
Session Open Stats (As of 12:35 AM 6/25)
- Session Open ATR: 372.52
- Volume: 18K
- Open Int: 253K
- Trend Grade: Neutral
- From BA ATH: -1.9% (Rounded)
Key Levels (Rounded - Think of these as ranges)
- Long: 22667
- Mid: 21525
- Short: 20383
Keep in mind this is not speculation or a prediction. Only a report of the Power Range with Fib extensions for target hunting. Do your DD! You determine your risk tolerance. You are fully capable of making your own decisions.
BA: Back Adjusted
BuZ/BeZ: Bull Zone / Bear Zone
NZ: Neutral Zone

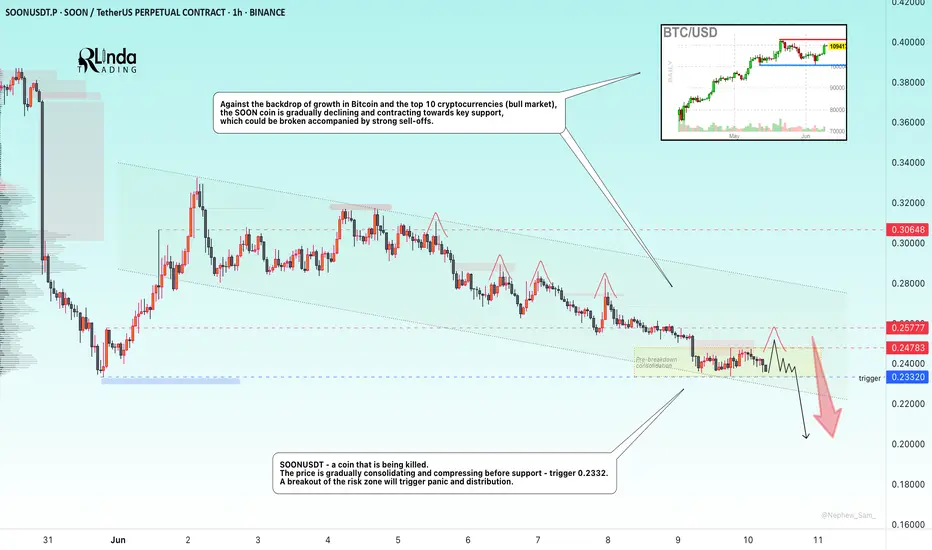
SOONUSDT → The coin that gets killed...BINANCE:SOONUSDT.P is under pressure. The coin looks extremely weak against the backdrop of a bullish market, with key support ahead, separating traders from the panic zone and a sharp decline
This coin is being killed. The price is gradually consolidating and compressing before support - the trigger is 0.2332. Against the backdrop of the overall decline that the market has experienced after a slight impulse from 0.2332, shocks are forming with the aim of capturing liquidity (red check marks). This generally indicates that large players are gathering a bearish position. A breakout of the risk zone will trigger panic and distribution.
Against the backdrop of growth in Bitcoin and the top 10 cryptocurrencies (bull market), the SOON coin is gradually declining and contracting towards key support, which could be broken accompanied by strong sell-offs.
Resistance levels: 0.2478, 0.25777
Support levels: 0.2332
If the coin continues to contract towards the 0.2332 support and form a pre-breakdown consolidation, there will be little chance of survival. In the short and medium term, I expect prices to fall.
Best regards, R. Linda!
GBPAUD → Countertrend liquidity captureFX:GBPAUD is forming a countertrend correction within a global uptrend and testing the support level with W1-D1, forming a false breakdown...
Against the backdrop of the dollar's correction, GBP/XXX pairs are strengthening. On the weekly timeframe, GBPAUD is forming a retest of support at 1.067 (false breakdown) within an upward bullish trend.
Unable to continue falling, the price returns above 1.0673 and consolidates in the buying zone. A breakdown of the structure will confirm the bullish sentiment.
Support levels: 2.0673
Resistance levels: 2.0785, 2.0852
If the bulls manage to hold their ground above the 2.067 support level within the current structure, the currency pair will have a good chance of returning to the bullish trend.
Best regards, R. Linda!

EURAUD → Breakout and consolidation above key supportOANDA:EURAUD is trying to consolidate above the key support zone of 1.76 - 1.77. Within the uptrend, bulls have a fairly good chance.
The market continues to break of structure, confirming the bullish sentiment on the chart. A correction is forming from 1.7882. Before rising, the price may test support. The currency pair is supported by its own bullish trend and the falling dollar (especially against the backdrop of economic problems with the USD (DXY)).
Technically, the currency pair looks quite positive. After the formation of another ‘bos’, we are seeing a correction to the Fibonacci zone of 0.7 and support at 1.7696. If, during the retest, the bulls manage to hold their ground above the key support level, growth may continue in the medium term.
Support levels: 1.7696, 1.7629, 1.7463
Resistance levels: 1.7882, 1.7988
Locally, a reversal pattern is forming relative to the specified zone (as part of a correction). We need to wait for confirmation (price consolidation above the level). The potential within the bullish trend is quite large, and in the medium and long term, the price may test 1.85.
Best regards, R. Linda!

GOLD → Declining interest. Retest of supportFX:XAUUSD experienced significant volatility toward the end of the US trading session. This was due to developments in the Middle East. The de-escalation of the situation is leading to a decline in interest in the metal.
The announced ceasefire between Iran and Israel has reduced demand for gold as a safe-haven asset, while falling oil prices have reduced its appeal as a hedge against inflation. Gold is supported by expectations of a Fed rate cut in July. The focus is on Fed Chair Powell's testimony before Congress and further developments in the Middle East.
Technically, the price confirms the local bearish structure. A continued assault on the 3340 support level could trigger a further decline.
Support levels: 3343-3340, 3320
Resistance levels: 3360, 3366
Focus on the trading range (consolidation) 3340 - 3400. De-escalation of the conflict in the Middle East may lead to a decline in interest in gold as a hedge asset, which may cause the price to break down of consolidation. If the retest of 3340 continues, the price will begin to contract before the level, in which case the chances of a breakdown and decline will only increase. The target will be the liquidity zone of 3320 - 3306
Best regards, R. Linda!

The rebound is an opportunity to short goldAfter the ceasefire agreement between Iran and Israel and Powell's hawkish remarks that strongly refuted the possibility of a rate cut, gold fell sharply and hit a low near 3295. Although gold has rebounded, it is particularly difficult during the rebound process, which shows that the bulls are not willing to attack, and the rebound is only a technical repair of the decline.
Since gold fell below 3300 yesterday, the current bull structure has been changed in stages and the confidence of the bulls has been greatly weakened. As gold falls, it will be under pressure in the 3345-3355 area in the short term. Before gold breaks through this area, any rebound may give us an opportunity to short gold; in addition, after gold falls below 3300 once, in order to move downward and test support, gold has the need to retreat again.
So in the next short-term trading, we can try to use the 3345-3355 area as resistance, short gold appropriately, and look to the 3315-3305 area.

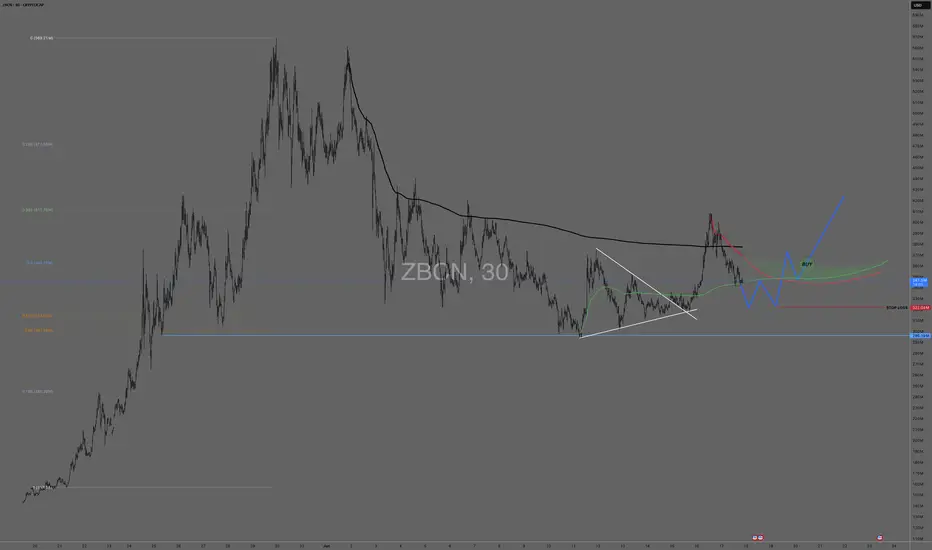
ZBCN: Looking for support to hold and AVWAP's regained
CRYPTOCAP:ZBCN
D/30m chart
We have had out first real pullback on the daily. It's holding the midline, held the GP. I played the break of the triangle on Sunday and took it to the ATH AVWAP (black). I'm wanting the same squeeze that threw that triangle north to hold as support now as buyers defend their positions.
I want to see a shake out below that green AVWAP, I want it to hold and proceed higher. then and only then do we stalk our entry.
I want a break and a pullback test of that red/green AVWAP. If I see that, its a buy on the other side of the "V".
CURI on WatchLooking to buy a pullback around $5.50
Why:
.382 fib level may act as resistance.
20EM lining up with fib level
MACD turning bearish on hourly, but is turning bullish on daily

SRAD Breakout SetupLets see if this can push out of this range or not
SL 22.8
TP1 25.9
TP2 26.74
TP3 28

CL1! Structural NarrativeResearch Idea
If look we beyond surface appearances, we would ask what kind of iterative, generative, or probabilistic mechanisms could have created those movements. Complexity can arise from simplicity, and that what looks messy may follow deep mathematical logic.
We can see the curve that connects series rejections that exposes where selling pressure extends compression until broken.
Another pattern would be current price expressed as a fibonacci ratio of a broader cycle as it splits them into phases.

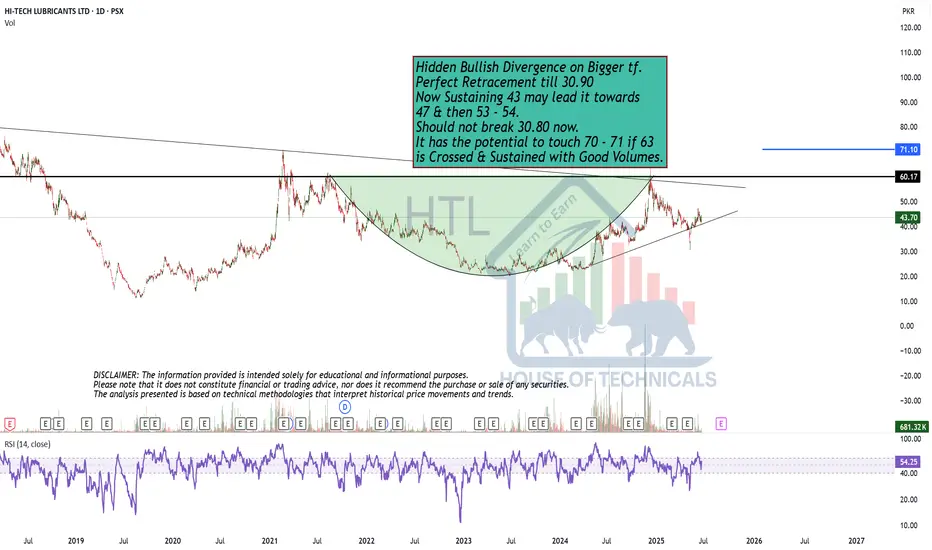
Perfect Retracement till 30.90Hidden Bullish Divergence on Bigger tf.
Perfect Retracement till 30.90
Now Sustaining 43 may lead it towards
47 & then 53 - 54.
Should not break 30.80 now.
It has the potential to touch 70 - 71 if 63
is Crossed & Sustained with Good Volumes.
CADJPY Wave Analysis – 24 June 2025- CADJPY reversed from the resistance area
- Likely to fall to support level 104.75
CADJPY currency pair recently reversed down from the resistance area between the resistance level 106.85, the upper daily Bollinger Band and the 50% Fibonacci correction of the extended downward impulse from November.
The downward reversal from this resistance area created the daily Japanese candlesticks reversal pattern Shooting Star, which stopped the previous minor impulse wave 3.
Given the strength of the resistance level 106.85, CADJPY currency pair can be expected to fall to the next support level 104.75 (which reversed the pair earlier this month).

SPX short analysisLike I wrote in my EUR/USD analysis you never know what could happened.
USA bombed Iran!
This could have huge impact on the US market next week.
My guess is temporarily short... At least to close this gap in spot price of SPX.
Since we're still in bearish market, until we see new highs, and this could be catalyst for another sell off. So the jump could be even bigger and we could see new ATH this year.
For now, I'm seeking a position to short tomorrow after market is open.
This is my entry mark.
There will be higher volatility. However, I expect US market to open in the red, close the gap and to sell off again.
We shall see!
Trade safe this one :)
