Doge Coin Stock Chart Fibonacci Analysis 062325Trading Idea
1) Find a FIBO slingshot
2) Check FIBO 61.80% level
3) Entry Point > 0.15/61.80%
Chart time frame:C
A) 15 min(1W-3M)
B) 1 hr(3M-6M)
C) 4 hr(6M-1year)
D) 1 day(1-3years)
Stock progress:A
A) Keep rising over 61.80% resistance
B) 61.80% resistance
C) 61.80% support
D) Hit the bottom
E) Hit the top
Stocks rise as they rise from support and fall from resistance. Our goal is to find a low support point and enter. It can be referred to as buying at the pullback point. The pullback point can be found with a Fibonacci extension of 61.80%. This is a step to find entry level. 1) Find a triangle (Fibonacci Speed Fan Line) that connects the high (resistance) and low (support) points of the stock in progress, where it is continuously expressed as a Slingshot, 2) and create a Fibonacci extension level for the first rising wave from the start point of slingshot pattern.
When the current price goes over 61.80% level , that can be a good entry point, especially if the SMA 100 and 200 curves are gathered together at 61.80%, it is a very good entry point.
As a great help, tradingview provides these Fibonacci speed fan lines and extension levels with ease. So if you use the Fibonacci fan line, the extension level, and the SMA 100/200 curve well, you can find an entry point for the stock market. At least you have to enter at this low point to avoid trading failure, and if you are skilled at entering this low point, with fibonacci6180 technique, your reading skill to chart will be greatly improved.
If you want to do day trading, please set the time frame to 5 minutes or 15 minutes, and you will see many of the low point of rising stocks.
If want to prefer long term range trading, you can set the time frame to 1 hr or 1 day.
Fibonacci

Ripple Stock Chart Fibonacci Analysis 062325Trading Idea
1) Find a FIBO slingshot
2) Check FIBO 61.80% level
3) Entry Point > 1.96/61.80%
Chart time frame:B
A) 15 min(1W-3M)
B) 1 hr(3M-6M)
C) 4 hr(6M-1year)
D) 1 day(1-3years)
Stock progress:A
A) Keep rising over 61.80% resistance
B) 61.80% resistance
C) 61.80% support
D) Hit the bottom
E) Hit the top
Stocks rise as they rise from support and fall from resistance. Our goal is to find a low support point and enter. It can be referred to as buying at the pullback point. The pullback point can be found with a Fibonacci extension of 61.80%. This is a step to find entry level. 1) Find a triangle (Fibonacci Speed Fan Line) that connects the high (resistance) and low (support) points of the stock in progress, where it is continuously expressed as a Slingshot, 2) and create a Fibonacci extension level for the first rising wave from the start point of slingshot pattern.
When the current price goes over 61.80% level , that can be a good entry point, especially if the SMA 100 and 200 curves are gathered together at 61.80%, it is a very good entry point.
As a great help, tradingview provides these Fibonacci speed fan lines and extension levels with ease. So if you use the Fibonacci fan line, the extension level, and the SMA 100/200 curve well, you can find an entry point for the stock market. At least you have to enter at this low point to avoid trading failure, and if you are skilled at entering this low point, with fibonacci6180 technique, your reading skill to chart will be greatly improved.
If you want to do day trading, please set the time frame to 5 minutes or 15 minutes, and you will see many of the low point of rising stocks.
If want to prefer long term range trading, you can set the time frame to 1 hr or 1 day.

$SOL Local Bottom FormingCRYPTOCAP:SOL closed the day back within the POI.
RSI oversold.
Should see a retest ~$136 to confirm the local bottom.

S&P 500 Wave Analysis – 23 June 2025- S&P 500 reversed from support area
- Likely to rise to resistance level 6065.00
S&P 500 index recently reversed from the support area between the support level 5930.00 (which reversed the price multiple times from the start of June) and the 50% Fibonacci correction of the sharp upward impulse 1 from last month.
The upward reversal from this support area stopped the previous minor ABC correction 2 from the start of June.
S&P 500 index can be expected to rise to the next resistance level 6065.00 (which stopped the previous minor impulse wave 1).

WTI Wave Analysis – 23 June 2025
WTI: ⬇️ Sell
- WTI reversed from the resistance area
- Likely to fall to support level 65.00
WTI crude oil recently reversed down from the resistance area located between the pivotal resistance level 76.45 (which has been reversing the price from the middle of last year), the upper weekly Bollinger Band and the resistance trendline of the weekly down channel from 2024.
The downward reversal from this resistance zone stopped the C-wave of the earlier weekly ABC correction (4) from April.
Given the clear weekly downtrend, WTI crude oil can be expected to fall to the next support level 65.00 (a former yearly low from 2024).

Altseason 2025 – Wave 3 in playIn this Elliott Wave setup, Wave 2 appears to be bottoming out now. As Bitcoin dominance shows signs of declining, capital rotation into altcoins could ignite the powerful Wave 3. Historically, Wave 3 is the most explosive phase, often driving sharp, sustained gains across the altcoin market.

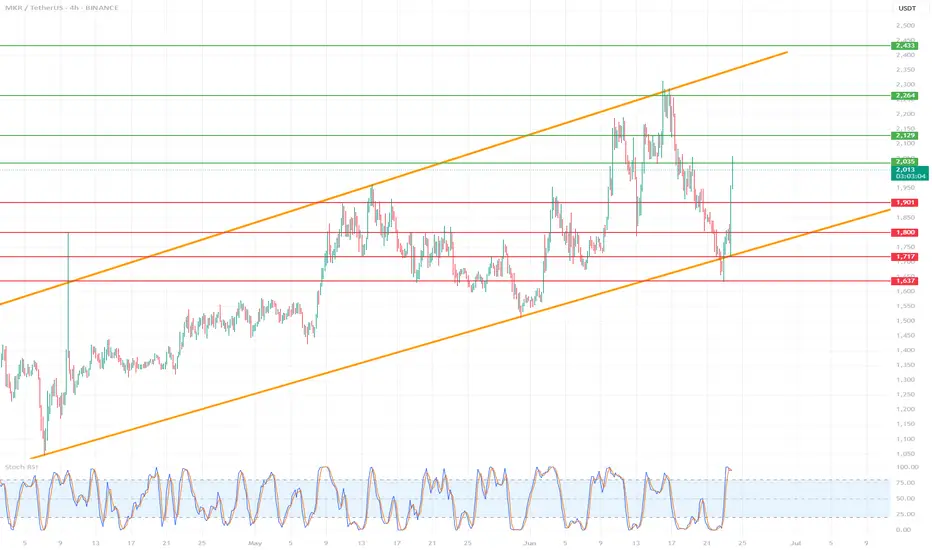
MKR/USDT (MakerDAO) on the 4H time frame🔷 1. Trend and market structure
🔸 Upward channel:
The price is moving in a wide, ascending channel (orange lines).
The lower line of the channel was last tested on June 22, 2025, which ended with a dynamic upward bounce.
The upper limit of the channel reaches around 2,450 USDT.
🕸️ Market phase:
In the short term, the market was in a downward correction phase within the uptrend.
Currently, we see a strong rebound from support - a new uptrend is possible.
🔷 2. Key horizontal levels (support/resistance)
🟥 Support:
1,637 USDT - local support (the lowest level of the red zone), almost tested at the bottom.
1,717 USDT - very technical support, tested several times.
1,800 USDT – psychological level and local consolidation.
1,901 USDT – last support peak, currently broken upwards.
🟩 Resistances:
2,003 USDT – current price level, currently tested as new resistance.
2,129 USDT – strong resistance from previous peaks.
2,264 USDT – previous swing high.
2,433 USDT – upper boundary of the channel and technical level from historical peaks.
🔷 3. Price and candle behavior
Strong demand reaction at the lower boundary of the channel: long pin bar/bull's embrace at the lower boundary.
The upward movement was dynamic and uniform, which indicates high buyer activity.
If the price stays above 1,901 USDT – further increases are possible.
🔷 4. Technical indicators
🔁 Stochastic RSI (4H):
Currently in the overbought zone, just below the level of 100 - a temporary correction or consolidation may occur.
However, with a strong upward trend, Stoch RSI may "stick" to the upper band - it does not yet give a clear S/S signal.
🔷 5. Technical scenarios
🟢 Bullish scenario (continuation of growth):
Condition: maintaining the level above 1,901 USDT.
Targets:
TP1: 2,129 USDT
TP2: 2,264 USDT
TP3: 2,433 USDT (upper limit of the channel)
Stop-loss: below 1,800 USDT
🔴 Bearish scenario (rejection of resistance):
Condition: strong rejection of 2,003 USDT and return below 1,901
Targets:
TP1: 1,800 USDT
TP2: 1,717 USDT
TP3: 1,637 USDT
SL: return above 2,003 USDT
🔷 6. Final remarks
The current upward movement looks like a "V-shape reversal" reaction - a sharp turnaround with dynamic volume suggests strong buyer interest.
The key will be the reaction to 2,003 USDT - a breakout and retest can give a very good long entry.
Short positions are risky as long as the price is in the lower half of the ascending channel.
GOLD → Risk zone 3340. Sell-off after rallyFX:XAUUSD , after breaking out of its accumulation phase, rallied towards the 3400 zone of interest, but failed to reach liquidity and reversed, selling off its gains due to economic uncertainty.
In my opinion, the market is unexpectedly subdued and has reacted very weakly to geopolitical problems in the Middle East. The market has digested the news of US airstrikes on Iranian nuclear facilities and is awaiting PMI data from the US and the eurozone, Fed statements, US GDP and other macroeconomic data. The uncertainty factor has done its job... Participants fear further escalation of the conflict, but so far Iran has refrained from taking drastic steps, which has reduced demand for gold as a safe haven asset. Geopolitics and macro statistics remain in focus.
Technically, gold is trading above 3340 (in the buy zone). A retest of the liquidity zone is possible, and if buyers keep the market above 3340-3350, the price may continue to rise.
Support levels: 3347, 3342, 3320
Resistance levels: 3366, 3396
On D1, the key level is the 3340-3347 area. At the moment, we are seeing a sell-off and a move to retest support. Accordingly, a false breakdown and price holding above 3340, followed by a change in character and a breakdown of the bullish structure, will hint at growth. But if the reaction at 3340 is weak and the market continues to storm this support, then in this case, the metal could drop to 3300
Best regards, R. Linda!

US 100 – Potential For Further Geo-Political Volatility AheadEarly trading this Monday morning has been dominated by President Trump's surprise weekend decision to launch airstrikes on three nuclear sites in Iran, which may increase the potential for a wider conflict in the Middle East.
After closing at 21,652 on Friday, this news led the US 100 to a gap open lower to 21,375 in early Asian trading, however, this drop didn't last long and the index has since recovered to trade back up to 21600 again at the time of writing (0800 BST).
Looking forward, the focus for traders may continue to be on Iran's next move. So far they have confined their retaliation to missile attacks on Israel, but they did issue a statement saying they reserve all options to defend themselves.
Fresh attacks on US bases in the region, or deciding to close the Strait of Hormuz, a vital shipping supply route for Oil and Gas from the region, may undermine risk sentiment which could lead to renewed selling of the US 100, while any options suggesting a potential quicker resolution to this conflict may be seized upon by traders to push the index back up to higher levels seen in the middle of last week.
There are scheduled events released across the week that may also be relevant, these include the testimony of Federal Reserve (Fed) Chairman Jerome Powell to congress at 1500 BST on Tuesday and Wednesday, as well as the next US PCE Index update at 1330 BST on Friday, which is the Fed's preferred inflation gauge.
Technical Update: Assessing Support and Resistance Levels
Escalation of hostilities in the middle east over the weekend may leave traders uncertain as to the direction of the next price activity for the US 100 moving forward.
However, technical analysis can help to outline potential support and resistance levels, which if broken to the up or downside, might offer clues on where the index may move.
Potential Support Levels:
Looking at the chart of the US 100 index below, it could be argued that Monday’s lower opening level has already tested what traders may be viewing as support at 21373. This level is equal to half the May 23rd to June 11th phase of price strength.
Having seen an initial recovery following tests of this 21373 level, it may now have been strengthened as a support focus. This means closing breaks below 21373, while not a guarantee of further price declines, may suggest tests of the next support at 20666, which is the May 23rd price low, even 20360, the 38% Fibonacci retracement level, could be possible.
Potential Resistance Levels:
In terms of resistance levels to monitor this week, as the chart shows, Friday’s activity did see a sell-off from its 21905 session high. This confirms sellers have been active at this level previously and may prove to be again.
As such, traders may now be watching the defence of this 21905 level on a closing basis, as breaks above this resistance may now be required to see attempts to push to higher levels which may include a challenge of resistance at 22074, the June 11th session upside extreme, possibly then 2226, the February 18th high.
The material provided here has not been prepared
accordance with legal requirements designed to promote the independence of investment research and as such is considered to be a marketing communication. Whilst it is not subject to any prohibition on dealing ahead of the dissemination of investment research, we will not seek to take any advantage before providing it to our clients.
Pepperstone doesn’t represent that the material provided here is accurate, current or complete, and therefore shouldn’t be relied upon as such. The information, whether from a third party or not, isn’t to be considered as a recommendation; or an offer to buy or sell; or the solicitation of an offer to buy or sell any security, financial product or instrument; or to participate in any particular trading strategy. It does not take into account readers’ financial situation or investment objectives. We advise any readers of this content to seek their own advice. Without the approval of Pepperstone, reproduction or redistribution of this information isn’t permitted.

Litecoin LTC price analysisToday we will analyze the third candidate for ETF in the near future is CRYPTOCAP:LTC
An old coin, good fundamentals, 1:1 tokenomics like CRYPTOCAP:BTC but 4 times more coins, untapped potential, and the list goes on...
♎️ The main difference from the previous two candidates is the current market cap of the coins: CRYPTOCAP:XRP - $118 billion, CRYPTOCAP:SOL - $72 billion, #Litecoin only $6 billion
Accordingly, the prospects for growth in the price of OKX:LTCUSDT are many times greater
🔥 Currently, #LTCUSD price is near the potential purchase zone of $71.25-76.25
📈 Growth potential of at least $170-180
🐻Critical level of $67
_____________________
Did you like our analysis? Leave a comment, like, and follow to get more

GBPUSD - Technical Outlook (Long + Short Term)In this article, I’ll share my current outlook on GBPUSD, highlighting both higher time frame (HTF) and intraday considerations.
Higher Time Frame Analysis
The overall trend remains bearish. Price is still trading within the previous structural leg, with the key level at 1.42500. Unless we see a decisive break above this level, my bias will remain bearish for this pair.
Recently, we’ve witnessed what looks like institutional manipulation to the upside, followed by a sharp bearish reaction from the weekly supply zone. This price action aligns with a classic Wyckoff distribution cycle, which often signals that the prevailing trend is likely to continue.
Intraday Advice
For short-term traders, it’s best to wait for lower time frame (LTF) pullbacks and signs of manipulation before considering short positions. If price continues to push lower, there should be opportunities to ride the trend down over the coming weeks, with multiple entry points along the way.
Trading Considerations
If this analysis plays out, there’s potential to maximize gains through both swing and intraday trades. However, patience and risk management are key. Losses are inevitable - what matters is managing risk and staying disciplined.
Key Points to Remember:
Wait for clear pullbacks before entering trades.
Stick to your risk management plan.
Stay patient and let the market come to you.
This is an exciting time to trade FX:GBPUSD , but always assess if the risk is worth the reward before entering any position.
Happy hunting predators...
Apex out!

BNB Double Correction Hits Extreme ZoneBINANCE:BNBUSD has now entered the Blue Box buying area, signaling the final phase of the correction. A weekly reversal confirmation is the next key step — once that’s in place, the bounce phase is expected to begin.

Injective Enters the Daily Bouncing AreaCRYPTO:INJUSD has tapped into the equal legs zone at $9.99–$8.97, a key Fibonacci-based support area where buyers may begin to step in. This zone often acts as a magnet for a reaction higher, especially if the broader structure supports a bullish reversal.
In the coming weeks, watch for confirmation signals — a strong bounce from this zone could kick off the next leg up.

US30 | FLUSHPOINTto keep it simple we missed our first trade on US30 due to the open gap
therefore we are attempting to re-enter trade as we a back at our POI

GOLD TAKEOFF anticipation Price has broken out of the descending trendline, showing early signs of strength after tapping into a 4H demand zone.
I’m watching for a rounded retest (possible liquidity grab) near the breakout zone, with the next leg targeting a strong bullish continuation.
🔑 Confluences:
Break of structure + Trendline Break
Demand zone reaction ✅
FVG + Minor OB support below = stacked liquidity
Bullish fundamentals: Weakening dollar + Middle East tensions → safe haven demand
📍 Target Zone: Above $3,400
📍 Invalidation: Clean break below $3,344
🚀 "Takeoff in progress... patiently waiting for market to fuel the move."

EUR/USD analysis and pending orderTwo days ago, there was a FED meeting, where it was stated that the benchmark interest rate will be kept at 4.25-4.50% level.
What is important is what they told - the expectations - economicp rojections are lower, and inflation is higher.
Maybe they’ll decrease rates in future?
Right now, it’s not so important. It’s summer already, and by the old “Sell in May, and go aways” mentality, I don’t expect some huge impact on the market.
I know… Iran, Israel, Trump, maybe even Putin? Anybody can do some stupit stuff and everything can go to Hell.
And it’s Friday, not very smart time to open trades, so I’m putting pending order.
I decided for EUR/USD.
Timeframe is 4h.
On my chart I can see clear uptrend in the last couple of weeks, especially in the last 3 months.
Also, I see lower highs.
Upward trend is breached… Where it could stop?
Overall, I don’t expect the pair will come near parity, even though ECB lowered rates before FED did.
But some “selloff”, probably.
I used good old Fibonacci, draw it, and the price could potentialy drop to 50% level or even ideal 61…8%-78.6% zone.
Pending entry: 1.15577
TP: 1.12645
SL: 1.1671
If it activates today, I’ll leave it over the weekend.

NQ Power Range Report with FIB Ext - 6/23/2025 SessionCME_MINI:NQU2025
- PR High: 21787.00
- PR Low: 21566.75
- NZ Spread: 491.75
Key scheduled economic events:
09:45 | S&P Global Manufacturing PMI
- S&P Global Services PMI
10:00 | Existing Home Sales
Open weekend gap down ~0.33%
Session Open Stats (As of 12:45 AM 6/23)
- Session Open ATR: 382.81
- Volume: 38K
- Open Int: 234K
- Trend Grade: Neutral
- From BA ATH: -4.8% (Rounded)
Key Levels (Rounded - Think of these as ranges)
- Long: 22096
- Mid: 20383
- Short: 19246
Keep in mind this is not speculation or a prediction. Only a report of the Power Range with Fib extensions for target hunting. Do your DD! You determine your risk tolerance. You are fully capable of making your own decisions.
BA: Back Adjusted
BuZ/BeZ: Bull Zone / Bear Zone
NZ: Neutral Zone

Bitcoin Stock Chart Fibonacci Analysis 062225Trading Idea
1) Find a FIBO slingshot
2) Check FIBO 61.80% level
3) Entry Point > 99,063/61.80%
Chart time frame:B
A) 15 min(1W-3M)
B) 1 hr(3M-6M)
C) 4 hr(6M-1year)
D) 1 day(1-3years)
Stock progress:B
A) Keep rising over 61.80% resistance
B) 61.80% resistance
C) 61.80% support
D) Hit the bottom
E) Hit the top
Stocks rise as they rise from support and fall from resistance. Our goal is to find a low support point and enter. It can be referred to as buying at the pullback point. The pullback point can be found with a Fibonacci extension of 61.80%. This is a step to find entry level. 1) Find a triangle (Fibonacci Speed Fan Line) that connects the high (resistance) and low (support) points of the stock in progress, where it is continuously expressed as a Slingshot, 2) and create a Fibonacci extension level for the first rising wave from the start point of slingshot pattern.
When the current price goes over 61.80% level , that can be a good entry point, especially if the SMA 100 and 200 curves are gathered together at 61.80%, it is a very good entry point.
As a great help, tradingview provides these Fibonacci speed fan lines and extension levels with ease. So if you use the Fibonacci fan line, the extension level, and the SMA 100/200 curve well, you can find an entry point for the stock market. At least you have to enter at this low point to avoid trading failure, and if you are skilled at entering this low point, with fibonacci6180 technique, your reading skill to chart will be greatly improved.
If you want to do day trading, please set the time frame to 5 minutes or 15 minutes, and you will see many of the low point of rising stocks.
If want to prefer long term range trading, you can set the time frame to 1 hr or 1 day.

Crypto $TOTAL Market Cap Hopeful Weekly CloseWhat a wild close to the Week for the Crypto CRYPTOCAP:TOTAL Market Cap
Closed just above the 50% Gann level within the POI, but failed to close above the EMA9.
Strong bounce off the SMA20 still shows bull have some gas left in the tank, but I suspect we go lower with such a massive bearish candle on the week.
SMA50 is ~2.8T

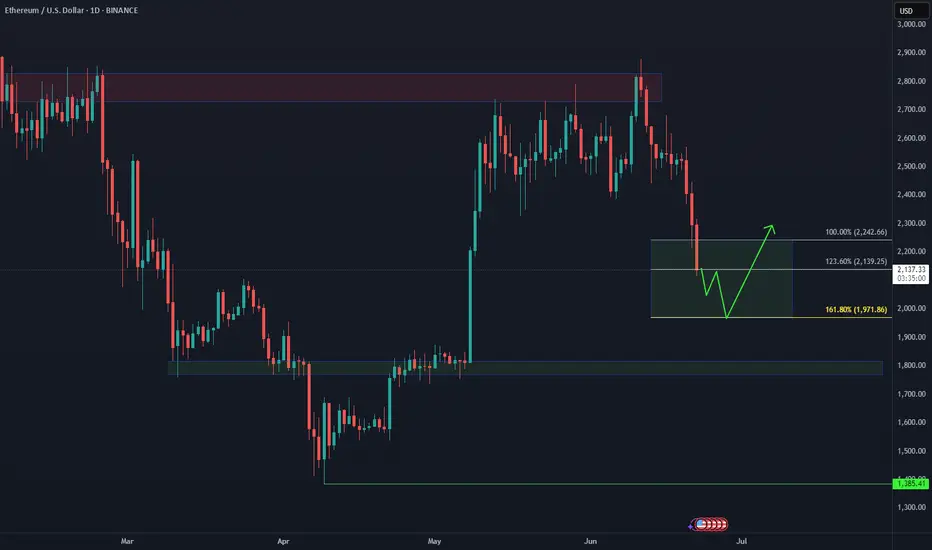
Ethereum: How Deep Into the Buying Area?📉 CRYPTO:ETHUSD is currently testing the extreme buying zone $2140–$1970 — a key area where a bullish reaction is anticipated. But if the bounce fails to materialize next week, eyes shift to the next potential demand zone near $1800.
This level aligns with prior structure and could offer a stronger base for the next leg higher — as long as the broader structure remains intact.
TOTAL 2 Analysis (6H)The TOTAL2 chart — representing the altcoin market cap excluding Bitcoin — currently shows signs of weakness. A double top formation has emerged and is actively playing out. In addition, a micro trend change of character has clearly appeared, further validating short-term bearish pressure.
Technical Observations:
Price recently retested a broken support level and failed to reclaim it — a typical bearish confirmation.
In such scenarios, it’s common for the price to decline at least the depth of the double top formation.
However, it’s important to note that macro trend indicators still remain bullish, so entering aggressive short positions is not advised. Instead, consider setting alerts at the key reversal zones marked on the chart — these levels are likely to trigger a strong rebound.
If TOTAL2 breaks above the $1.23T resistance, this double top analysis becomes invalid.
— Thanks for reading.

USDT Dominance Update (2H)The USDT Dominance (USDT.D) chart — often referred to as the “reverse chart of crypto” — is currently showing signs of strength. On the micro time frame, a new impulsive wave structure has emerged, and we are likely progressing through wave 3 of this formation.
Wave 3 appears to be targeting the 4.88% level.
A minor correction (wave 4) may follow.
Ultimately, wave 5 is projected to reach the 5.00% zone.
Market Implications:
If this scenario unfolds as expected:
Bitcoin could down toward the $100,000–$101,000 range.
However, altcoins may face a sharp correction, with potential losses of 15–20%, exacerbated by the rising BTC dominance and capital flow concentration.
⚠️ While macro bullish momentum remains intact for the market, this short-term USDT.D surge could present a temporary but significant shakeout, especially across the altcoin sector.
— Thanks for reading.

Gold Technical ✅ Entry Level (Long Position):
Ideal entry zone: Between $3,360 – $3,370
This is near the Wave (4) low and just above the ascending channel support line.
Also aligns with the 23.6% Fibonacci retracement level, where price has shown signs of support.
---
🎯 Take Profit (Exit Levels):
These targets are based on Fibonacci extensions and the upper boundary of the channel:
1. TP1: $3,400 (50.0% Fib level) – conservative target, aligns with minor resistance.
2. TP2: $3,415 (61.8% Fib level) – key Fibonacci golden ratio and likely Wave (5) area.
3. TP3: $3,435–$3,440 (upper channel line) – aggressive target, aligns with 100% extension and projected Wave (5) peak.
