GOLD[XAUUSD]: Breakthrough the bearish pressure, What next?Evening Everyone,
Hope you are doing great, price recently breakthrough the current price inducement, showing a strong bullish volume emerging in the market. Long term approach remain bullish ultimately taking the price towards the new high.
Good luck
Team Setupsfx_
Fibonacci

#EURJPY: Major Swing Sell +1100 Pips, One Not To Miss! The Japanese Yen (JPY) is most likely to continue its bullish trend, as the Dollar Index (DXY) is expected to decline due to the ongoing conflict between Israel and Iran. Historically, JPY and CHF, alongside gold and silver, have been favoured by global investors and remain bullish. Strong fundamentals and technical support further support our analysis.
The 167-169 price region remains a critical point for sellers, where we anticipate significant selling volume. There are two entry points to consider: one near the current price and another slightly further away. Please monitor volume and use smaller time frames for entries.
Our Swing Target is at 154, but you can also target smaller zones once the trade is activated. For instance, set take-profit levels at 164, 160, and finally, at 154.
To encourage and support us, you can like the idea, comment on it, or share it.
Team Setupsfx_
❤️❤️🚀🚀

Bitcoin Hits PRZ — Is This the Perfect Short Entry?Bitcoin ( BINANCE:BTCUSDT ) has entered the Potential Reversal Zone (PRZ) after a strong bullish impulse , testing the confluence of Daily Resistance(3) .
In terms of Elliott Wave analysis , the market seems to have completed a complex WXY corrective structure , with the recent rally likely representing the final wave Y . This makes the current zone highly reactive for potential reversal .
I expect Bitcoin to retrace toward the CME Gap($105,075-$105,055) and possibly continue downward toward the Support zone($104,380-$103,060) and Cumulative Long Liquidation levels if the sellers regain momentum .
Cumulative Short Liquidation Leverage: $107,568-$106,601
Cumulative Long Liquidation Leverage: $105,360-$104,784
Cumulative Long Liquidation Leverage: $103,937-$103,217
Note: It is better to look for short positions at the Potential Reversal Zone (PRZ) or if Bitcoin touches $104,780 before reaching PRZ. That is why I chose to label this analysis as ''Short".
Note: If Bitcoin can touch $107,620 , there is a possibility of breaking the resistance lines and increasing further.
Please respect each other's ideas and express them politely if you agree or disagree.
Bitcoin Analyze (BTCUSDT), 1-hour time frame.
Be sure to follow the updated ideas.
Do not forget to put a Stop loss for your positions (For every position you want to open).
Please follow your strategy and updates; this is just my Idea, and I will gladly see your ideas in this post.
Please do not forget the ✅' like '✅ button 🙏😊 & Share it with your friends; thanks, and Trade safe.

BTCUSDTBULLISH TREND
Major Zone = Yellow area
Can take entry on break of HH/
instant buy/
or any fib level 0.5 or 0.618
Sl is mentioned on the chart, you can adjust your tp's according to ur sl and entry.

Gold weekly outlookMonday will indicate to us the trend continuation or if the trend has reversed to the downside.
A temporary uptrend channel has been created to give us an idea. weekly buy and sell zones have been indicated as well
Personally I feel Gold will reverse to the upside but I think its best to wait for Monday to show us the way

Gold weekly outlookThis is my outlook for gold this week, however due to increased Geopolitical developments trading Gold could result in extreme volatility.
please take note of all different zones for buys and sells according to the Fibs. Also if the trend breaks the trend regression channel we could see a pivot to the downside.

What's in it for Solana?I have to say: SOL, on the other hand, doesn't look too bullish here. The prior downtrend was broken, but the price has been rejected by the golden pocket and is currently trading slightly below the range. A drop to $112 is possible if the new trend isn't strong enough.

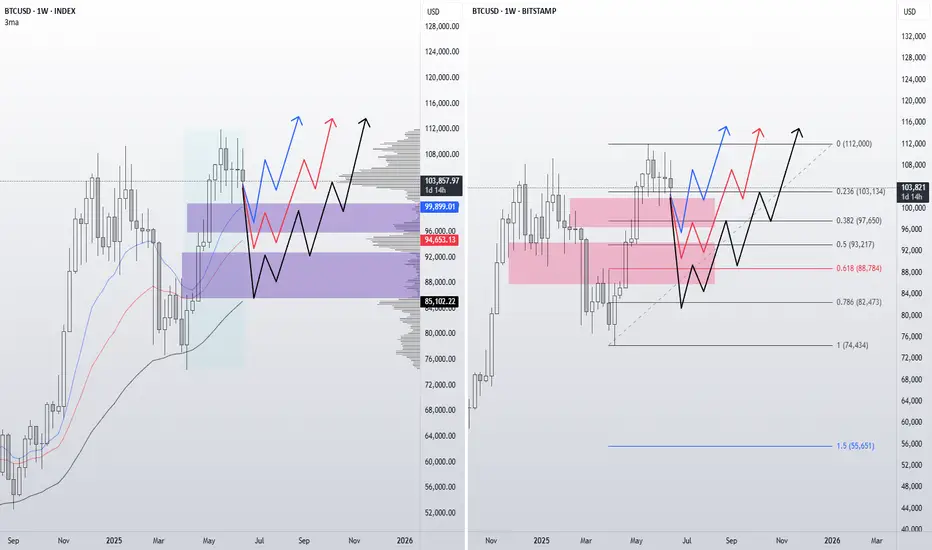
If BTC BullishIf I were a bull and perceived the current divergences to the main indicators as corrections, and not as a change in the market to bearish, then I would present support levels in this form.
In this form, where, as they say, all the stars came together.
Here are the gap levels, and EMA 13/26/52.
Fibonacci levels and mirror levels.
And three options in continuation of Bullish BTC.
Round and round, pick who you’ve found! ))
bitcoin update price broke the symmetrical triangle and moving up slow
but this false pump wont last long.
price just going to tap the fib level of 0.5 to 0.618 and might go a bit up just to trap longs.
i personally will enter short once we tap and reject 0.618.
thanks
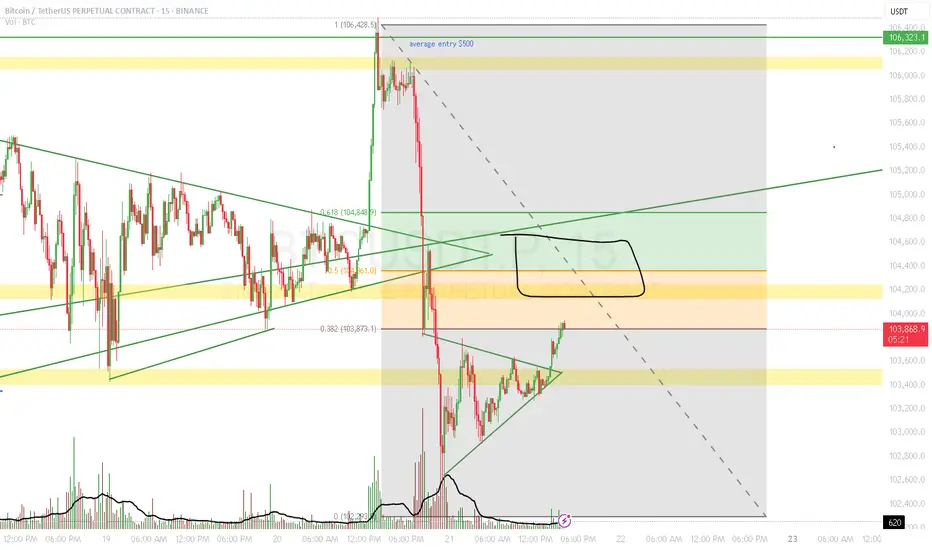
BTC 4H SCALPBTC/USDT Scalp Setup – 4H Chart
Entered a scalp position with TP1 aligned at the Fibonacci extension near 105,652. The first take-profit has been secured, and the remainder of the position is being left to ride — no emotional attachment. If invalidated, the trade will be abandoned without hesitation.
Technical Overview:
Price broke out of the local downtrend channel
Watching for a potential green dot on the volume oscillator to confirm upward continuation
VMC Cipher B shows early signs of a shift; confirmation is still pending
That said, short-term caution is warranted.
Bearish Considerations:
On the higher timeframes, there’s a visible bearish divergence between price and volume — price continues to push higher, while volume fades, indicating a potential trend exhaustion.
Thanks for your support.
If you found this idea helpful or insightful, feel free to leave a like or comment, open to your thoughts and perspectives.

btc short now you have a very clear view of whats gonna happen
101k is inevitable. And if 101 dosent hold, 98 will be our balance point where market will go for making lower high and if price action changes we can go for a new ATH, which i guess will be our final ATH before we drop for a fresh new bear cycle.
thanks

This is looking good!The liquidity at 103k has been taken and five waves have been completed. Now, we should be all set. In theory, at least.

BTC ROAD TO ALL TIME HIGHHere is my prediction on weekend is BTC is a great time to pump.
So taking long now, SL near current support around 100-120 pips is good enough

$mamo idea - IDK, just ideatingNASDAQ:MAMO has been free falling since it hit its ATH. I'm wondering if it's going to find support? Not sure - I haven't looked at any other patterns. I'll do that and update this at some point.

PLTR: Broad Cycle Breakdown via Fibs Interference Pattern
Growth angle
ST downtrend angle
Highlighting shape of expansion + scaling the structure to new axis that advances after establishing longer term full cycle.

1000PEPE looks good from here?I did my analysis on different times frames, On higher time frame we are bearish, Short time frame up or down is unpredictable. On as you guy can see price didn’t respect trend and breakdown’ It’s does means that 100% is goin down because we also have Fib Support may that change the market direction from bearish to bullish. We also have FVG which didn’t respect it also and As you guys can see the situation of market mostly up and down by news. So I don’t expect anything good news for the market right now but we should prepare for everything. Those analysts on daily time frame.

HYPE/USDT Technical Analysis (4H Chart)🔍 HYPE/USDT Technical Analysis (4H Chart)
High Time Frame (Daily): Bullish
Despite recent pullbacks, the overall trend remains bullish on the daily timeframe. However, current price action suggests a potential fakeout or legitimate breakdown, as we test key structural and volume-based supports.
Short-Term Time Frame (4H): Bearish
The 4-hour chart displays clear bearish pressure, confirmed by the Three Black Crows candlestick pattern. This signals sustained selling interest and supports the current downward move.
🧱 Key Zones
Supply Zone: $41.7 – $45.9
Strong resistance marked by prior selling pressure and overlapping FVGs.
Demand Zone: $24.4 – $26.3
Historical area of buying support, aligned with a low-volume node and an unfilled FVG.
📏 Fair Value Gaps (FVGs)
Above Price:
Four 4H FVGs act as upside inefficiencies, offering targets in a bullish recovery:
~$34.9
~$36.6
~$37.8
~$40.0 (psychological level & POC cluster)
Below Price:
One major 4H FVG remains unfilled, directly above the demand zone.
📐 Fibonacci Analysis
Price is testing the Golden Pocket (0.618–0.65) from the recent swing low to high.
A clean break below this area (with confirmation) targets the unfilled FVG around $30, and potentially the demand zone ($24.4–$26.3).
📉 Volume Profile Insight
Volume is clustered around $34–$37, indicating strong past market participation.
Very low volume between $29–$30, creating a volume void — if price loses support at the FVG and golden pocket, it could rapidly drop into the demand zone.
🔻 OBV Analysis (Volume Momentum)
OBV has broken below a larger rising wedge, confirming bearish divergence.
A falling wedge is now forming within OBV.
Break below this wedge: Confirms further price breakdown.
Reclaim of the larger wedge trendline: Suggests potential bullish reversal.
✅ Trade Scenarios
🔺 Bullish Scenario
Trigger: Bullish reversal pattern at the golden pocket (e.g., double bottom, falling wedge, inverse H&S) + OBV recovery.
Entry: Upon confirmation around $32.5.
Targets:
$34.9 (FVG)
$36.6 (FVG)
$37.8 (FVG)
$40.0 (psychological)
Stop: Below $30 or recent swing low (tight below FVG).
🔻 Bearish Scenario
Trigger : Confirmed breakdown of golden pocket & 4H FVG with OBV falling wedge breakdown.
Entry : Below $32.5 with confirmation (e.g., retest or strong momentum candle).
Targets:
$30.0 (psychological level)
$28.5 (FVG zone)
$26.3 → $24.4 (Demand zone)
Stop : Above golden pocket resistance (~$33.8–$34.2).
📝 Conclusion: The market is at a pivotal point. A confirmed break below $32.5 could accelerate selling due to the volume gap, while a strong bullish reaction from the golden pocket could drive a recovery toward $40. Always wait for confirmation before entering either scenario.

Looking deeper in the consolidation zone of $BTC 4hr Wanted to show how I use fibs and how I use them to approach entry and exit points while in consolidation.

$100 a barrel coming soon for Crude oil futures In this video we focus on the current accumulation in the oil chart and the prospect of higher prices ahead .
I highlight how the respect of the previous quinquennial pivots gave us a 45% move to the upside in the past 8 weeks .
Looking ahead on the monthly timeframe we have the following confluences above the current price of $75 .
Above the current pa we have the point of control at $ 88 and the avwap at $97, if we can reclaim the poc I think we will continue to push up to the fib levels that I have mentioned in the video.
In addition to the above we also have the decennial pivots at $107/$112 alongside the value area high .
All of this validates for me why oil will be pushing back up throughout the course of the year .
Tools used in the video
Tr pocket , pivots , fived range volume profile and fib expansion

EUR/USD Slips Toward Trend SupportEuro plunged nearly 1.6% from the highs with price rebounding this week at former resistance at the 1.618% extension of the May advance. While the risk remains for a deeper correction towards the April uptrend, we’re looking for signs of support / that a low is in.
EUR/USD is trading within the confines of a proposed descending channel with price rebounding off confluent support at the lower parallel yesterday. The immediate focus is on this recovery with initial resistance eyed at the 61.8% retracement of the recent decline / the high-day close (HDC) at 1.1560/85. Ultimately, a breach / close above the 2016 high would be needed to mark uptrend resumption towards the upper parallel (currently near 1.1680s) and the August 2015 high / 78.6% retracement of the 2021 decline at 1.1714/47- both regions of interest for possible top-side exhaustion / price inflection IF reached.
Initial support rests at 1.1455 and is backed by the 38.2% retracement of the May advance at 1.1415. Note that the April trendline converges on this threshold mid-week and a break / close below this slope would be needed to suggest a more significant high weas registered las week / a larger trend correction is underway. Subsequent support rests with the objective monthly open at 1.1347 and the 2023 high / 61.8% retracement at 1.1276/82- look for a larger reaction there IF reached.
Bottom line: The Euro rally remains vulnerable to a test of uptrend support while below 1.1585. From a trading standpoint, losses would need to be limited to the April trendline IF price is heading higher on this stretch with a close above 1.1616 needed to mark uptrend resumption.
-MB


30x in BrettBrett is gonna 30 x during ALT rally. This is how I am going to invest in it.
do you agree with me?

GOLD → Consolidation within a falling wedgeFX:XAUUSD is consolidating. A major player is gathering a trading position inside a wedge ahead of distribution. But the main question is: in which direction?
Gold lost ground again on Friday after mixed holiday trading on Thursday. Traders are waiting for new signals from the Fed and monitoring the situation in the Middle East. Interestingly, gold fell as the conflict escalated further (which is not logical overall). The dollar is in a global bearish trend, and traders are waiting for a decision from Powell (who is under pressure from Trump to cut rates).
Technically, if we look at the wedge, we can see how difficult it is for the market to move. The price is stuck inside the consolidation. The intraday movement is very short, with long tails and a very weak reaction to both false breakouts and level break. Large players are building up positions inside the current channel. This may only hint at the possibility of future implementation (distribution).
Resistance levels: 3360, 3396, 3420
Support levels: 3338, 3320, 3302
On D1 - H4, gold is in a countertrend (bullish trend) correction and is testing the trend support + 0.7 Fibo zone. Below, there are fairly strong areas of interest — 3320 and 3302 — which gold may test before rising. However, within the wedge, there is a fairly high probability of a breakout of resistance and the 3360 level, followed by a rally to the liquidity zone at 3396
Best regards, R. Linda!
