Solana Wave Analysis – 20 June 2025
- Solana reversed from support level 141.60
- Likely to rise to the resistance level 163.8
Solana cryptocurrency recently reversed up from the support area located between the strong support level 141.60 (which has been reversing the price from the end of April) and the lower daily Bollinger Band.
The upward reversal from this support zone continues the active intermediate impulse wave (3), which also started from this support area last week.
Solana can be expected to rise to the next resistance level 163.8 (which stopped the previous impulse wave B earlier in June).
Fibonacci

Bitcoin– bearish momentum builds after rejection at $109KIntroduction
Bitcoin (BTC) is currently showing weakness after forming a lower high at $109,000. This level acted as a significant point of rejection, and since then, BTC has been moving lower. The price has broken through key support areas, indicating a possible shift in market structure. In this analysis, we’ll break down the recent price action, explain the technical signals behind the move, and discuss what could be expected in the short term.
Rejection from the 0.786 Fibonacci Level
The rejection at the $109,000 level aligns perfectly with the 0.786 Fibonacci retracement on the 4-hour timeframe. This level is often seen as a strong resistance point during corrective moves, and in this case, it held firmly. The precision of this rejection gives it more weight, and since hitting that point, BTC has been steadily declining. This move down suggests that buyers were unable to push through the resistance, leading to increased selling pressure.
Break of the 4H Bullish FVG
As BTC started its decline from $109,000, it broke through the bullish Fair Value Gap (FVG) that had formed earlier on the 4-hour chart. This gap previously served as a support zone but has now been decisively broken with strong volume. The loss of this level is significant, as it marks a breakdown of the bullish structure and opens the door for further downside movement. In the process of this move lower, BTC has created a new bearish FVG on the 4-hour timeframe. This gap remains open and could potentially act as a magnet for price to revisit, offering a possible short entry if price retraces into that zone. However, the clear break below the previous bullish FVG indicates a shift in momentum and supports a more bearish bias for now.
Downside Target at $102.7K
Given the recent breakdown, the next key level to watch is around $102,700. This area marks the wick low on the 4-hour timeframe and stands out due to the size and sharpness of the wick. Such large wicks often leave behind unfilled orders, which markets tend to revisit over time. The presence of these resting orders makes this level a likely target for the ongoing move down. It also acts as a strong area of potential support, where buyers might step back in if the price reaches that point.
Conclusion
With the rejection from the 0.786 Fibonacci level and the failure to hold the bullish 4H FVG, BTC has shown clear signs of weakness. The breakdown in structure suggests a continuation to the downside is likely, with $102.7k being the most immediate target. This level could serve as a strong support zone due to the unfilled orders left behind by the previous wick. Until BTC reclaims key support levels or shows a shift in momentum, the bias remains bearish in the short term, and traders should remain cautious while expecting further downside.
Thanks for your support.
- Make sure to follow me so you don't miss out on the next analysis!
- Drop a like and leave a comment!

Upondo qatha neDolaThe FX:GBPUSD pair is projected to reach a high of 1.403 in the near future, driven by a combination of factors including improving UK economic data, hawkish signals from the Bank of England, and a weakening U.S. dollar amid expectations of Federal Reserve rate cuts. Market sentiment has turned increasingly bullish on the pound, supported by stronger-than-expected inflation figures and resilient growth indicators. If current trends continue, the pair could test the 1.403 resistance level, marking a significant move in favor of sterling.

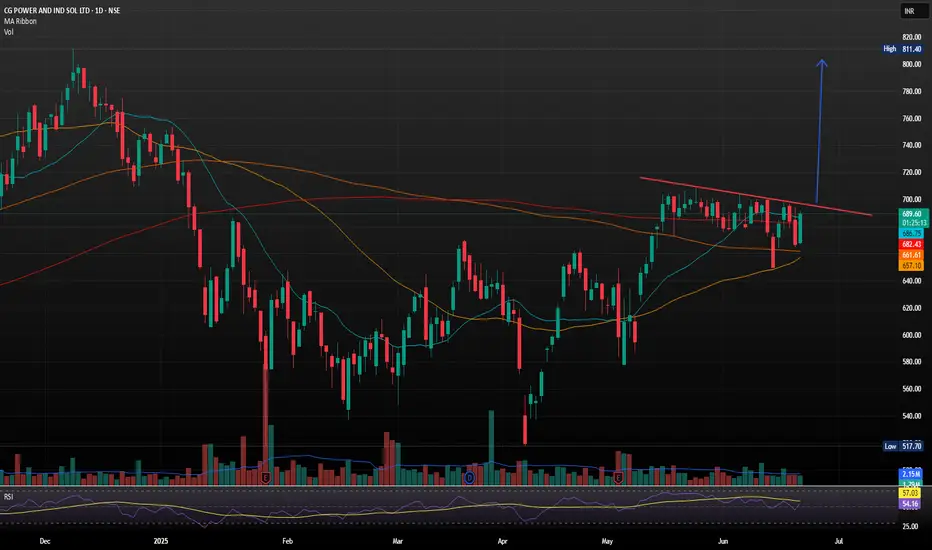
CG Power and Industrial Solutions with Strong Bullish Flag SetupCG Power and Industrial Solutions just landed its largest-ever single order a 641 crore contract from Power Grid Corporation of India Ltd (PGCIL) for high-voltage transformers and reactors
The company, now under the Murugappa Group, reported consolidated FY25 revenues of 9,909 crore. However, annual profit dipped to 972.98 crore from 1,427.61 crore in FY24, despite a strong Q4 showing with a 17% YoY rise in net profit to 274.26 crore.
- Inverse Head & Shoulders Breakout: The stock recently broke out of an inverse H&S pattern, a classic bullish reversal signal, with strong volume confirmation. Holding above 690 could push it toward 750 TO 800.
Support & Resistance Levels
- Support: 663–679 demand zone
- Resistance: 694, 704 and 712
Trend Summary
- Short-Term: Neutral to bullish
- Medium-Term: Bullish bias if it sustains above 690
- Volatility: Elevated, so expect sharp swings
XAUUSD analysisI am hoping for huge buy movement from my depicted zone .
Please follow to support me .
Thank you !

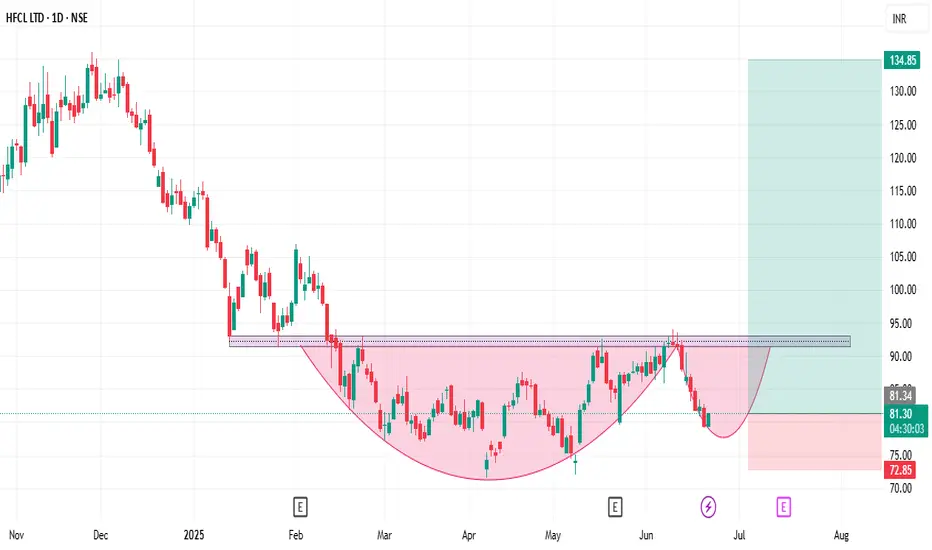
HFCL Super Long Trade Setup📊 Price Action & Trend Analysis
Analyzing market trends using price action, key support/resistance levels, and candlestick patterns to identify high-probability trade setups.
Always follow the trend and manage risk wisely!
Price Action Analysis Interprets Market Movements Using Patterns And Trends On Price Charts.
👉👉👉Follow us for Live Market Views/Trades/Analysis/News Updates.
NQ Power Range Report with FIB Ext - 6/20/2025 SessionCME_MINI:NQU2025
- PR High: 21930.25
- PR Low: 21745.75
- NZ Spread: 412.0
Key scheduled economic events:
08:30 | Philadelphia Fed Manufacturing Index
Session Open Stats (As of 1:05 AM 6/20)
- Session Open ATR: 377.21
- Volume: 155K
- Open Int: 230K
- Trend Grade: Neutral
- From BA ATH: -4.2% (Rounded)
Key Levels (Rounded - Think of these as ranges)
- Long: 22096
- Mid: 20383
- Short: 19246
Keep in mind this is not speculation or a prediction. Only a report of the Power Range with Fib extensions for target hunting. Do your DD! You determine your risk tolerance. You are fully capable of making your own decisions.
BA: Back Adjusted
BuZ/BeZ: Bull Zone / Bear Zone
NZ: Neutral Zone

XAUUSD I Daily CLS I D1 FVG / OB Midpoint confluenceHey, Market Warriors, here is another outlook on this instrument
If you’ve been following me, you already know every setup you see is built around a CLS Footprint, a Key Level, Liquidity and a specific execution model.
If you haven't followed me yet, start now.
My trading system is completely mechanical — designed to remove emotions, opinions, and impulsive decisions. No messy diagonal lines. No random drawings. Just clarity, structure, and execution.
🧩 What is CLS?
CLS is real smart money — the combined power of major investment banks and central banks moving over 6.5 trillion dollars a day. Understanding their operations is key to markets.
✅ Understanding the behavior of CLS allows you to position yourself with the giants during the market manipulations — leading to buying lows and selling highs - cleaner entries, clearer exits, and consistent profits.
📍 Model 1
is right after the manipulation of the CLS candle when CIOD occurs, and we are targeting 50% of the CLS range. H4 CLS ranges supported by HTF go straight to the opposing range.
Analysis done on the Tradenation Charts
Disclosure: I am part of Trade Nation's Influencer program and receive a monthly fee for using their TradingView charts in my analysis.
"Adapt what is useful, reject what is useless, and add what is specifically your own."
— David Perk aka Dave FX Hunter ⚔️
👍 Hit like if you find this analysis helpful, and don't hesitate to comment with your opinions, charts or any questions.

GBPJPY I Expect a Rally from the Buy Zone in the 1H Time FrameDescription:
I'm viewing the 195.116–194.845 range on GBPJPY as a strong buy zone. My target is 196.088. Once the trade setup becomes active or the target is reached, I’ll be sharing an update here. Stay tuned!
I meticulously prepare these analyses for you, and I sincerely appreciate your support through likes. Every like from you is my biggest motivation to continue sharing my analyses.
I’m truly grateful for each of you—love to all my followers💙💙💙

GOLD → Continuation of the global trend... To 3350?FX:XAUUSD is testing trend support within a correction. Against a complex fundamental backdrop (the Middle East, Fed comments, Trump's desire to lower rates), the price may continue to rise.
The price of gold rose from a weekly low of $3,363 on Thursday thanks to increased demand for safe-haven assets following reports of possible US strikes on Iran. Markets are ignoring the Fed's hawkish decision to maintain its tight policy and rate forecasts. Traders are waiting for new signals from the Middle East, given the risk of increased volatility due to low liquidity in connection with the US holiday.
Technically, a bullish wedge pattern is forming as part of the correction. The breakdown of the pattern's support did not lead to a decline, but a return of prices and a breakout of resistance could trigger growth after liquidity returns.
Resistance levels: 3373, 3403, 3420
Support levels: 3349, 3320
Before growth, a retest of the trend support or the 3350 zone is possible. However, if the price goes above 3375 and the bulls hold their ground above this level, then we can expect growth to continue within the trend.
Best regards, R. Linda!

NXPCUSDT → The coin is being killed. Searching for a new bottomNXPCUSDT is testing the bottom at 1.1675 while Bitcoin and the top 10 cryptocurrencies are in a global/local bullish trend...
NXPCUSDT is showing its weakness in the cryptocurrency market. There is no potential or driver for the coin, and it continues to be killed... Against the backdrop of a growing market and Bitcoin forming a bullish trend, the NXPC coin is testing the bottom...
After a strong and long-term decline, the NXPC coin is forming a flat (consolidation) in the range of 1.5637 - 1.1675. A pre-breakdown base is forming relative to support, which could lead to the price breaking out of consolidation downwards...
Resistance levels: 1.2532
Support levels: 1.1675
Focus on support for the range and bottom in the current coin at 1.1675. This is a risk zone and a panic zone. If the price breaks out of this consolidation, there are no obstacles below and the fall could be aggressive. A breakout of the consolidation support could trigger a continuation of the rally or a decline with the aim of forming a new bottom...
Best regards, R. Linda!

PDYN on WatchLooking for breakout over previous high at $9.16
Why:
Price reacting to .50 fib levels as marked in the orange circles
Rounded bottom on daily/weekly
More above average volume on green days than red days in the past week
MACD Bullish
Price above all EMAs

AAOI on WatchLooking for a breakout above previous high.
Why:
Selling was high in the past (June 12th) at this point. This time, the price was able to say in this zone.
Target is 1.618 fib level.

AMD: Mapping Cycle via 3 FibsWaveform
High To High cycle Fib interconnection
Extension to the right matches recent bottom.
Expanding and anchoring the structure on L2L cycle
Levels around 3 intersections expose highest probability density.

ISSC on WatchWhy:
Bounce off demand zone
High volume breakout, low volume on the way down.
MACD looking ready to turn bullish
If entered, looking for a retes tof previous high or a run to the 1.618 fib level.

BKE on WatchLooking for a pullback to .5 fib level
Why:
High volume green days
Uptrend on daily chart
Green line is 1.618 fib on weekly daily chart.

FINV on WatchLooking for a pullback to close the gap.
Why:
Rejected at 1.618 fib extension
Gap to close
High green volume
Bullish MACD

Upon reaching PDL price
Previous Day rejected the previous day's low.
When price reaches PDL if price shows a bullish CHOCH to the upside
there could be a bullish orderflow change @ near previous day low's
Could be a good long entry towards previous day high

AU-longas of now structure has broken to the upside and given us a equal high. we should wait for more data before we enter for a buy .

German 40 Index – Sentiment Facing a Sterm TestSince hitting its most recent all time high of 24469 on June 5th the Germany 40 index has experienced some downside pressure as traders have moved to lock in profits on a very strong start to the year. This move has the potential to turn June into the worst monthly performance of 2025 so far, although there is still another 8 trading days to go.
This short-term shift in sentiment has been related to a combination of factors. The new all time high of 24469 hit on June 5th coincided with the latest ECB interest rate cut. However, at that meeting Madame Lagarde indicated in the press conference that more data on the path of inflation, trade tariffs with the US and Eurozone growth would be required before the ECB would consider cutting interest rates again.
This was followed by comments and headlines which suggested that progress on a trade deal between the US and EU was slow and would potentially continue past the original July 9th pause deadline set by President Trump.
Then in the last week sentiment has been rocked further by the spike in Oil prices driven by an escalating conflict between Israel and Iran that has seen them trade missile attacks for 7 straight days, alongside a growing concern that the US may also be seriously considering entering a direct conflict with Iran after Bloomberg reported yesterday that senior US officials are preparing for a possible strike in the coming days.
At the time of writing (0700 BST) this leaves the Germany 40 trading at 1 month lows around 23142 and suggests a consideration of the technical outlook, including potential support and resistance levels could be useful.
Technical Update: Watching 23235 Last Correction Low
Having posted a new all-time high on June 5th at 24469, a more extended price correction has developed in the Germany 40 index. Interestingly, as the chart below shows, this phase of weakness has seen closing breaks under what some might have anticipated would be support, marked by the Bollinger mid-average (currently 23862).
In previous reports, we have suggested that traders may use the Bollinger mid-average as an indicator of the possible direction of the current price trend. If the mid-average is rising with prices above it, the trend may be classed as an uptrend, while if the mid-average is falling with price activity below it, a downtrend might be in place.
As the chart shows, following the latest breaks below the mid-average, this has now turned lower, and traders might now be focusing on the possibilities for an extended phase of price weakness.
Let's consider the possible support or resistance levels that could be worthwhile for traders to focus on.
Potential Support Levels:
With Thursday’s initial price activity so far seeing further selling pressure, as the chart below shows, it might be suggested the next relevant support is already currently being tested with moves below 23235. This level is equal to the last correction low posted on May 23rd at 23235.
Traders might now be watching how this 23235 low support is defended on a closing basis over coming sessions, as confirmed breaks lower, while no guarantee of deeper price declines, might skew risks towards tests of the next potential support at 22303, which is equal to the 38.2% retracement of April 7th to June 5th strength.
Potential Resistance Levels:
Since the June 5th all-time high, an extended decline in price has already been seen, so a reactive recovery might be a possibility. However, having recently seen the mid-average turn lower, closing breaks back above its current 23862 level might now be required to trigger a phase of price recovery.
While much will depend on future price trends and market sentiment, if successful upside breaks above the 23862 mid-average are seen, it might lead to tests of 24469 which is the June 5th all-time high.
The material provided here has not been prepared accordance with legal requirements designed to promote the independence of investment research and as such is considered to be a marketing communication. Whilst it is not subject to any prohibition on dealing ahead of the dissemination of investment research, we will not seek to take any advantage before providing it to our clients.
Pepperstone doesn’t represent that the material provided here is accurate, current or complete, and therefore shouldn’t be relied upon as such. The information, whether from a third party or not, isn’t to be considered as a recommendation; or an offer to buy or sell; or the solicitation of an offer to buy or sell any security, financial product or instrument; or to participate in any particular trading strategy. It does not take into account readers’ financial situation or investment objectives. We advise any readers of this content to seek their own advice. Without the approval of Pepperstone, reproduction or redistribution of this information isn’t permitted.

INDU - Long trade - Stop loss hunted by smart playerINDUS Motors stoploss hunted by some very very smart player yesterday :)
Brought down to 1685 level and then brought it up to just over its Fib 0.786 level.
It is taking support from its SMA20 level and a golden cross is about to happen next month.
This is the best time to hold onto it (my personal opinion, not a buy / sell call).
It requires patience though. This stock is not for impatient. As per my last analysis of INDU, its targets are minimum 3200 to 3500 (May go further upwards).
Moreover, it is a very good dividend stock. Ideal for long term investment.
Liquidity sweep can also be observed in last two days ;)

BTC Approaching Key Confluence Zone: Pivot + PRZ + LiquidationsBitcoin ( BINANCE:BTCUSDT ) appears to have broken the Support lines and is currently declining .
In terms of Elliott Wave theory , Bitcoin appears to be completing a corrective wave C . The corrective wave structure is a Zigzag Correction(ABC/5-3-5) .
I expect Bitcoin to start rising again from the Support zone($104,380-$103,660) , Potential Reversal Zone(PRZ) , Cumulative Long Liquidation Leverage($104,471-$103,124) , Monthly Pivot Point , Support line , and 50_SMA(Daily) , and the small CME Gap($106,190-$106,150) will also fill.
Note: Stop Loss: $102,520
Please respect each other's ideas and express them politely if you agree or disagree.
Bitcoin Analyze (BTCUSDT), 1-hour time frame.
Be sure to follow the updated ideas.
Do not forget to put a Stop loss for your positions (For every position you want to open).
Please follow your strategy and updates; this is just my Idea, and I will gladly see your ideas in this post.
Please do not forget the ✅' like '✅ button 🙏😊 & Share it with your friends; thanks, and Trade safe.

Solana SOL price analysis📞 Rumor has it that as soon as the global geopolitics reach a “temporary lull”, the following ETFs will be launched
Solana ETF is the most likely to be the next one (but there are at least 2 coins more on the list, which we will talk about in the coming days)
🪙 So, are you ready to buy CRYPTOCAP:SOL in your investment portfolio? For example, in the range of $117-123
🤖 Maybe we need to launch a long trading bot OKX:SOLUSDT so that it can buy in micro portions on the current possible price correction to get a “tasty price” as a result
◆ Would you like to join such a trading bot and copy them?
◆ And then compare the results with all “ETF candidates”
_____________________
Did you like our analysis? Leave a comment, like, and follow to get more
