MLCF - Cooling down after a long rallyMaple Leaf is cooling down after a long rally and is preparing for touching its all time high.
It struck Fib 0.618 level and is now spending some time here as expected. It may retrace to its Fib 0.5 level (73 to 74) before again going up.
Once it crosses and gives monthly closing above 88, we can see it hitting 108 and then 133 in quick succession.
Fibonacci

BTCUSD 1DI invite you to look at the current situation example, where you can see a lower high formation that has been formed, which could potentially lead to a larger price correction and the formation of a lower low in one of the 3 potentially designated locations.

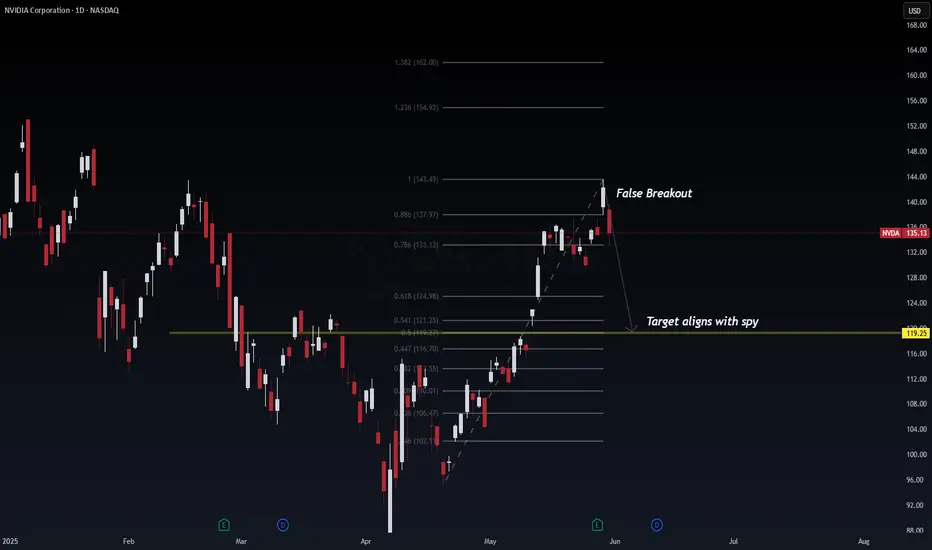
NVDA (NVIDIA) False Breakout and Synchronized Pullback with SPYNVDA printed what appears to be a false breakout at the 1.0 Fib extension level ($143.49), now reversing sharply — potentially aligning with SPY's projected retracement. This presents a high-probability mean reversion setup.
📉 Technical Breakdown
Current Price: $135.13
False Breakout Zone: 1.0 Fib extension ($143.49)
Key Breakdown Zone: 0.786 Fib ($133.12)
Probable Retest Zones:
0.618 Fib: $124.98
0.5 Fib: $121.25
Target: $119.25 (confluence with SPY's demand zone)
🔍 Probabilistic Trade Outlook
⚠️ False breakout + bearish engulfing = 80% probability of continued downside.
📉 Targeting $119.25 = 65% probability as it aligns with institutional levels and SPY’s projected retrace.
💡 Volume and momentum suggest profit-taking and supply absorption.
🌐 Macro Context (May 31, 2025)
AI bubble cooling: Rotation from AI mega caps into broader market value plays.
SPY & NVDA correlation: NVDA typically leads tech-heavy indices — the confluence here could signal broader market pullback.
Fed Policy Uncertainty: No rate cut priced in for June; July will be key.
🧠 Institutional View
This setup echoes the "buy-side trap" — liquidity engineered above previous highs, now reversing to collect resting orders below. This is textbook Smart Money Concepts (SMC) in play.
🧭 Trade Setup
Entry: On confirmed breakdown below 0.786 ($133.12)
Target: $119.25
Stop: $143.60 (above fakeout zone)
Optional Re-entry: Near 0.618 ($124.98) on confirmation
📌 If NVDA hits the $119–121 zone in confluence with SPY’s bounce region, a high-R:R reversal trade may follow.
#NVDA #FibonacciLevels #SmartMoney #LiquiditySweep #TechStocks #MarketReversal #AIStocks #TradingView #WaverVanir
TOTALCAP — The Next Trillion Crypto Move: Are You Ready?When people analyse the crypto market, they often default to Bitcoin and for good reason. It’s the one and only, the king. But sometimes, to see the forest instead of just the tree, you need to zoom out and study the broader picture.
That’s where the Crypto Total Market Cap (TOTALCAP) chart comes in. It’s essentially the mirror of Bitcoin, but it offers powerful macro insight — not just price, but scale. Looking at trillions instead of dollars changes how you frame support, resistance, and overall sentiment. Let’s dive in.
🧠 Why TOTALCAP Matters
TOTALCAP aggregates the value of every coin and token — the complete valuation of the entire crypto industry.
And while it often moves in sync with Bitcoin, it carries a different weight.
Shows the “big picture” of institutional and retail money flow
Offers clearly defined round-number zones (Trillions) as psychological S/R
Removes coin-specific anomalies and focuses on collective momentum
In bull and bear markets, these trillion-dollar thresholds act like major checkpoints. Watching how TOTALCAP interacts with these levels can give early signals that BTC or alts alone can’t.
Historical Key Levels & Structure
Let’s break it down by macro phases:
✅ November 2021 — Peak of Last Bull Market:
TOTALCAP peaked exactly at $3 Trillion.
This level acted as a ceiling — once hit, the market reversed sharply.
This marked the top of the 5-wave impulsive move (Elliott Wave theory).
📉 November 2022 — Bear Market Bottom:
TOTALCAP dropped below $1 Trillion, bottoming at $727 Billion.
This was almost a 0.786 fib retracement from peak — similar to BTC’s historical retracements.
The $1T mark was retested as resistance before being reclaimed as support.
📈 2023–2025 — The Bull Awakens:
$1 Trillion flipped into solid support throughout 2023.
A clear sign the macro market structure had shifted bullish.
Once $2T was breached, things moved fast.
🚀 Current State:
The market surged above the previous $3T ceiling.
TOTALCAP has hit a new ATH: $3.73 Trillion
Now, the question is: Is this the start of a new leg higher, or a bull trap before a correction?
🔍 Fibonacci Confluences — Why $3.7T Was Key
The sharp rejection at $3.7T wasn’t random. It aligns with:
1.0 Trend-Based Fib Extension: From 91.24B → 3T high → 727B low = 1.0 = 3.65T ✅ precise hit
1.272 Fib Extension of the macro move
Upper Pitchfork Resistance
Channel Top Rejection
→ All signals converged to mark that level as major resistance
🌀 Elliott Wave Macro Count
Looking at the weekly timeframe, we can see a clear impulsive 5-wave movement from the 2022 lows:
Wave 1: $727B → $1.26T
Wave 2: Correction to $975B ($1T) (support confirmed)
Wave 3: Massive rally toward $2.72T
Wave 4: Pullback toward $1.69T (VWAP retest)
Wave 5: $3.73T ATH
What does this imply?
According to classical Elliott Wave theory, after a full 5-wave move, the market tends to enter an corrective phase.
🔍 Some key levels to watch:
$3T: Historical S/R (was the 2021 top, now acting as a key level)
$2.31T: Recent swing low
$2T: Psychological and structural support
📌 Zone of Interest for Longs: $2.31T–$2T
This zone holds:
Previous consolidation zone from mid-2024
Fib retracement confluence
Likely forming Wave C bottom if this is a full ABC
🎯 Upside Targets — What If We Continue Higher?
Looking ahead:
🔸 1.618–1.666 Fib Extension = $4.42T–$4.53T
🔸 1.618 TBFE from previous cycle = ~$5.45T
📌 Rounded Targets: $4.5T, $5T and $5.5T
These are the next likely macro cycle targets — but only after a healthy correction and consolidation.
☀️ Macro Context & Summer Seasonality
Historically, summer tends to be a weaker period:
Lower volume
Institutional rebalancing
Geopolitical and macroeconomic uncertainty
📚 Educational Insight: TOTALCAP as a Tool
Treat TOTALCAP like the S&P500 of crypto.
Use round trillions as psychological levels: 1T, 2T, 3T, etc.
Always check if BTC’s price is aligned with where TOTALCAP is on the macro structure
Helps judge market strength even when BTC dominance is shifting
It’s especially useful when altcoins pump or dump out of sync with BTC — you can use TOTALCAP to track the real flow of money.
💡 Final Thoughts
We are likely in a corrective phase after a complete 5-wave cycle.
The area between $2.31T and $2T offers high-probability long entries
Watching how TOTALCAP reacts to these levels will help us anticipate the broader market’s next move
Summer slowdown could mean chop — but this also creates opportunities
💬 Let me know your thoughts: Are we entering a deeper correction? Or will TOTALCAP surprise us with a new leg higher?
Don’t forget to zoom out. The charts always tell the story.
_________________________________
💬 If you found this helpful, drop a like and comment!
Want breakdowns of other charts? Leave your requests below.

$XYZ TP1 met, 60 next 63, 65 then 70+ breakout upon us.
NYSE:XYZ 100 SMA on the daily next target. 60 psych will be tough, but should be a parabolic move to 63 for next fib level.

[ TimeLine ] Gold 9 & 11 June 2025📆 Market Update: Signal Timeline – Gold (June 9 & 11, 2025)
📌 Delayed Journal Entry — Trade Review & Breakdown
📍 Hi-Lo Ranges (with 60-pip buffer)
• June 9, 2025: 3287 – 3344 (Single-candle setup)
• June 9-10, 2025: 3287 – 3355 (Two-candle range)
• June 11, 2025: 3294 – 3366 (Single-candle confirmation setup)
💡 Interestingly, these price patterns showed consistency, and I executed trades based on all three signals.
✅ June 9 – Buy Signal(s)
🔹 Trigger Points:
• 3344 (Single-candle setup)
• 3355 (Two-candle range)
🔹 Price Action:
Strong bullish breakout toward 3451, but experienced significant retracement depending on entry point.
• Drawdown: Up to 50–70% of the range based on entry.
• Gain Potential: Approx. +960 to +1070 pips
⚠️ Fibonacci Note:
Retracement to around 3310 aligned well with the 60% Fibonacci zone, providing a textbook re-entry opportunity.
✅ June 11 – Buy Signal
🔹 Trigger Point: 3366
🔹 Price Action: Continued bullish move to 3451, this time with less volatility and smaller pullback.
• Gain Potential: Approx. +850 pips
📈🧠 Key Takeaway
The June 9 signals required more patience and better handling of retracement, while June 11 offered smoother momentum with cleaner execution. Those following the Fibonacci strategy were well-positioned to catch the continuation.
📉📈 Chart Reference
🔗 Copy & paste into TradingView: TV/x/MyAsl0Gx/

Patience Before the Break: Gold Chart Signals Rally Toward 3,450 Technical Breakdown of the Chart
Key Concepts Used:
BOS (Break of Structure): Indicates a confirmed bullish break in market structure (around June 13).
MSS (Market Structure Shift): Marks a transition from bullish to bearish structure, which aligns with the swing high on June 14.
BSL (Buy-side Liquidity): Liquidity targets marked above recent highs (~3,420 and ~3,450).
Turtle Soup Setup: A classic fakeout reversal pattern, suggesting a stop-hunt below recent lows before a bullish move.
$$$: Liquidity Pool: Shows accumulation below before a breakout upward.
Bullish Case as Implied by the Chart
The chart suggests:
A liquidity sweep occurred at the recent low ("turtle soup").
Price is now rebounding from a demand zone, supported by bullish order flow.
If structure holds, price may:
Break above the minor high at ~3,410–3,420 (first BSL).
Continue upward toward ~3,450+ (second BSL), potentially reclaiming full bullish momentum.
Key Levels to Watch:
Zone Price Range Type
Demand 3,380–3,388 Support Zone
Target 1 ~3,420 Buy-side Liquidity
Target 2 ~3,450 Final BSL Target
If price breaks below the 3,380 zone with momentum, the bullish thesis weakens.
Summary:
Short-Term Trend: Bullish if support holds.
Liquidity Grab Complete: Signs of a reversal from turtle soup setup.
Upside Targets: 3,420 and 3,450.
Invalidation: Break and close below ~3,380

Reddit breaks out for bullish run I have been watching Reddit for a couple of weeks and identified that we had put in the .786 low from the correction since February and then formed a range that was well respected for the past 4 months .
In this video I highlight zones where i expect price to gravitate too and where a nice entry will be if you are looking to long reddit.
Tools used Fib suite , trend based fib , tr pocket , 0.786 + 0.382 and fixed range .

[ TimeLine ] Gold 2-3 June 2025Hello everyone,
📆 Today is Friday, May 30, 2025
📌 Upcoming Gold Signal Dates:
• June 2, 2025 (Monday) — Single candle setup
• June 2–3, 2025 (Monday–Tuesday) — Two-candle range
🧠 Trading Plan & Notes
✅ Gold recently made a bearish move of ~780 pips, breaking below the prior key support at 3323, down to 3245
🔁 Multiple re-entry opportunities were identified using Fibonacci retracement levels, which provided solid price reaction points.
⚠️ If the June 2 Hi-Lo range appears wide and sideways, we may consider holding off until June 4 for confirmation of clearer directional bias.
✅ I will be trading both signals (June 2 and June 2–3) as part of my ongoing research and strategy
⚠️ If the range is narrow or shows false breakout risk, it's okay to skip the June 2 signal and focus instead on the June 2–3 combined range.
📋 Execution Plan
🔹 Wait for the Hi-Lo range from the selected candle(s) to fully form.
▫ These will be marked initially with purple lines on the chart.
▫ After market close, I’ll update the chart with additional indicator levels.
🔹 Entry triggers will be based on breakouts beyond the range, with a 60-pip buffer.
🔹 If the trade hits SL, the plan is to cut/switch direction and double position size on the next valid signal as part of the recovery strategy.
📉📈 Chart Reference
Copy & paste this code into your browser and add TradingView URL:
🔗 TV/x/iQrX0gJW/
✅ Stay alert and follow the signal flow — upcoming entries could offer solid reward potential if executed with discipline.
📌 I'll post the final Hi-Lo levels and updated chart after the June 2 and June 3 candles close.

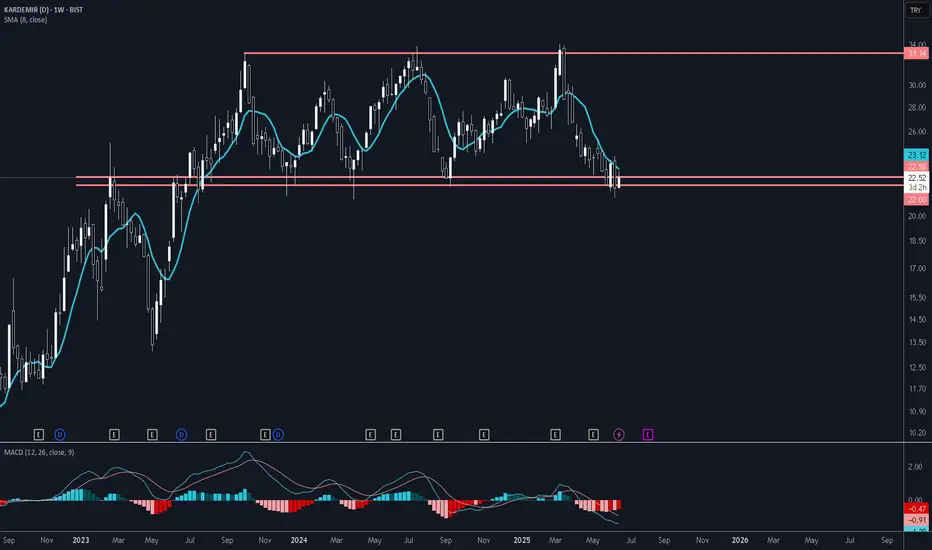
Low Risk for KRDMD Long TradeAs we are close to the bottom line of the horizontal band, long trade is my suggestion in KRDMD. As the stop level would be weekly closure below 22 TL, there is very high risk/reward ratio. I see 25-30% profit is possible if we set the TP as fibonacci 0.618.
Elliot Wave Count Bitcoin - BTCElliot Wave count BTC. Last wave up could be 1st of 5th wave, but think it's a B wave, in expanded flat wave B can take on an impulsive structure and consist of five waves, allowing it to rise above the starting point of wave A. Supported by Elliot Wave count in Equity where probably wave 5 is also placed. And by latest lower high what could be start of market structure change. Invalidation above more or less 113-116k. Fib.time 0.66 gives turning point on July 6th in confluence with end of wedge. World is mega bullish with lot of fresh Longs (big-time in ETF's) waiting for overnight millions. Lets see how this count works out.

Uniswap UNI price analysis🦄 Despite the weak crypto market, #UNI is holding up quite well at the moment, so you should take it "on a pencil".
At first, the “big money” are buying, and then the news will be rolled out.
🕯 The OKX:UNIUSDT chart shows increased trading volumes.
We wouldn't be surprised if in the coming days, when the market moves into a "range", the price of #UNI shoots up to $9.31 or even $11.21
💰 And globally - the price of $22 per #Uniswap token can still be considered a fairly modest forecast.
_____________________
Did you like our analysis? Leave a comment, like, and follow to get more

I had a nightmare this morning.Recently, I published my analysis about BTC and found that BTC is following a rising channel and is being supported by fib retracement.
But unfortunately, BTC hasn't shown any remarkable movement so far, and came back again the the support area.
I feel this is not a good sign for BTC.
ON a weekly view, It May repeat its previous movement.
I am publishing my reservation about BTC, be careful about BTC.

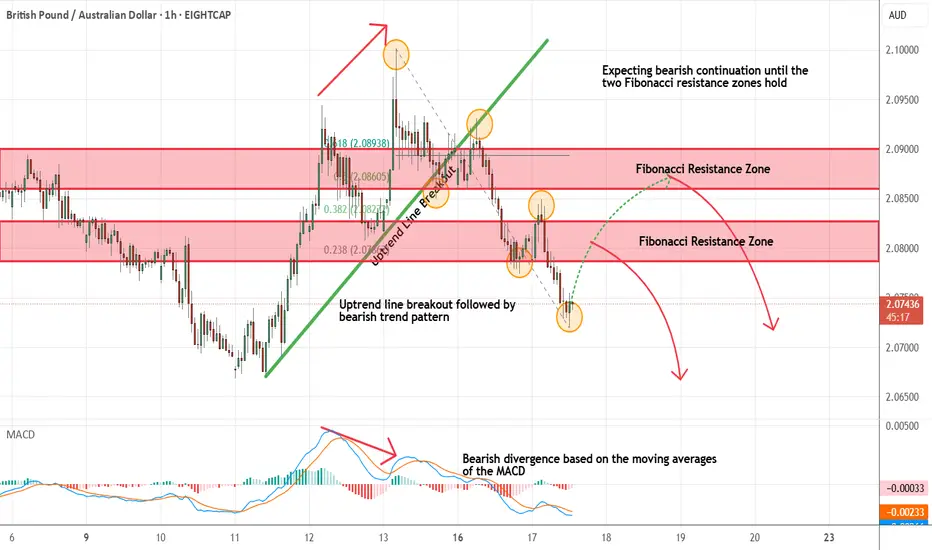
GBPAUD - Expecting Bearish Continuation In The Short TermM15 - Bearish divergence followed by the most recent uptrend line breakout.
Clean bearish trend with the price creating series of lower highs, lower lows.
No opposite signs.
Expecting further continuation lower until the two Fibonacci resistance zones hold.
If you enjoy this idea, don’t forget to LIKE 👍, FOLLOW ✅, SHARE 🙌, and COMMENT ✍! Drop your thoughts and charts below to keep the discussion going. Your support helps keep this content free and reach more people! 🚀
--------------------------------------------------------------------------------------------------------------------
XAU/USD LONG XAU/USD LONG " break of a resistance area + 50 % fib retracement + 50 ema dynamic support +upper trend line "

NQ Power Range Report with FIB Ext - 6/17/2025 SessionCME_MINI:NQU2025
- PR High: 22177.25
- PR Low: 22065.25
- NZ Spread: 250.25
Key scheduled economic events:
08:30 | Retail Sales (Core|MoM)
Contract rollover week
Session Open Stats (As of 12:45 AM 6/17)
- Session Open ATR: 385.81
- Volume: 47K
- Open Int: 178K
- Trend Grade: Neutral
- From BA ATH: -3.5% (Rounded)
Key Levels (Rounded - Think of these as ranges)
- Long: 22096
- Mid: 20383
- Short: 19246
Keep in mind this is not speculation or a prediction. Only a report of the Power Range with Fib extensions for target hunting. Do your DD! You determine your risk tolerance. You are fully capable of making your own decisions.
BA: Back Adjusted
BuZ/BeZ: Bull Zone / Bear Zone
NZ: Neutral Zone

Gold (XAUUSD) Market Outlook - Long Term TrendGold (XAUUSD) Market Outlook: Bullish Trend, Critical Resistance, and Macro Drivers
Technical Analysis:
Looking at the daily timeframe, Gold has been absolutely on fire.
Overall Trend and Market Structure:
• Strong Uptrend: We've seen a remarkably robust and sustained uptrend for Gold since late 2024. It's a textbook example of a healthy rally, consistently printing higher highs and higher lows. This bullish momentum is clear as day, with the candles comfortably riding above that rising blue trendline channel.
• Trendline Support: That prominent blue diagonal band has been a fantastic dynamic support. Gold has bounced off this trendline multiple times (you can spot those green circles), which really solidifies its strength and confirms it as a key support level for this rally.
Key Resistance Level:
• All Time Resistance 3,500: Gold's currently bumping up against a major hurdle: its "All Time Resistance" zone right around 3,500, marked in red. This isn't just a number; it's a huge psychological and technical barrier. Price has poked at this level a few times lately, suggesting there's some serious selling pressure or profit-taking happening up there. A clean, decisive break and close above 3,500 would be a massive bullish signal, likely opening the door to new, uncharted price discovery.
Key Support Levels:
• Fibonacci Golden Level + Breakout Retest Level (3117 to 3167): Now, if we see a pullback, this grey rectangular zone looks like a crucial area of confluence for support.
o Fibonacci Golden Level: This zone perfectly aligns with the 0.618 and 0.71 Fibonacci retracement levels (pulled from that big swing up from the initial low). These are well-known as powerful support and resistance points.
o Breakout Retest: What makes it even stronger is the idea of a "breakout retest." It suggests a previous resistance level that Gold powered through is now expected to act as solid support if tested from above. It’s a classic chart pattern we always look for.
o This entire zone is definitely a critical area to watch if price starts correcting. A strong bounce from here would keep the bullish structure perfectly intact, but a break below it would signal a deeper correction.
• Point of Control (2900 to 3000): This broader grey zone, with the orange line highlighting the exact Point of Control (POC), tells us where the most trading volume occurred over this period (check out the Volume Profile on the left). It's a high-liquidity zone, meaning a lot of buyers and sellers found agreement there in the past. If Gold were to see a more significant correction, this area would likely offer very robust support, simply because so many market participants have a vested interest at these levels.
Volume Profile:
• Glancing at the volume profile on the left, it neatly shows us where the trading action has been heaviest. The big hump around 2900-3000, marked as the "Point of Control," really emphasizes just how important that support area is. What's interesting is the relatively lower volume as we've moved higher, suggesting less resistance on the way up. But if we fall back towards the POC, expect to see trading activity really pick up again.
Price Action & Candlestick Patterns:
• The candlestick patterns consistently show powerful bullish pushes followed by more measured pullbacks. Right now, near the All-Time Resistance, we're seeing some consolidation or perhaps a bit of indecision. The bulls are certainly trying to push through, but they're clearly meeting some stiff resistance.
• That "$" label near the trendline? That often points to areas where liquidity, like clusters of stop-losses or pending orders, might have been "swept" by larger players – a concept often discussed in Smart Money Concepts (SMC).
________________________________________
Fundamental Factors & Macro Impact:
This strong, persistent bullish trend in Gold isn't just random; it's being supercharged by a mix of powerful fundamental and macroeconomic forces:
1. Safe-Haven Demand:
o Geopolitical Tensions: Look around the world – ongoing conflicts like the Russia-Ukraine war and Middle East tensions, plus general geopolitical instability, are sending investors straight to safe havens like gold. It's seen as the ultimate store of value when the world feels unpredictable.
o Economic Uncertainty: There’s a lingering sense of unease about the global economy, whispers of potential recessions, and general market volatility. All of this naturally increases gold's appeal.
o Banking Sector Stability: Any fresh concerns about the health of the financial system or regional banking troubles can instantly boost gold's allure as a secure asset.
2. Inflation Hedge:
o While inflation has eased a bit from its peak, it's still proving quite stubborn in many major economies, higher than what central banks would prefer. Gold has a long history as a reliable hedge against inflation; it tends to hold its value or even increase when fiat currencies lose purchasing power.
3. Central Bank Buying Spree:
o This is a massive, often under-appreciated, driver. Central banks, especially those in emerging markets, have been aggressively buying gold. They're looking to diversify their foreign exchange reserves away from the US Dollar, reduce their reliance on Western financial systems, and simply add another layer of protection against global risks. This consistent, institutional demand provides a very strong underlying bid for gold.
4. Interest Rate Expectations & US Dollar Weakness:
o Federal Reserve Policy: Gold typically moves in the opposite direction of real (inflation-adjusted) interest rates and the strength of the US Dollar.
o Rate Cut Anticipation: Markets are increasingly pricing in interest rate cuts from the Federal Reserve and other major central banks. When interest rates are expected to fall, holding non-yielding gold becomes much more attractive compared to assets that pay less interest. The opportunity cost of gold goes down.
o Weaker US Dollar: A softer US Dollar makes gold cheaper for anyone holding other currencies, which naturally boosts demand. Persistent concerns about the US national debt and fiscal health can also put pressure on the dollar, thereby supporting gold.
5. Global De-dollarization Efforts:
o This also supports in terms of De-dollarization or reducing the country’s dependence on the US Dollar for international trade and as a reserve currency. Gold plays a significant role in this strategic shift, adding another layer to its demand.
________________________________________
Conclusion & Outlook:
Gold (XAUUSD) is absolutely in a powerful, well-established bullish trend, having racked up some impressive gains since late 2024. Right now, it's staring down its "All Time Resistance" at 3,500 – a truly critical moment.
• Bullish Scenario: If we see a decisive breakout and a sustained close above 3,500, it would confirm incredibly strong bullish momentum. This could easily lead to a swift move into new, uncharted territories. We'd expect this to be fueled by ongoing safe-haven demand, continued aggressive central bank buying, and/or growing conviction that significant rate cuts are on the horizon.
• Correction Scenario: On the flip side, a strong rejection from that 3,500 resistance could trigger a correction. We'd likely see it head back towards the trendline support, and possibly even that "Fibonacci Golden Level + Breakout Retest Level" zone (3117-3167). As long as these key support levels hold firm, the overall bullish structure stays perfectly intact. However, a clear break below that golden zone would signal a deeper pullback, with the "Point of Control" (2900-3000) waiting as the ultimate strong support.
From a fundamental perspective, the broader macroeconomic landscape – thinking about geopolitical tensions, persistent inflation concerns, the insatiable central bank demand, and the future path of monetary policy – continues to lean very much in gold's favor. Going forward, traders and investors will be keeping a very close eye on central bank statements, inflation reports, and any new geopolitical developments for the next big cues on Gold's direction.
Disclaimer:
The information provided in this chart is for educational and informational purposes only and should not be considered as investment advice. Trading and investing involve substantial risk and are not suitable for every investor. You should carefully consider your financial situation and consult with a financial advisor before making any investment decisions. The creator of this chart does not guarantee any specific outcome or profit and is not responsible for any losses incurred as a result of using this information. Past performance is not indicative of future results. Use this information at your own risk. This chart has been created for my own improvement in Trading and Investment Analysis. Please do your own analysis before any investments.


American Airlines Stock Chart Fibonacci Analysis 061625Trading Idea
1) Find a FIBO slingshot
2) Check FIBO 61.80% level
3) Entry Point > 10.6/61.80%
Chart time frame:B
A) 15 min(1W-3M)
B) 1 hr(3M-6M)
C) 4 hr(6M-1year)
D) 1 day(1-3years)
Stock progress:A
A) Keep rising over 61.80% resistance
B) 61.80% resistance
C) 61.80% support
D) Hit the bottom
E) Hit the top
Stocks rise as they rise from support and fall from resistance. Our goal is to find a low support point and enter. It can be referred to as buying at the pullback point. The pullback point can be found with a Fibonacci extension of 61.80%. This is a step to find entry level. 1) Find a triangle (Fibonacci Speed Fan Line) that connects the high (resistance) and low (support) points of the stock in progress, where it is continuously expressed as a Slingshot, 2) and create a Fibonacci extension level for the first rising wave from the start point of slingshot pattern.
When the current price goes over 61.80% level , that can be a good entry point, especially if the SMA 100 and 200 curves are gathered together at 61.80%, it is a very good entry point.
As a great help, tradingview provides these Fibonacci speed fan lines and extension levels with ease. So if you use the Fibonacci fan line, the extension level, and the SMA 100/200 curve well, you can find an entry point for the stock market. At least you have to enter at this low point to avoid trading failure, and if you are skilled at entering this low point, with fibonacci6180 technique, your reading skill to chart will be greatly improved.
If you want to do day trading, please set the time frame to 5 minutes or 15 minutes, and you will see many of the low point of rising stocks.
If want to prefer long term range trading, you can set the time frame to 1 hr or 1 day.

Ethereum Wave Analysis – 16 June 2025
- Ethereum moving inside sideways price range
- Likely to rise to the resistance level 2754.00
Ethereum cryptocurrency recently reversed up from the support zone between the support level 2435,00 (lower border of the active narrow sideways price range from May), lower daily Bollinger Band and the 38.2% Fibonacci correction of the upward impulse from May.
The upward reversal from this support zone continues the active minor impulse wave 3 of the intermediate impulse wave (3) from last month.
Ethereum can be expected to rise to the next resistance level 2754.00 (upper border of the active sideways price range).

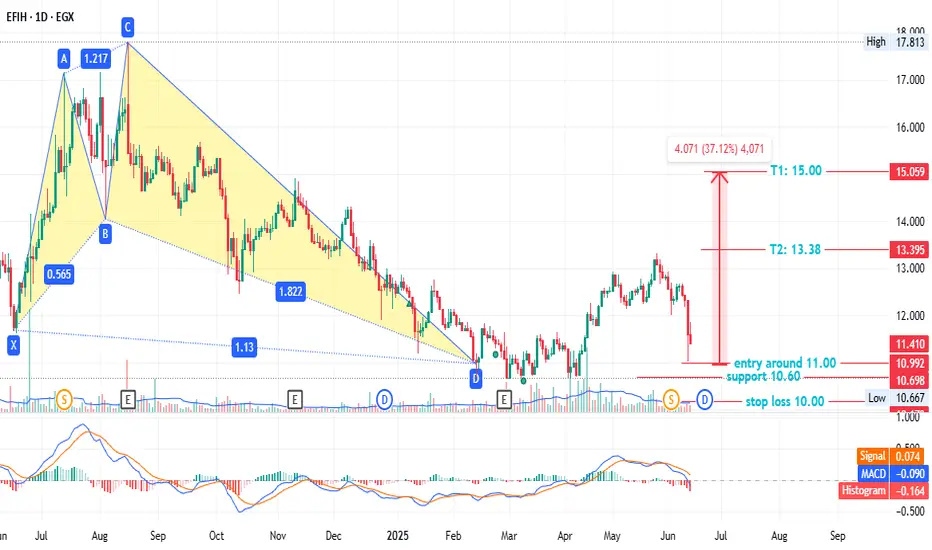
EFIH - anther chance - low risk EGX:EFIH - 1-Day Timeframe
A bullish pattern emerged on Feb 13, but prices adjusted after the 3/2 stock split on Jun 02. Key levels:
- Entry: ~11.00
- Stop loss: 10.00 (7.00% loss)
- Support: 10.60 (6-month low)
- Targets:
- T1: 13.38 (22.24% profit)
- T2: 15.00 (37.12% profit)
This is not investment advice—only my analysis based on chart data. Consult your account manager before investing. Good luck!
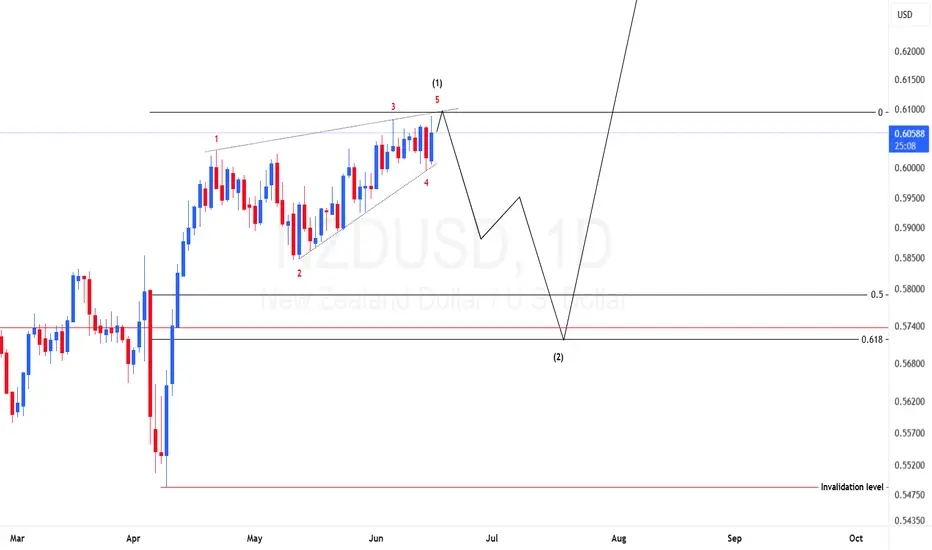
NZDUSD Elliotwaves CountPrice have unfolded the leading diagonal structure and we have seen signs of bullish weakness. If we are correct we should expect price to drop to at least the golden zone before resuming the bullish momentum.
XAUUSD Elliotwaves update: Is wave 4 complete?On our previous view we were expecting a wave c to the upside that will complete wave B of higher degree. It looks like wave B is completed with an ending diagonal. Now what I am anticipating is price to drop to complete wave 4 in higher degree. However, if wave 4 is complete then the move up might be a leading diagonal for wave 1 of 5. But all in all the the current bias is to the downside and therefore to take advantage of the move to the downside one should find areas where price will find resistance for a possible sell opportunity.
