Ethereum & monthly 20MAEthereum is gaining strength and will likely break above the monthly 20 MA. Will it maintain this momentum by month's end and remain bullish in the coming months?
Good luck HODLRS ✌️🤞
Fibonacci

GBPCAD - Looking To Sell Pullbacks In The Short TermH1 - Strong bearish move.
No opposite signs.
Expecting further continuation lower until the two Fibonacci resistance zones hold.
If you enjoy this idea, don’t forget to LIKE 👍, FOLLOW ✅, SHARE 🙌, and COMMENT ✍! Drop your thoughts and charts below to keep the discussion going. Your support helps keep this content free and reach more people! 🚀
--------------------------------------------------------------------------------------------------------------------

SUI Next Upside Target🚀 After holding above the April low and completing a 3-wave pullback in wave (2), CRYPTO:SUIUSD is now advancing in a potential wave (3).
Momentum is building, and the next upside target lies in the equal legs zone at $4.80 – $5.40, which could eventually lead to a new all-time high.

BTC about to cum?Just a reminder: These monthly candles may appear small, but they're all green for now. This doesn't look bearish; it looks like a buildup before an explosion.

GBP/USD Poised for Fifth Daily Decline- Support in ViewThe Sterling rally failed to close above confluent trend resistance at the 2022 high near 1.3749 with GBP/USD now off more than 1.8% from the monthly / yearly high. The July opening-range seems set here at 1.3530-1.3750 and the focus is on a breakout in the days ahead with the broader outlook still constructive while within this formation.
GBP/USD is testing support today at the 61.8% retracement of the late-June advance at 1.3530 with the weekly opening-range preserved just above. Initial resistance eyed along this short-term channel with breach above the objective weekly open at 1.3645 needed to shift the focus back towards the 2022 high at 1.3749- a daily close above this level is still needed to mark uptrend resumption. Subsequent resistance objective eyed at the 100% extension of the January advance at 1.3816 and the 61.8% extension of the broader 2022 advance at 1.4003.
A break lower exposes key support at the 61.8% retracement of the May rally / 2024 high-day close (HDC) at 1.3388-1.3415. A break / close below this slope would suggest a more significant high was registered last week / a larger reversal is underway with initial support seen at the May low-day close (LDC) at 1.3176.
Bottom line: A reversal from trend resistance threatens a larger correction within the broader GBP/USD uptrend. The immediate focus is on a breakout of the weekly opening-range for guidance. From a trading standpoint, losses would need to be limited to 1.3388 IF Sterling is heading higher on this stretch with a close above 1.3749 ultimately needed to mark uptrend resumption.
-MB

NQ Power Range Report with FIB Ext - 7/10/2025 SessionNQ Power Range Report with FIB Ext - 7/10/2025 Session
CME_MINI:NQU2025
- PR High: 23065.25
- PR Low: 23033.25
- NZ Spread: 71.5
Key scheduled economic events:
08:30 | Initial Jobless Claims
13:00 | 30-Year Bond Auction
Session Open Stats (As of 12:35 AM 7/10)
- Session Open ATR: 300.61
- Volume: 20K
- Open Int: 270K
- Trend Grade: Neutral
- From BA ATH: -0.4% (Rounded)
Key Levels (Rounded - Think of these as ranges)
- Long: 23239
- Mid: 21525
- Short: 20383
Keep in mind this is not speculation or a prediction. Only a report of the Power Range with Fib extensions for target hunting. Do your DD! You determine your risk tolerance. You are fully capable of making your own decisions.
BA: Back Adjusted
BuZ/BeZ: Bull Zone / Bear Zone
NZ: Neutral Zone

AMSC eyes on $40.18: Golden Genesis fib holding up new ATHAMSC has been bobbing into a Golden Genesis fib at $40.18
Look for a Break-n-Retest to start next leg of uptrend.
Beware of a possible rejection for a high velocity dip.
.
Previous Analysis that gave a PERFECT SWING trade:
Hit the BOOST and FOLLOW for more such a PRECISE and TIMELY charts.
==============================================================
.

BA heads up into $230: Strong fib zone might cause a serious dipBA has been flying (lol) from its last crash caused crash.
About to test a signrificant resistance at $229.82-230.73
Expect at least some "orbits" or a pullback from this zone.
.
Previous analysis that caught THE BOTTOM:
==================================================
.

MOG Bullish Acceleration in ProgressCRYPTO:MOGUSD is currently experiencing the anticipated acceleration in wave (3)—typically the strongest and most impulsive leg in an Elliott Wave cycle.
With momentum building, the next upside target aligns with the 100% Fibonacci extension, which could propel price toward new highs if the structure holds.
Wave (3) is doing what it does best: leading the charge.

IBKR watch $57.42-58:19: Double Golden Fib zone holding in OrbitIBKR has been in a strong uptrend but now consolidating.
Currently orbiting a Double Golden zone $57.42-58.19
This could be a TOP or a ReCharge zone for next leg.

TSLA eyes on $294: Key Support for bulls to hold or face $253TSLA oscillating all over the place thanks to Musk moves.
Currently testing a key support zone $293.96-294.32.
Loss of this floor opens the Golden Genesis at $253.57
See "Related Publications" for previous charts ------------>>>>>>

Is the Trend Intact? Key Signal Emerging on GER40 4H ChartHey Guys,
We could see a pullback on the GER40 index from the 24,060 level. If that happens, the 23,824 – 23,675 zone could present a potential buying opportunity. The primary trend still points upward, and bullish momentum remains intact.
Also worth noting—the rise in volume is quite striking, which supports my target level of 24,500.
I meticulously prepare these analyses for you, and I sincerely appreciate your support through likes. Every like from you is my biggest motivation to continue sharing my analyses.
I’m truly grateful for each of you—love to all my followers💙💙💙

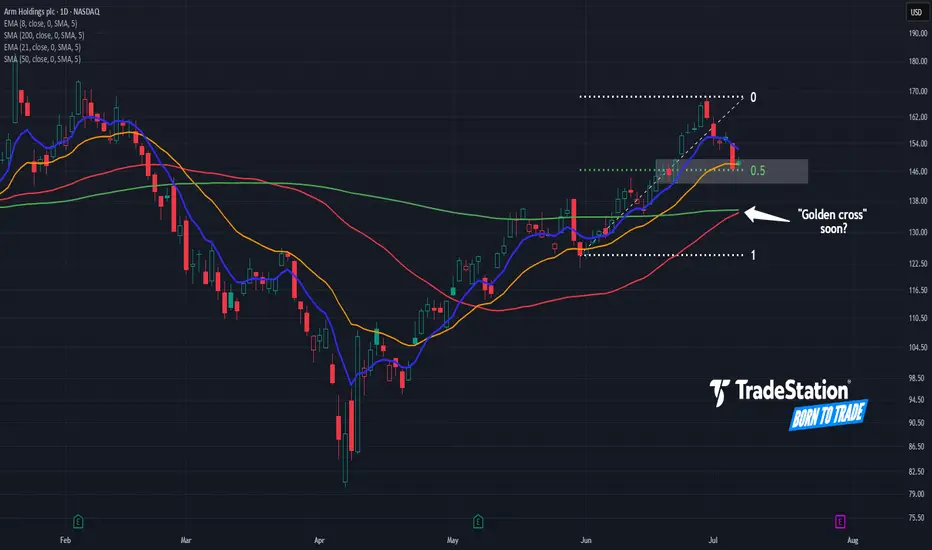
Arm Pulls BackArm Holdings rallied sharply last month, and now the AI chip stock has pulled back.
The first pattern on today’s chart is the advance from May 30 through June 30. ARM retraced half that move and is trying to bounce, which may confirm its upward direction.
Second, prices have retested their rising 21-day exponential moving average (EMA). The 8-day EMA is also above the 21-day EMA. Those signals may be consistent with short-term bullishness.
Third, the 50-day simple moving average (SMA) is nearing a potential “golden cross” above the 200-day SMA. That could reflect longer-term bullishness.
Finally, a four-session consolidation zone formed in late June between roughly $143 and $149. Will it now emerge as new support?
Check out TradingView's The Leap competition sponsored by TradeStation.
TradeStation has, for decades, advanced the trading industry, providing access to stocks, options and futures. If you're born to trade, we could be for you. See our Overview for more.
Past performance, whether actual or indicated by historical tests of strategies, is no guarantee of future performance or success. There is a possibility that you may sustain a loss equal to or greater than your entire investment regardless of which asset class you trade (equities, options or futures); therefore, you should not invest or risk money that you cannot afford to lose. Online trading is not suitable for all investors. View the document titled Characteristics and Risks of Standardized Options at www.TradeStation.com . Before trading any asset class, customers must read the relevant risk disclosure statements on www.TradeStation.com . System access and trade placement and execution may be delayed or fail due to market volatility and volume, quote delays, system and software errors, Internet traffic, outages and other factors.
Securities and futures trading is offered to self-directed customers by TradeStation Securities, Inc., a broker-dealer registered with the Securities and Exchange Commission and a futures commission merchant licensed with the Commodity Futures Trading Commission). TradeStation Securities is a member of the Financial Industry Regulatory Authority, the National Futures Association, and a number of exchanges.
TradeStation Securities, Inc. and TradeStation Technologies, Inc. are each wholly owned subsidiaries of TradeStation Group, Inc., both operating, and providing products and services, under the TradeStation brand and trademark. When applying for, or purchasing, accounts, subscriptions, products and services, it is important that you know which company you will be dealing with. Visit www.TradeStation.com for further important information explaining what this means.
NASDAQ Potential DownsidesHey Traders, in today's trading session we are monitoring NAS100 for a selling opportunity around 22,750 zone, NASDAQ is trading in a downtrend and currently is in a correction phase in which it is approaching the trend at 22,750 support and resistance area.
Trade safe, Joe.

ADA | Trade-SetupOur trade worked out exactly as planned, and the price reacted perfectly from the 0.667 level, which also overlaps with the bearish target area (green).
✅First take profit was at the overall correction level (green).
Second take profit is when we reach the 100% correction mark at $0.611. At that point, I will secure most of my position and only let a small portion run.

Us30 Long Day Trade New York OpenIm looking for a long on the Us30 for a 1:3 min , im trade a long after a the retest due to the the trend has been bullish

AUD/USD Struggles at ResistanceAUD/USD is now nearly 1.6% off the highs with the weekly opening-range taking shape just below Fibonacci resistance- looking for a potential breakout in the days ahead.
A look at Aussie price action shows AUD/USD reversing pitchfork resistance with the weekly opening-range taking shape just below resistance at the 61.8% retracement of the 2024 decline / weekly open at 6550/53- looking for a reaction off this mark.
A top-side breach of the weekly opening-range exposes the upper parallel again, currently near ~6600. Ultimately, a close above the September low at 6622 is needed to fuel the next major leg of the advance with subsequent resistance objectives eyed at the 2019 low at 6671 and the 78.6% retracement near 6723.
Initial support rests with the June low-day close (LDC) at 6458- note that the 75% parallel converges on this threshold into the close of the week and a break / close below would threaten a larger Aussie pullback. Subsequent support objectives rest at the 200-day moving average (currently ~6411) and 6332/62- a region defined by the 38.2% retracement of the yearly range, the April / August 2024 lows, and the May swing low. Losses beyond this threshold would suggest a more significant high is in place / larger reversal is underway.
Bottom line: The Aussie rally failed into the trendline resistance with the monthly opening-range taking shape just below. While the broader outlook is still constructive, the advance remains vulnerable here and the immediate focus is on a breakout of the weekly range (6486-6553) for guidance. From a trading standpoint, losses would need to be limited to 6458 IF Aussie is heading for a breakout on this stretch with a close above 6622 needed to mark uptrend resumption.
-MB

NQ Power Range Report with FIB Ext - 7/9/2025 SessionCME_MINI:NQU2025
- PR High: 22923.00
- PR Low: 22900.50
- NZ Spread: 50.5
Key scheduled economic events:
10:30 | Crude Oil Inventories
13:00 | 10-Year Note Auction
14:00 | FOMC Meeting Minutes
Session Open Stats (As of 12:25 AM 7/9)
- Session Open ATR: 303.33
- Volume: 16K
- Open Int: 270K
- Trend Grade: Neutral
- From BA ATH: -0.8% (Rounded)
Key Levels (Rounded - Think of these as ranges)
- Long: 23239
- Mid: 21525
- Short: 20383
Keep in mind this is not speculation or a prediction. Only a report of the Power Range with Fib extensions for target hunting. Do your DD! You determine your risk tolerance. You are fully capable of making your own decisions.
BA: Back Adjusted
BuZ/BeZ: Bull Zone / Bear Zone
NZ: Neutral Zone

PEPEUSD going to moon according to my analysis. {08/june/2025}Educational Analysis says that PEPEUSD may give trend Trading opportunities from this range, according to my technical analysis.
Broker - binance
So, my analysis is based on a top-down approach from weekly to trend range to internal trend range.
So my analysis comprises of two structures: 1) Break of structure on weekly range and 2) Trading Range to fill the remaining fair value gap
Let's see what this pair brings to the table for us in the future.
Please check the comment section to see how this turned out.
DISCLAIMER:-
This is not an entry signal. THIS IS FOR EDUCATIONAL PURPOSES ONLY.
I HAVE NO CONCERNS WITH YOUR PROFIT OR LOSS,
Happy Trading, Fx Dollars.

BullsSince hitting 3360+ Gold has formed a channel(flag) on which it has been declining on. Main goal is the 71 -79 retracement region before we get back to buys towards new all time highs.
Currently we at the lower end of the channel giving a buy opportunity towards the 1hr FVG @3325-3330 where we will also look for more sells and target 3280 -3274 (the 71 -79 retracement region).
NB don't force the market and watchout for major news

Gold Setup for longs and shorts This video covers gold on the local range whereby I expect price to eventually complete the move to the downside and clear the equal lows from MAy and June as well as take care of the poor lows and fill Quart Pivots .
I talk also about the Tradingview session volume profile chart and how this feature can really be a simple yet powerful guide for taking scalp trades off of specific levels and I show a couple of examples of the respect PA has for hitting those daily POC .
I Welcome any questions you may have

gold long viewbuy gold now regret later.. here my view bullish flag for gold.. Now market react on fresh zone 4h. Careful if breakout below.

Gold’s Bullish Range Holds – Is This the Dip to Buy?With tensions easing in the Middle East and risk appetite moderating, gold has settled into a bullish daily range. The metal recently broke a key high, confirming its upward momentum, but now appears to be consolidating. The central question is whether gold will break lower for a deeper correction or whether this is merely a pause before the next leg higher.
Reduced geopolitical risk has tempered the “risk-on” rally in gold, but the metal remains firmly within a bullish daily range. This indicates that the underlying bid has not disappeared—only short-term speculative flows have adjusted.
Gold recently breached a protected high—likely a higher high or significant resistance level—reinforcing the prevailing bullish momentum. A pullback into imbalance or demand zones is anticipated; however, if a catalyst emerges, price could resume its advance from current levels, with the 0.328 Fibonacci retracement acting as a strong support.
Meanwhile, the DXY is exhibiting signs of a pullback but lacks the fundamental drivers necessary to sustain a broader rally.
