EURUSD IdeaHere we are waiting for the price to come to our supply zone at 1.16117-1.16344 from where we may enter sell according to the required market structure form .
i will provide the confirmation in thegroup before i place my order .
Please follow to support me !
Fibonacci

$ORCL Overextended After Hitting 423.6% Fib ExpansionOracle had a post earnings run up not ever seen before in the Companies history. As of now price has moved up nearly ~$100 since the April 8th lows, and now sit at the 423.6% expansion level off a 78.6% retracement. Time to look for Oracle to come in.

Oil (WTI) – Geo-Political Concerns Drive SentimentA quickly escalating conflict in the Middle East between Israel and Iran has seen Oil (WTI) volatility increase dramatically as the focus for traders has shifted overnight from worries about an on-going lack of demand due to a slowing global economy over to major supply concerns moving forward from this oil rich region.
This shift has seen Oil trade from lows of 60.17 on May 30th, to an early Monday high of 76.31, as weekend attacks by Israel on Iran's energy infrastructure introduced more uncertainty at the start of this new trading week regarding Israel's future strategy in this conflict. Prices have since settled down and moved back towards 72.80 (0830 BST) at time of writing but looking forward traders may need to balance the potential for further escalation/duration of this conflict against extra Oil production/supply from OPEC+ and the US.
Also important for Oil prices across the week could be the outcome of the Federal Reserve (Fed) Interest Rate Decision (Wed 1900 BST) and Press Conference (Wed 1930 BST). No change to interest rates is expected, but the updates from Fed policymakers to their inflation and interest rate expectations for the rest of 2025 could have a major impact on risk sentiment, the dollar and anticipated Oil demand.
Technical Update: Utilising Bollinger Bands
A rise in tensions in the Middle East last week prompted a sharp acceleration higher in the price of Oil. This saw price volatility increase, reflected by the widening upper and lower Bollinger bands and prices trading to levels last seen in late January 2025, as the chart below shows.
Traders will now likely be wondering if this type of price strength can continue, or if prices can enter a correction phase, even possibly a more extended period of price weakness.
Much will clearly depend on future market sentiment and price trends, and on any easing or escalation in geo-political tensions. However, with this in mind let's consider what may be the relevant support and resistance levels .
Potential Resistance Levels:
As the chart shows below, interestingly, last weeks price strength stalled against 75.99, which is equal to the February 3rd session high and with a setback in price developing from it so far today, this might be viewed by some as a potential first resistance.
As such, while not a guarantee of further price strength, closing breaks above 75.99 may be a sign of continued upside momentum towards 81.01, which is the January 15th price high and a potential next resistance focus for traders.
Potential Support Levels:
After such a strong advance in price, it might be harder to establish support levels, although, Fibonacci retracement levels on the recent May 30th to June 16th upside move in price, might prove useful. These retracement levels are highlighted on the chart below.
The 38.2% Fibonacci retracement of the price strength stands at 70.12 and this might prove to be a possible first support focus, if price weakness is seen over coming days. Closing breaks below 70.12, if seen, may then lead to declines towards 66.32, the deeper 61.8% Fibonacci retracement level.
The material provided here has not been prepared
accordance with legal requirements designed to promote the independence of investment research and as such is considered to be a marketing communication. Whilst it is not subject to any prohibition on dealing ahead of the dissemination of investment research, we will not seek to take any advantage before providing it to our clients.
Pepperstone doesn’t represent that the material provided here is accurate, current or complete, and therefore shouldn’t be relied upon as such. The information, whether from a third party or not, isn’t to be considered as a recommendation; or an offer to buy or sell; or the solicitation of an offer to buy or sell any security, financial product or instrument; or to participate in any particular trading strategy. It does not take into account readers’ financial situation or investment objectives. We advise any readers of this content to seek their own advice. Without the approval of Pepperstone, reproduction or redistribution of this information isn’t permitted.

OKLO eyes on $72.37: Golden Genesis fib that should give a DIP OKLO going nuclear into a Golden Genesis fib at $72.37
Looking for a Dip-to-Fib or a Break-n-Retest new longs.
Most likely a few orbits around this ultra-high gravity fib.
.
Last Plot caught break and sister Genesis Fib
.
Older Plot caught the perfect Dip-to-Fib buys:
.
Hit the BOOST and FOLLOW to catch more such EXACT trades.
=======================================================

KAYNES | Buy @LTP | SL below 5000 | Targets 6250, 6835, 7760Disclaimer:
This is not financial advice. Please do your own research or consult with a financial advisor before making any investment decisions. Investments in stocks can be risky and may result in loss of capital.

gold for long 30m*The content on this analysis is subject to change at any time without notice, and is provided for the sole purpose of assisting traders to make independent investment decisions.

btc for long 30m*The content on this analysis is subject to change at any time without notice, and is provided for the sole purpose of assisting traders to make independent investment decisions.

dxy for short 30m*The content on this analysis is subject to change at any time without notice, and is provided for the sole purpose of assisting traders to make independent investment decisions.

EURUSD 4H: Bullish Trend & Key Support TestChart Overview:
The EURUSD 4-hour chart displays a clear bullish bias, trading within a well-defined ascending channel. After making new highs, price is now retracing to test crucial support, presenting a potential trend continuation opportunity.
Trend & Structure:
Since April, EURUSD has maintained a strong uptrend, consistently respecting an ascending channel. An early May correction saw an "internal break," but a subsequent "MSS" (Market Structure Shift) confirmed the bullish trend's resumption, pushing price to a new local high at 1.16321 and above.
Current Price Action & Immediate Support:
Price is currently undergoing a healthy retracement from its recent peak. The primary focus is the "Immediate Support Area" between 1.14416 and 1.14663. This zone is significant due to a confluence of factors:
The 0.5 & 0.618(Golden Ratio) and 0.71 Fibonacci retracement levels of the latest bullish swing.
Prior resistance that has potentially flipped into support. The lower boundary of the overarching ascending channel. Below this, a "Key Level" around 1.1100-1.1150 is identified as a deeper, secondary support.
Potential Scenarios & Outlook:
Bullish Continuation: A strong bounce and confirmation from the "Immediate Support Area" would signal renewed buying pressure. This would likely see price target the recent high (1.16321) and the upper channel boundary, resuming the uptrend.
Bearish Rejection: A decisive break down below the "Immediate Support Area" and the ascending channel's lower boundary would invalidate the immediate bullish setup, potentially leading to a test of the "Key Level."
Conclusion:
EURUSD is at a pivotal point within its ongoing bullish trend. Traders should closely monitor price action at the "Immediate Support Area." A successful hold and rebound here would reinforce the bullish outlook, while a clear break below would warrant caution and re-evaluation.
Disclaimer:
The information provided in this chart is for educational and informational purposes only and should not be considered as investment advice. Trading and investing involve substantial risk and are not suitable for every investor. You should carefully consider your financial situation and consult with a financial advisor before making any investment decisions. The creator of this chart does not guarantee any specific outcome or profit and is not responsible for any losses incurred as a result of using this information. Past performance is not indicative of future results. Use this information at your own risk. This chart has been created for my own improvement in Trading and Investment Analysis. Please do your own analysis before any investments.

Beyond the News: Why I Trust the Charts When Trading GoldBased on the current structure, I believe gold is in the fifth wave of a larger Elliott Wave formation. On the higher time frame, the price action appears to be contained within a channel that resembles a leading diagonal pattern—where Wave 1 is typically the longest. From this perspective, I anticipate a potential retracement to the 0.618 Fibonacci level of the most recent upward move, or a test of the lower boundary of the channel before a reversal may occur.
My trading plan involves two potential entry strategies:
Enter at the 0.618 Fib retracement with a stop-loss set near the 0.881 level.
Wait for a bounce off the lower channel, followed by a pullback and a breakout above the start of the pullback before entering the position.
While no trader can be right all the time, having a structured plan with predefined take-profit and stop-loss levels is key to effective risk management and long-term survival in the markets.
Why I Favor Technical Over Fundamental Analysis
For those wondering why I rely more on technical analysis—especially Elliott Wave Theory—over fundamental news, here’s my reasoning:
I’ve found that news and earnings-based trades often behave irrationally. A company may report strong earnings and guidance, only to see its stock sell off, fake a rally the next day, and then sell off again. Conversely, a company with poor earnings may drop ahead of the report, only to rally immediately after. These inconsistencies made it difficult to build a reliable strategy based solely on fundamental data.
Over time, I observed that despite news events, the market often completes its technical structure—such as Elliott Wave formations and Fibonacci cycles—before fully reacting to news. In these cases, fundamental developments tend to accelerate or confirm the direction already implied by the technical setup, rather than override it.
Gold is no exception. While it's common to assume that the S&P 500 (ES) and gold move in opposite directions due to risk-on/risk-off dynamics, I’ve noticed that they can trend in the same direction when their respective Elliott Wave structures align. This doesn't eliminate the inverse correlation concept entirely, but it highlights the importance of integrating technical analysis into a fundamentally driven view for more precise entries and exits.
Ultimately, I view fundamentals as the fuel, and technicals as the engine that defines the path.

GOLD UPDATE .......Hello Traders, here is the full analysis for this pair,
let me know in the comment section below if you have any questions,
the entry will be taken only if all rules of the strategies will be
satisfied. I suggest you keep this pair on your watch list and see if
the rules of your strategy are satisfied.
Dear Traders,
If you like this idea, do not forget to support it with a like and follow.
PLZ! LIKE COMMAND AND SUBSCRIBE

USDCHF → Retesting resistance will lead to a declineFX:USDCHF , having failed to reach its global target after breaking through support, is turning back to retest the zone of interest at 0.8157. A fall in the dollar could trigger a decline in prices...
After breaking through support and falling to 0.8055, a correction is forming towards the zone of interest and liquidity at 0.8157. After reaching the local target, the price may return to the global target (liquidity zone) at 0.8042.
The dollar returned to its downward phase at the opening of the session, to which the forex market reacted accordingly. Most likely, bearish pressure may also affect the USDCHF currency pair, which continues to follow the downward trend.
Resistance levels: 0.8157
Support levels: 0.8055, 0.8042
A retest of resistance amid high volatility could form a false breakout (liquidity capture) before the decline continues within the downtrend.
Best regards, R. Linda!

EURJPY ANALYSISAfter seeing the previous weekly candle close bullish, and the daily and 4hr showing bullish structure and a continuation to the upside, a quick pullback is expected for this pair before a further long as the pair is currently at a HH area

GBPUSD ANALYSISAfter seeing the previous weekly candle close bullish, and the structure on the daily and 4hr timeframes all pointing to a bullish trend we could expect the market to make a new leg to the upside.

NQ Power Range Report with FIB Ext - 6/16/2025 SessionCME_MINI:NQU2025
- PR High: 21903.75
- PR Low: 21726.00
- NZ Spread: 396.75
No key scheduled economic events
Contract rollover week
Session Open Stats (As of 12:15 AM 6/16)
- Session Open ATR: 382.14
- Volume: 18K
- Open Int: 62K
- Trend Grade: Neutral
- From BA ATH: -4.1% (Rounded)
Key Levels (Rounded - Think of these as ranges)
- Long: 22096
- Mid: 20383
- Short: 19246
Keep in mind this is not speculation or a prediction. Only a report of the Power Range with Fib extensions for target hunting. Do your DD! You determine your risk tolerance. You are fully capable of making your own decisions.
BA: Back Adjusted
BuZ/BeZ: Bull Zone / Bear Zone
NZ: Neutral Zone

Interesting times aheadThis charts depicts recent but also old price action.
Waiting to see weekly close, and also the next week reaction of news.
Keep in mind that this is not financial advice!
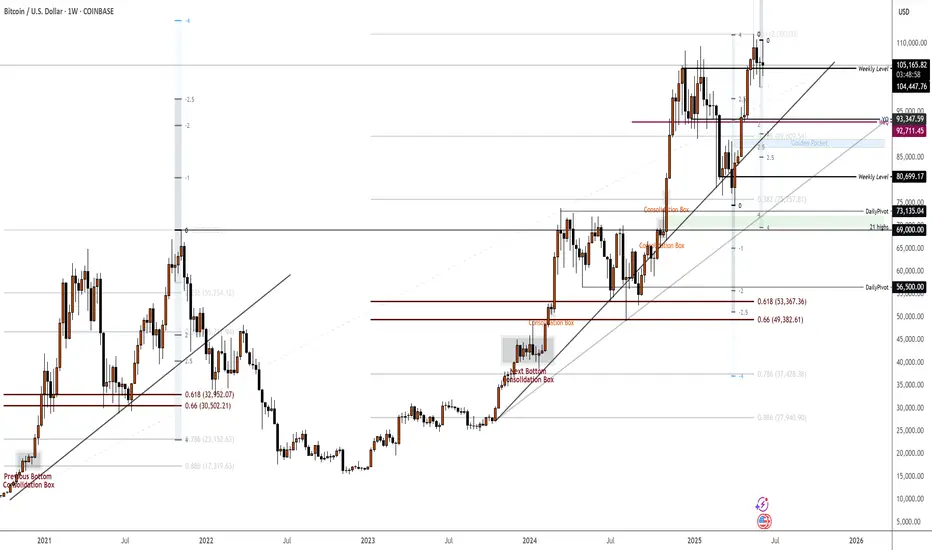
BTC July/August Top3 Drives Pattern (Mar 2024, Jan 2025)
Last Drive in July/August but leaning towards July
June 19th - 22nd for potential impulse
June 27th/28th for a local top into Early July Bottom | if Price is Bearish into these dates then Local Bottom
July 17th to 24th for Summer Top
Aug 3rd to 11th for a potential Local Bottom
Expected Top is 120k and up (Can be seen on Fibs) | 135k would be ideal

Macro enviornment effects on equities - Flat to Bearish The current macro-geopolitical environment presents several quantifiable bearish pressures on the Nasdaq. Housing markets are showing real signs of deterioration, with home listings in Florida and other regions down 15–20% from peak prices, and many individual properties seeing $100K+ price cuts—foreshadowing a broader 24–30% drawdown in real estate that could significantly erode consumer wealth and confidence. Labor market weakness is emerging beneath the surface, with rising layoffs in tech and new graduates facing difficulty securing jobs, even as the Fed is projected to cut rates twice by year-end. While disinflation supports policy easing, it is being outweighed by the drag from labor and housing stress. Geopolitically, the escalation risk in the Iran–Israel conflict introduces volatility and commodity price spikes, while the Ukraine war, though stagnating, remains unresolved. U.S. foreign policy appears increasingly erratic, adding further uncertainty premium. These elements combine to create a risk environment where upside in the Nasdaq is capped, and downside exposure remains
Flat to Bearish for the next 12 months, drawdown up to 25% to December 2021 high on NDX and support line during recent tariff crashes. long sustained drawdown would sustain for a while if we get into situations like housing collapse, or entering into a war, even indirectly like we did for Ukraine.
significant. NASDAQ:NDX NASDAQ:NDX NASDAQ:QQQ AMEX:SPY

EURJPY – Daily Chart selling zone alert |||||Price is approaching a major higher-timeframe supply zone near 168.000 – 172.000, an area historically respected by institutional sellers.
This zone aligns with a previous price rejection and a trendline resistance visible on a multi-year chart.
Expecting a possible liquidity grab into the zone followed by a sharp rejection.
---
🧠 Smart Money Insight:
Possible SMC-style reaction anticipated:
Liquidity inducement above highs
Sharp rejection from seller zone
BOS (Break of Structure) for confirmation
Right-side inset illustration highlights expected distribution before drop.
---
🔎 Key Technical Levels:
Supply Zone: 168.000 – 172.000
Current Price: 166.420
Target After Rejection: 150.000 – 148.000
Invalidation Above: 173.500
---
🧩 Trading Plan:
Wait for price action confirmation in the supply zone.
Look for M15/H1 shift in structure and strong bearish engulfing patterns.
Risk management is key: Place stop-loss above zone highs.

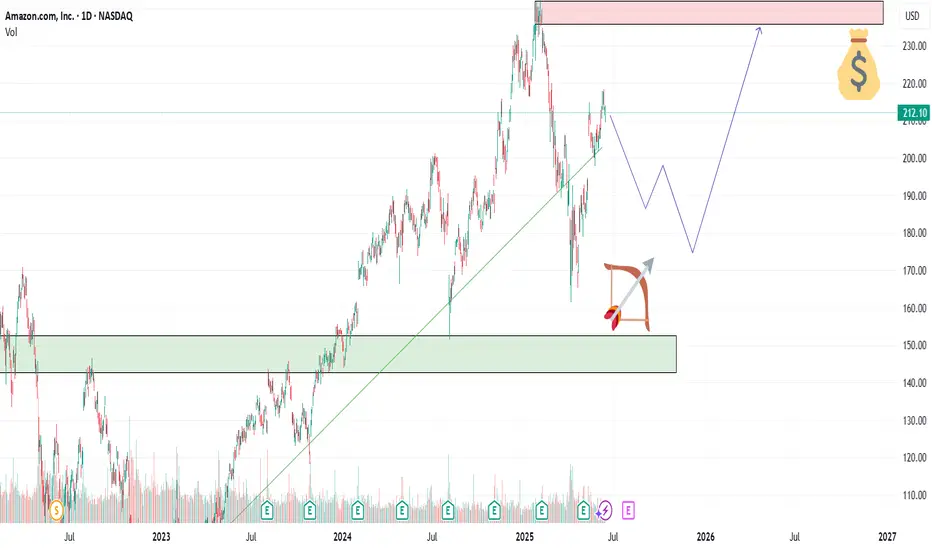
AMZN — Accumulation Zone or Just a Healthy Pullback?📦Amazon (AMZN) is offering an interesting opportunity after a healthy correction from its 2025 highs. With continued AWS expansion and aggressive investment in AI infrastructure, the fundamentals remain solid — but short-term volatility opens the door for strategic entries.
🎯 Entry Points
🔹 $194 – First key support, ideal for early buyers
🔹 $187 – Strong technical congestion zone
🔹 $169 – Deep value zone with higher risk/reward potential
💰 Profit Targets
✅ TP1: $210 – First resistance and psychological level
✅ TP2: $227 – Last swing high area
✅ TP3: $241+ – Full recovery path if momentum holds
🧠 Strategy Insight
This setup suits a swing trade horizon (30–60 days). Scaling into the position and adjusting stops under $160 offers a risk-managed approach. The upcoming earnings on July 31, 2025 could be the trigger for a major move — watch AWS growth numbers and forward guidance closely.
⚠️ Disclaimer: This analysis is for educational purposes only. It is not financial advice. Always do your own research and manage risk accordingly.
Gold weekly outlookFib zones for buys and sells as well as the regression trend channel.
I suspect Gold will reverse to the upside soon, possibly once the Gap is filled

BITCOIN TOPPED. ELLIOT WAVE LONG Long term outlook of Bitcoin using EWT. I personally think Bitcoin has topped and the btc.d charts support it as well as the actual chart shown here. We’re beggining the massive correction as it did way back and I kept the ratios the same so after wave C next year or whenever, we can all buy btc at around 30k and ride the next waves up.

IONQ - Is quantum computing worth investing for future?Hello Team,
Do you think Quatum Computer Stocks makes you Millioner :)
I will Publish some analysis for some Quantum Computer stocks today.
First one is IONQ:
All Quantum stocks are still so volatile but i see really good opportunities in daily bases for both side (Long / Short).
But i will make a daily chart analysis.
So , for the time being it is stucked between 41.50 to 37.00.
First resistent level is in 41.50 and support level 36.50 - 37.00.
Second resistant level is in 48.00 and i beleive that if it breaks this level and stay 3 days above this level it can reach the 56.00 soon.
If it goes down i think 32.00 - 32.50 level could be a good entry point.
My long term expectetion in One year maybe less it can be reach the 80.00 Level.
IONQ has made significant strides in scaling its quantum systems.
Lately They announced the acquisition of UK-based Oxford Ionics for approximately $1.1 billion.
Also IonQ and NVIDIA have partnered to advance hybrid quantum-classical computing. This collaboration integrates IonQ’s trapped-ion quantum processors with NVIDIA’s CUDA-Q platform, enabling powerful workflows that combine quantum and classical computation.
So i would like to be a early investor and beginning of this year i started increase my positions some Quatum computing stocks and IONQ is one of them.
This is just my thinking and it is not invesment suggestion , please do not make any decision with my anaylsis.
Have a lovely Sunday to all.
