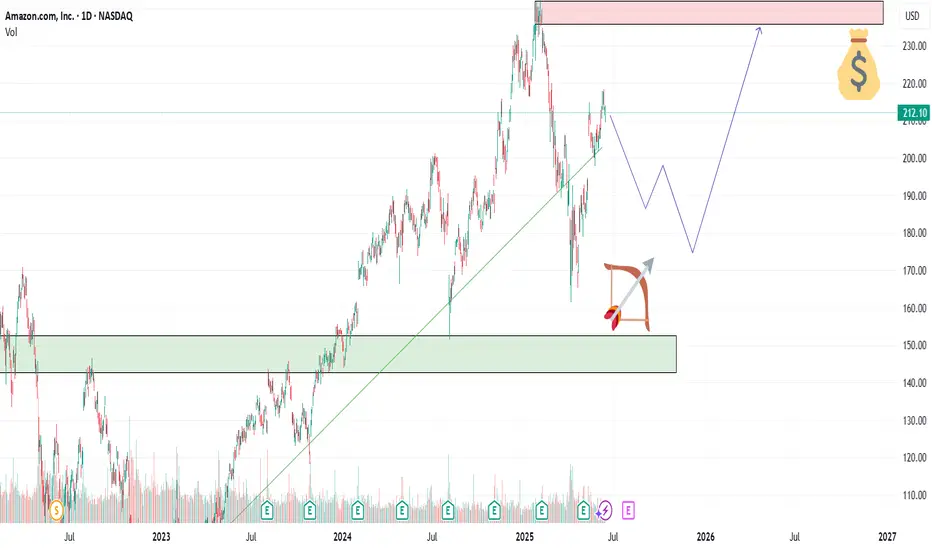
AMZN — Accumulation Zone or Just a Healthy Pullback?📦Amazon (AMZN) is offering an interesting opportunity after a healthy correction from its 2025 highs. With continued AWS expansion and aggressive investment in AI infrastructure, the fundamentals remain solid — but short-term volatility opens the door for strategic entries.
🎯 Entry Points
🔹 $194 – First key support, ideal for early buyers
🔹 $187 – Strong technical congestion zone
🔹 $169 – Deep value zone with higher risk/reward potential
💰 Profit Targets
✅ TP1: $210 – First resistance and psychological level
✅ TP2: $227 – Last swing high area
✅ TP3: $241+ – Full recovery path if momentum holds
🧠 Strategy Insight
This setup suits a swing trade horizon (30–60 days). Scaling into the position and adjusting stops under $160 offers a risk-managed approach. The upcoming earnings on July 31, 2025 could be the trigger for a major move — watch AWS growth numbers and forward guidance closely.
⚠️ Disclaimer: This analysis is for educational purposes only. It is not financial advice. Always do your own research and manage risk accordingly.
Fibonacci
Gold weekly outlookFib zones for buys and sells as well as the regression trend channel.
I suspect Gold will reverse to the upside soon, possibly once the Gap is filled

BITCOIN TOPPED. ELLIOT WAVE LONG Long term outlook of Bitcoin using EWT. I personally think Bitcoin has topped and the btc.d charts support it as well as the actual chart shown here. We’re beggining the massive correction as it did way back and I kept the ratios the same so after wave C next year or whenever, we can all buy btc at around 30k and ride the next waves up.

IONQ - Is quantum computing worth investing for future?Hello Team,
Do you think Quatum Computer Stocks makes you Millioner :)
I will Publish some analysis for some Quantum Computer stocks today.
First one is IONQ:
All Quantum stocks are still so volatile but i see really good opportunities in daily bases for both side (Long / Short).
But i will make a daily chart analysis.
So , for the time being it is stucked between 41.50 to 37.00.
First resistent level is in 41.50 and support level 36.50 - 37.00.
Second resistant level is in 48.00 and i beleive that if it breaks this level and stay 3 days above this level it can reach the 56.00 soon.
If it goes down i think 32.00 - 32.50 level could be a good entry point.
My long term expectetion in One year maybe less it can be reach the 80.00 Level.
IONQ has made significant strides in scaling its quantum systems.
Lately They announced the acquisition of UK-based Oxford Ionics for approximately $1.1 billion.
Also IonQ and NVIDIA have partnered to advance hybrid quantum-classical computing. This collaboration integrates IonQ’s trapped-ion quantum processors with NVIDIA’s CUDA-Q platform, enabling powerful workflows that combine quantum and classical computation.
So i would like to be a early investor and beginning of this year i started increase my positions some Quatum computing stocks and IONQ is one of them.
This is just my thinking and it is not invesment suggestion , please do not make any decision with my anaylsis.
Have a lovely Sunday to all.

AUDCAD trade ideea.The trend is bearish same as GBPCHF, head and shoulders panttern, now I am waiting for a retest of the neckline for me to enter the trade.

Gold (XAUUSD) Trading Setup – Mid-June 2025 Analysis🔰 Gold (XAUUSD) Trading Setup – Mid-June 2025 Analysis
This chart represents a strategic price action-based setup on Gold (CFDs on Gold – US$/Oz) using a 15-minute timeframe. It includes clearly defined entry zone, support/resistance levels, and profit-taking targets (TP1, TP2) for both bullish and bearish scenarios.
🔍 Current Market Context
Current Price: ~$3431.77
Structure: The price has been in an upward trend with a consolidation phase forming near the key mid-zone.
Highlighted Zone: A decision zone is marked in red (between ~$3422 and ~$3418), acting as the key liquidity zone or breakout area.
📈 Bullish Bias
If price breaks and holds above the red zone:
✅ TP1: $3480
✅ TP2: $3580
These levels act as short- to mid-term bullish targets based on projected extensions of recent upward momentum.
📉 Bearish Bias
If price breaks and holds below the red zone:
✅ TP1: $3320
✅ TP2: $3260
This indicates a possible reversal or correction phase, with targets derived from recent swing lows and support areas.
📌 Trading Notes
The blue shaded areas represent target zones for partial or full exits.
Red zone is the critical breakout decision point.
Ideal for breakout or pullback traders.
Can be combined with volume/confirmation indicators (e.g., RSI, MACD, or price action candles) for entry timing.

CL ready for new move upBased on time fib and Feigenbaum constants, CL is closing in on the bottom for this swing, expected within marked timezone. The swing highs/lows follows the Feigenbaum projections for the last few swings. I expect a dip below $57 before a new run higher, at least to $72-73.

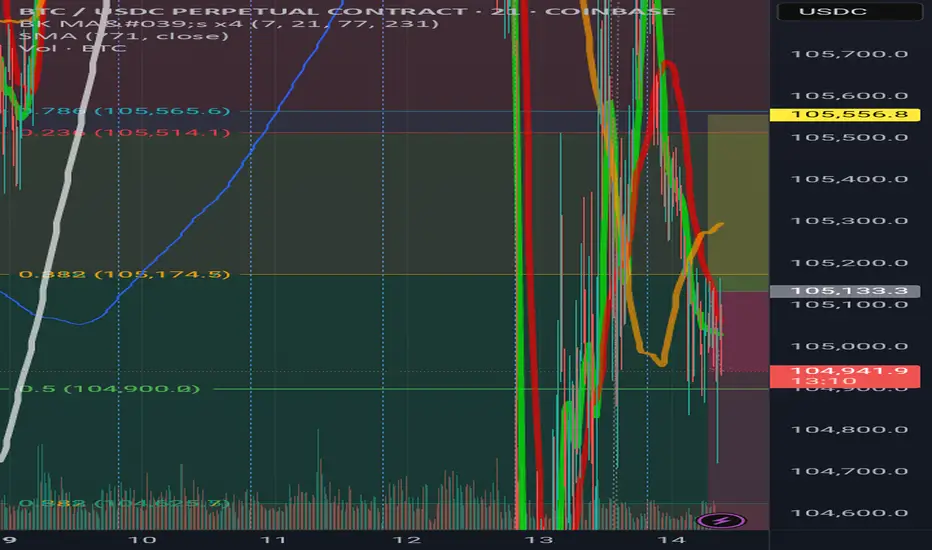
Is BTC already reversing?Bitcoin broke out above its downtrend line. A retest may happen, but the trend is broken.
DELEK US Stock Chart Fibonacci Analysis 061325Trading Idea
1) Find a FIBO slingshot
2) Check FIBO 61.80% level
3) Entry Point > 19.8/61.80%
Chart time frame:D
A) 15 min(1W-3M)
B) 1 hr(3M-6M)
C) 4 hr(6M-1year)
D) 1 day(1-3years)
Stock progress:A
A) Keep rising over 61.80% resistance
B) 61.80% resistance
C) 61.80% support
D) Hit the bottom
E) Hit the top
Stocks rise as they rise from support and fall from resistance. Our goal is to find a low support point and enter. It can be referred to as buying at the pullback point. The pullback point can be found with a Fibonacci extension of 61.80%. This is a step to find entry level. 1) Find a triangle (Fibonacci Speed Fan Line) that connects the high (resistance) and low (support) points of the stock in progress, where it is continuously expressed as a Slingshot, 2) and create a Fibonacci extension level for the first rising wave from the start point of slingshot pattern.
When the current price goes over 61.80% level , that can be a good entry point, especially if the SMA 100 and 200 curves are gathered together at 61.80%, it is a very good entry point.
As a great help, tradingview provides these Fibonacci speed fan lines and extension levels with ease. So if you use the Fibonacci fan line, the extension level, and the SMA 100/200 curve well, you can find an entry point for the stock market. At least you have to enter at this low point to avoid trading failure, and if you are skilled at entering this low point, with fibonacci6180 technique, your reading skill to chart will be greatly improved.
If you want to do day trading, please set the time frame to 5 minutes or 15 minutes, and you will see many of the low point of rising stocks.
If want to prefer long term range trading, you can set the time frame to 1 hr or 1 day.

VAALCO Stock Chart Fibonacci Analysis 061325Trading Idea
1) Find a FIBO slingshot
2) Check FIBO 61.80% level
3) Entry Point > 3.5/61.80%
Chart time frame:D
A) 15 min(1W-3M)
B) 1 hr(3M-6M)
C) 4 hr(6M-1year)
D) 1 day(1-3years)
Stock progress:A
A) Keep rising over 61.80% resistance
B) 61.80% resistance
C) 61.80% support
D) Hit the bottom
E) Hit the top
Stocks rise as they rise from support and fall from resistance. Our goal is to find a low support point and enter. It can be referred to as buying at the pullback point. The pullback point can be found with a Fibonacci extension of 61.80%. This is a step to find entry level. 1) Find a triangle (Fibonacci Speed Fan Line) that connects the high (resistance) and low (support) points of the stock in progress, where it is continuously expressed as a Slingshot, 2) and create a Fibonacci extension level for the first rising wave from the start point of slingshot pattern.
When the current price goes over 61.80% level , that can be a good entry point, especially if the SMA 100 and 200 curves are gathered together at 61.80%, it is a very good entry point.
As a great help, tradingview provides these Fibonacci speed fan lines and extension levels with ease. So if you use the Fibonacci fan line, the extension level, and the SMA 100/200 curve well, you can find an entry point for the stock market. At least you have to enter at this low point to avoid trading failure, and if you are skilled at entering this low point, with fibonacci6180 technique, your reading skill to chart will be greatly improved.
If you want to do day trading, please set the time frame to 5 minutes or 15 minutes, and you will see many of the low point of rising stocks.
If want to prefer long term range trading, you can set the time frame to 1 hr or 1 day.

Profit taking on Netflix for the summer, only to buy in lowerNASDAQ:NFLX is still in a strong high time frame uptrend, I'm not saying the stock has turned bearish overall, however profits need to be taken when trading and this is one of those times.
I'd prefer to buy back in closer to $1,000 if possible though either way I'll keep 33% of my stack.

Taking profit on GE Aerospace stock to buy in lower after summerIt's clear NYSE:GE has hit overbought, it's the perfect time to take profits now. Less stress managing stocks over the summer too lol...
$196 is the 0.618 level I'm aiming to re-enter, there's also decent support near that level $190 to $200

Looking to take profits on Microsoft that's severely overboughtThis summer most stocks will lose their momentum making it a great time to take profits. We got into NASDAQ:MSFT at an average of $$350-375, it's time to sell at least half to 75% of the stack then buy back around the 0.618 golden fibonacci at $400 after the gap is filled.

Time to take profits on Robinhood, it's extremely overboughtit's just about time for profit taking with summer here. Aiming for around $45-50 prior resistance turns to support, to buy back in at the 0.618 golden fib level as well.

Beautiful ABCD pattern appearing on bigger tf.Beautiful ABCD pattern appearing on
bigger tf.
Crossing 101 - 102 with Good Volumes may
trigger new highs towards 120 atleast.
78 - 80 is an Immediate Resistance area.
On the flip side, a Very Strong Support is
around 68 - 70 & then around 62 - 63

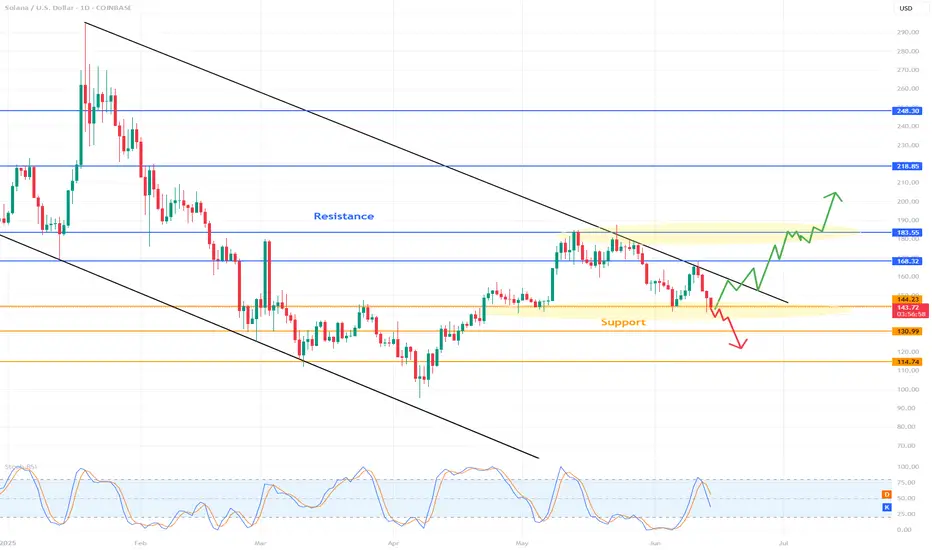
SOLUSD 1D Chart Review1. Main Trend
Downward Channel: Price moving in wide, downward channels (black trend lines), which means that the medium and long term remains bearish.
The upper trend line is a strong dynamic resistance, the lower one – support.
2. Key Horizontal
Resistance (Resistance):
$168.32: Strong resistance level, which it has responded to many times in the past.
$183.55: Another important resistance, confirmed by historical highs.
$218.85: Further resistance with an interval obligation.
$248.30: Very strong, long-term resistance (far from the current price for now).
Support (Support):
$144.23: actually occurs close to this support – very level.
$130.99: Another potential level where price could look for a rebound.
$114.74: Strong support, last bastion of bulls near March/April low.
3. Price action (Price action)
Last candles emitted pullback from downtrend line and down to support area of $144.23.
that any attempt to grow above trend line is limited by sellers.
$144.23 level currently existing short-term support - its loss may be available in case of $131 or possibly existing.
4. Indicator
Stochastic RSI (at the bottom of the chart):
Stochastic RSI indicator stated that airlines (blue and orange) were in power (overbought) in recent devices, but suddenly started to turn down.
Currently occurs in neutral zone, however application of protection (oversold). In case of threat occurrence now, it may suggest risk of attack, but it is not yet decided.
It is worth noting whether to go to the area of 20 and start turning back - in case of a necessary necessity.
5. Scenarios for the days
Bullish (growth):
Maintaining support at 144.23 USD and hitting the downtrend line (around 160-165 USD).
Breaking the trend line and resistance at 168.32 USD will give a signal to load in the area of 183-218 USD, but for the tenth time it seems to be less important, attention given the market structure.
Bearish (fall):
Breaking support at 144.23 USD and closing below on the daily candle - the next target to 131 USD, and then 114 USD.
The downtrend channel is still working against the bulls.
6. Summary
Main trend: downtrend.
Price: Close to support, but the risk of you leaving a big one.
Key horizontals: $144.23 (short-term support), $168.32 (main resistance).
Stochastic RSI: Heading towards oversold zone, but not yet giving a clear conclusion about a breakout.
Recommendation: Observe the application of price at $144.23 and the behavior of Stochastic RSI. In case of a breakout - it is possible that they will occur.

Non Uclidean Fib BTC down after denial of Dual ZoneBTC keeps denying Zone the future of BTC spells a fall down a cliff
Bitcoin: Higher Degree Wave DimensionsA new long-term pattern has been identified. Essentially a stretched version of the chart shown here:
This resemblance holds to some extent, as the coordinates are anchored to relatively longer cycles:https://www.tradingview.com/x/PUxSDlLx/
Publishing this one in raw form (intentionally minimal) just to document a recurring structure across extended timeframes.

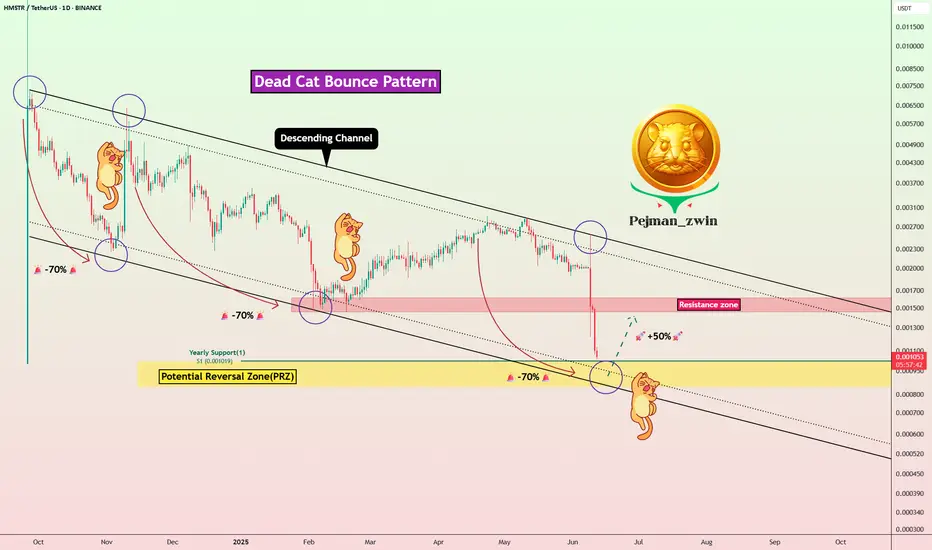
Dead Cat Incoming? HMSTR Eyes +50% Rebound Before Full MeltdownToday, let’s take a look back at HMSTR( BINANCE:HMSTRUSDT ), the token from the Telegram game Hamster Kombat .
While the game quickly gained global popularity and attracted massive user attention, it unfortunately seems to be failing — and may already be on the path to collapse .
Let’s break down some of the key reasons behind Hamster Kombat’s apparent failure :
Widespread Fake Airdrops & Scams:
In 2024–2025, Hamster Kombat became a major target for fake airdrop scams. These schemes tricked users into sharing private keys or signing malicious contracts, resulting in millions in losses. This shows the project lacked proper infrastructure to protect its community.
Unsustainable Tokenomics:
Despite publishing a whitepaper, the core economic model remains unclear. Relying only on a tap-to-earn mechanic without real utility or deflationary systems is not a viable long-term strategy.
Artificial Hype & Fake Engagement:
The project heavily depended on viral marketing and was flooded with bot-generated comments and fake testimonials, creating unrealistic expectations.
Lack of Transparency:
To this day, there is no clearly identified team or registered company behind the project, which is unusual for any serious crypto initiative.
Multiple Phishing Attacks & Fake Pages:
Many scam websites impersonated the project to steal user assets. The lack of strong, coordinated efforts from the team to prevent or warn users raises major concerns about security and credibility.
---------------------------------------------------------------------
Let's take a look at the HMSTR chart on the daily timeframe and see if this token can still be profited from !?
HMSTR token is trading near the lower line of the descending channel , Potential Reversal Zone(PRZ) , and Yearly Support(1) .
From a Classic Technical perspective and considering the fundamental conditions of the Hamster Kombat project , it seems that this project has succeeded in forming an Dead Cat Bounce Pattern .
In addition, in previous months , the cat of this Dead Cat Bounce Pattern would wake up and make a leap after every -70% decline .
I expect the HMSTR token to start rising again ( of course, a temporary increase ) and can increase its price by +50% .
Do you think the HMSTR chart cat will act again this time?
Note: If the HMSTR token goes to PRZ, we should expect more declines
Note: Please pay more attention to capital management in this analysis.
Please respect each other's ideas and express them politely if you agree or disagree.
Hamster Kombat Analyze (HMSTRUSDT), Daily time frame.
Be sure to follow the updated ideas.
Do not forget to put a Stop loss for your positions (For every position you want to open).
Please follow your strategy and updates; this is just my Idea, and I will gladly see your ideas in this post.
Please do not forget the ✅' like '✅ button 🙏😊 & Share it with your friends; thanks, and Trade safe.
USDJPY IdeaGuys we got tight sl and huge rr so guys wait for market structure form on low tf then enter from the given zone .
I as well inform when i take order in thegroup.
Please follow to support me . Thank you !

Expiration Dates for Options using Fibonacci Time ZoneThis is a way I use the Fibonacci Time Zone; it naturally leans into a balance of Gamma and Theta Decay. Choosing the right strike zone is up to your strategy. I prefer Covered Calls, Debit Spreads and Iron Condors for this strategy. Puts are fair game too. If you choose to roll something over, most recoveries occur after a month and a half after a 10% SPY drop off.

Favorite Fibonacci ChannelI posted about the Fibonacci Channel I regularly use to set my stop loss, mean reversal TP, and breakout TP. It's typically 0.5 for a mean reversion, and the breakout is typically confirmed with a strong move past the 1.27 or -0.27 threshold, with 1.88 as the expected move and Euler's e and Pi as the followed profit targets. The vice versa is true for negative Tp below the zero line. I trade it as low as the 1-minute time frame to as high as weekly, as it works very well, especially when it's preparing a squeeze.
