Ethereum (ETH) is still looking bullish"Spring" breakout, retest of the range low. Textbook price action on ETH!
Fibonacci

AUDJPY TREND TRADINGLooking to follow the lower time frame bullish trend next week to play into the higher timeframe down trend. Three trade ideas roughly looking to bank 16R. can squeeze more depending on if you market execute from price action signals or just set limit orders with conservative stop loss sizes.

EURUSD entry long 1h*The content on this analysis is subject to change at any time without notice, and is provided for the sole purpose of assisting traders to make independent investment decisions.

OIL for long 1h *The content on this analysis is subject to change at any time without notice, and is provided for the sole purpose of assisting traders to make independent investment decisions.

DXY for short 45m*The content on this analysis is subject to change at any time without notice, and is provided for the sole purpose of assisting traders to make independent investment decisions.

SOL (Weekly timeframe): Trend structure Price is approaching a key macro support zone. However, as long as it remains below the $148 level, I cannot rule out the possibility of one more corrective leg toward the $76–$55 range before a medium-term bottom is established and a potential resumption of the broader uptrend begins.
A breakout and sustained close above the $148 level would serve as the first technical signal that either:
- a corrective wave B (preceding a deeper correction toward the macro support zone) is unfolding, or
- a new long-term bullish trend aiming for all-time highs is beginning.
Monthly outlook:
My previous idea from November 2024 has fully realized its structure:
Thanks for reading and wishing you successful trading and investing decision!

GOLD / XAUUSD to 2800-2900Looking at the most recent impulsive move, It has to do Either 2 things:
1. Plan A: Go for an all time high without reversal. (3600 - 3700)
2. Plan B: Head towards ( 2800 - 2900 ) then All time high.

Technical Trend Analysis of Tata Consultancy Services (TCS) Tata Consultancy Services (TCS), a leading player in the IT services sector, has recently garnered attention for its potential volume increase, making it a focal point for technical analysis.
This blog post delves into the current technical trend analysis of TCS stock (NSE: TCS) based on the 1-day chart.
Selection Rationale
TCS was selected for this analysis due to its observed potential for increased trading volume, a critical indicator of market interest and price movement. The analysis employs a trendline drawn from the highest highs to capture the stock's directional momentum, complemented by Fibonacci retracement levels to identify key support and resistance zones.
Trendline and Fibonacci Analysis
The primary trendline, established from the peak highs, indicates a downward trajectory over the observed period. This suggests a bearish sentiment prevailing in the short term. Overlaying the Fibonacci retracement tool, the price action reveals significant support at the 0.236 level, currently aligning around INR 3,445.70. This level has historically acted as a strong support zone, where the stock price has demonstrated resilience against further declines.
Key Support and Resistance Levels
Resistance Levels: The chart highlights resistance at INR 3,660.00 (0.5 Fibonacci level), INR 3,936.90 (0.618 level), and INR 4,176.50 (0.786 level), with the upper bound nearing INR 4,600.00.
Support Levels: Beyond the current support at INR 3,445.70, additional support is noted at INR 3,200.00, with a potential downside to INR 3,055.50 if the trend continues.
Volume Insights
The volume bars at the bottom of the chart reflect intermittent spikes, particularly around key price movements. This corroborates the selection criterion of potential volume increase, suggesting that significant buying or selling pressure could influence future price action.
Conclusion
The technical analysis of TCS indicates a bearish trendline with the stock currently testing a critical Fibonacci support level at 0.236 (INR 3,445.70). Investors and traders should monitor this level closely, as a break below could signal further downside, while a rebound may indicate a reversal or consolidation. Given the potential for volume-driven movements, staying attuned to market developments will be essential for informed decision-making.
For a more comprehensive analysis or real-time updates, consider utilizing advanced tools and platforms like TradingView, and consult with a financial advisor for personalized investment strategies.
Disclaimer: This analysis is for educational purposes only and should not be considered financial advice. Always conduct your own research and consult with a professional before making investment decisions.

GOLD: Exponential Scaling 1.618^1/5Gold's natural growth patterns have apparent alignment Fibonacci progression.
Exponential Scaling using a constant phi (1.618) raised to 0.20 power exponent:
The lines follow historical movements with exponential accuracy, aiding the identification of swing points of major momentum shifts.
Major swings metrics:

Gold Breaks Out- Bulls Eye Record High Gold prices are poised to mark a third consecutive daily advance with XAU/USD clearing the June opening-range on news of war breaking out in the Middle East. The breakout takes price into uptrend resistance and while the broader outlook remains constructive, the immediate advance may be vulnerable while below this slope.
A rally of more than 1.7% extended into uptrend resistance at the median-line before pulling back and the immediate focus is on today’s close with respect to the record high-close at 3431. Risk for near-term inflection off this zone with a close above needed to mark uptrend resumption. Subsequent resistance objectives are eyed at the record high at 3500 and the 100% extension of the May rally at 3578- look for a larger reaction there IF reached.
Initial support now rests back at the 61.8% retracement of the April decline / the record high-day close (HDC) at 3355/80- losses should be limited to the median-line IF price is heading higher on this stretch. Subsequent support seen at the May / June open at 3288/89 with bullish invalidation now raised to the May LDC / late-May swing low at 3240/45- a close below this threshold would be needed to suggest a more significant high is in place / a larger reversal is underway.
Bottom line: The gold rally has extended into uptrend resistance at the median-line- risk for possible inflection / topside exhaustion into this slope. From a trading standpoint, losses should be limited to 3355 IF price is heading for a breakout with a close above the median-line needed to fuel the next major leg of the advance.
Keep in mind we get the release of key interest rate decisions from the Bank of Japan, the Federal Reserve, and the Bank of England next week. The ongoing conflict in Iran adds an additional layer of event risk as gold presses record highs- stay nimble next week and watch the weekly closes for guidance here.

ORCL heads up at $212 then 220: Double Golden Fibs may STOP runORCL has been flying off the last Earnings report.
About to hit DUAL Golden fibs at $212.67-220.21
Ultra-High Gravity objects in its price-continuum.
It is PROBABLE to consolidate within the zone.
It is POSSIBLE to reject and dip to a fib below.
It is PLAUSIBLE but unlikely to blow thru them.
.
My last Plot that caught the BreakOut EXACTLY:
=================================================
.

BNB as market indicator?Technically, BNB provides the perfect range setup. After forming a potential 'spring', the price went above the midband, but then retested the range low once more and has been bouncing ever since. Given that the price also broke the downtrend on the daily timeframe, the BNB chart could indicate that the altcoin correction is over. Technically...

GBPUSD – Rejection From New Price High Questions UptrendThe escalation in geo-political risks overnight in the Middle East, marked by Israel's attack on Iranian nuclear sites which was followed by Iran's retaliatory drone strikes against Israel, have seen a rush to safe haven assets, which this time included buying dollars (a rarity of late!).
This has seen GBPUSD fall quickly from a fresh 2025 high hit early this morning at 1.3633, back down to lower levels around 1.3540 (at time of writing) and questions whether the highs for GBPUSD may now be in place in the short term, with traders possibly reluctant to add to fresh longs into the weekend, and ahead of next week's Bank of England (BoE) rate meeting on Thursday (June 19th).
Looking forward into the Friday close, traders may now be on headline watch, especially considering Iran's vow to respond to Israel's initial attack with harsh blows against both Israel and the US. Any attack by Iran against US targets, while potentially unlikely, could be viewed as a level up and President Trump has stated that the US are on high alert just in case.
On the data front, the US Preliminary Michigan Consumer Sentiment for June is released at 1500 BST today. This will provide the next update on US consumer inflation expectations as well as sentiment, which although important are possibly unlikely to shift the focus of traders from progress reports regarding geo-political developments in the Middle East.
Technical Update: Rejection From New Price High Questions Uptrend
Of late, it has been a positive phase of sentiment that has been evident for GBPUSD, as a price pattern of higher highs and higher lows has formed, as the chart below shows.
This has resulted in a new recovery price high being posted this morning at 1.3633, which represents the highest trade in GBPUSD since late February 2022. However, so far this new upside extreme in price has held and seen price weakness emerge.
This may now see some traders questioning the ability of GBPUSD to maintain its current upside momentum, even suggest the potential of a more extended phase of weakness.
What support and resistance levels might be worth watching to maybe help determine the next direction of price movement?
Potential Support Levels:
Having held price weakness seen earlier this week, the rising Bollinger mid-average may continue to be a support focus. This currently stands at 1.3504, and closing breaks below this level, if seen, might result in a more extended phase of weakness.
Such downside breaks in price, while not a guarantee of further price declines, could see focus then shift to potential support at 1.3444, which is equal to the 38.2% Fibonacci retracement level, and if this in turn gives way on a closing basis, towards 1.3385, the deeper 50% retracement level.
Potential Resistance Levels:
As the chart below shows, sellers have been found this morning at the 1.3633 level and may be again. This could prove to be the first resistance point to monitor if fresh attempts at price strength are seen over coming sessions.
Successful closing breaks above 1.3633 as a result, could point to an extension of the current uptrend pattern, with the next resistance level then potentially being 1.3749, which is the January 2022 high.
The material provided here has not been prepared
accordance with legal requirements designed to promote the independence of investment research and as such is considered to be a marketing communication. Whilst it is not subject to any prohibition on dealing ahead of the dissemination of investment research, we will not seek to take any advantage before providing it to our clients.
Pepperstone doesn’t represent that the material provided here is accurate, current or complete, and therefore shouldn’t be relied upon as such. The information, whether from a third party or not, isn’t to be considered as a recommendation; or an offer to buy or sell; or the solicitation of an offer to buy or sell any security, financial product or instrument; or to participate in any particular trading strategy. It does not take into account readers’ financial situation or investment objectives. We advise any readers of this content to seek their own advice. Without the approval of Pepperstone, reproduction or redistribution of this information isn’t permitted.

EURUSD topped? This Elliott wave count says YES!In our previous analysis, we were EURUSD bearish, and although we are trading about 2 cents higher now than when that analysis was published, we are still convinced that these high hills are shortable.
The pair, in our opinion, has finished a complete 5-wave Elliott formation earlier this week, and we prefer the short, with 2 targets that seem particularly interesting:
1. The flat correction target around 1.1065
2. The bottom of wave 4 of a lesser degree, at 1.0733, which is equal to, exactly & down to the pip, to the 61.8% retracement for the whole 5-wave sequence!
We will continue to be bearish for as long as 1.1704 is not clearly penetrated.
Whether the price penetrates 1.1704 & we give up, or, the market moves into our profit zone, we will post updates every week or so. Stay tuned!

SIEMENS LTD Long Term Trend OutlookSIEMENS has maintained a strong multi-year bullish trend since its 2009 low of ₹97.36, consistently respecting a well-anchored ascending channel. After a major rally peaking at ₹4,164.15, price is now reacting to a major supply zone, showing initial signs of distribution.
We should monitor a potential retracement towards the ₹1,400.95 re-accumulation zone, which aligns with the historical demand area and the lower boundary of the long-term trendline. This confluence may provide a high-probability re-entry point for long-term investors seeking continuation exposure.
As long as the macro structure holds above the trendline, the long-term bullish thesis remains intact. A failure below the re-accumulation zone would signal a significant structural shift.

gold for mong 1h *The content on this analysis is subject to change at any time without notice, and is provided for the sole purpose of assisting traders to make independent investment decisions.

EURUSD long 30m*The content on this analysis is subject to change at any time without notice, and is provided for the sole purpose of assisting traders to make independent investment decisions.

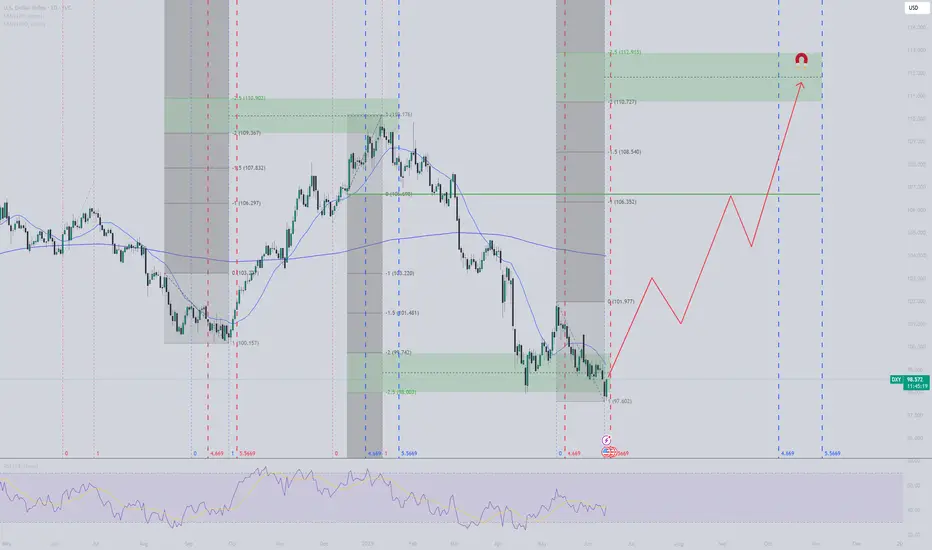
DXY ready for takeoffDXY seems to have reached the bottom for now, as planned within the marked red timezone. I expect a bullish run until October (blue timezone) with target around 111-113 USD, which corresponds to 2-2.5 stdv from this last manipulation leg lower. All areas marked in chart.
Its shopping time broToday is Blessed-Friday-sell on BTC. Buy it or miss it.
Now I do not want to listen,
"Oh, Abdul, we missed it. Next time, I will follow you for sure."
:)

SUI — Trading with Geometry: Why Harmonics Work So WellSUI has been respecting technical levels with remarkable consistency. After bouncing from the $2.8467 low, it surged sharply — completing a clean Cypher Harmonic Pattern. This led to a high-probability short setup at the 0.786 Fibonacci retracement (Point D) around $3.5573.
🎯 Trade Setup Breakdown
Pattern: Cypher Harmonic
Entry (Point D): $3.5573 (0.786 retracement of XC)
Target: $3.1191 (0.618 retracement of CD)
Stop-Loss: Above Point X
The 0.618 fib retracement of the CD leg coincides with a significant key low from May 6, 2025, adding structural confluence. This is an ideal level to monitor for absorption, reaction, or potential reversal behaviour.
🧠 Educational Insight: How to Trade Harmonic Patterns Like a Pro
Harmonic patterns aren't just visually appealing — they represent high-probability setups based on market structure, Fibonacci geometry, and behavioural cycles. The most critical part of every harmonic pattern?
You enter at Point D.
Whether the pattern is bullish or bearish, Point D is your trigger:
In bearish patterns (like this Cypher), you short from Point D.
In bullish patterns, you long from Point D.
This works because Point D marks the exhaustion of the corrective leg, where trapped traders and liquidity often sit. The structure often aligns with supply or demand zones, order blocks, or FVGs (Fair Value Gaps).
💡 Important: Harmonic patterns are most effective on higher timeframes — 4H and above. On lower timeframes, noise increases and reliability drops significantly. For clean execution and meaningful structure, stay with mid to high timeframes.
Here’s how to trade it effectively:
✅ Wait for the full pattern to form — don’t front-run
✅ Use fib levels and structure confluence to validate Point D
✅ Use order flow tools (like Exocharts) to confirm absorption or volume shift
✅ Enter on Point D with your stop-loss just beyond X
✅ Take profits at common retracement levels like the 0.382 or 0.618 of the CD leg
Patience is key. Harmonic traders wait for the market to complete the cycle — then strike with a plan.
📌 Final Thoughts
SUI is delivering clean harmonic respect, and this setup is no exception. Whether you're already short or waiting for further confirmation, keep an eye on volume, liquidity zones, and reaction levels around $3.1191. If this zone holds, it may serve as a pivot for the next move.
Pattern. Precision. Patience. That's how you catch high-probability trades like this.
_________________________________
💬 If you found this helpful, drop a like and comment!
Want breakdowns of other charts? Leave your requests below.

HFCL Long Trade Setup📊 Price Action & Trend Analysis
Analyzing market trends using price action, key support/resistance levels, and candlestick patterns to identify high-probability trade setups.
Always follow the trend and manage risk wisely!
Price Action Analysis Interprets Market Movements Using Patterns And Trends On Price Charts.
👉👉👉Follow us for Live Market Views/Trades/Analysis/News Updates.

GOLD → Geopolitical risks are driving gold prices up. To ATH?FX:XAUUSD is updating its interim highs as it retests resistance at 3435 amid escalating tensions in the Middle East. Economic risks are on the rise...
Gold rose 1.5% on Friday in Asian trading as investors sought refuge from escalating tensions between Israel and Iran. The price approached 7-week highs and could reach $3,500 if the conflict intensifies. The US and Israel have warned of serious consequences, while Iran has promised to respond. Geopolitics has overshadowed economic news, and markets are pricing in the possibility of a Fed rate cut in September.
Technically, the price is emerging from a local consolidation and testing a fairly important resistance level, forming a false breakout and correction. But this does not mean that the price will fall...
Resistance levels: 3425, 3435, 3461
Support levels: 3408, 3400, 3377
If gold consolidates above 3425 and continues to storm the resistance, growth may continue, and at the moment, there is a fairly high probability of a retest of the ATH. However, the ideal scenario would be a retest of the zone of interest 3408 - 3400 and the capture of liquidity before continuing growth.
Best regards, R. Linda!

TELEKOM MALAYSIA going to rm8based on research report by
2025-06-13 TM
TELEKOM MALAYSIA BHD
6.60 8.15 +1.55 (23.48%) BUY RHB-OSK
now retracing to 0.618
predicting that it will go for the third wave untul 1.618 at RM8
