bitcoin for long *The content on this analysis is subject to change at any time without notice, and is provided for the sole purpose of assisting traders to make independent investment decisions.
Fibonacci

EURCHF Wave Analysis – 12 June 2025- EURCHF reversed from the resistance zone
- Likely to fall to support level 0.9300
EURCHF currency pair recently reversed down from the resistance zone between the key resistance level 0.9410 (which has been reversing the price from April), the upper daily Bollinger Band and the 50% Fibonacci correction of the downward impulse from April.
The downward reversal from this resistance zone stopped the (c)-wave of the previous ABC correction ii.
Given the overbought daily Stochastic, EURCHF currency pair can be expected to fall to the next support level 0.9300 (which stopped earlier waves b and ii).

Ethereum Name Servise ENS price analysisFor the second day in a row, trading volumes on the CRYPTOCAP:ETH futures market have exceeded those of CRYPTOCAP:BTC
(Is the market alpha returning or are profits being locked in? Write your thoughts in the comments ?)
💡 And we will write an analysis of the possible movement of the NYSE:ENS price — this is the #Ethereum Name Service management token, which is used to manage the protocol and influence pricing decisions for its .eth addresses and price oracle.
👌 Currently, all forces are preventing the OKX:ENSUSDT price from consolidating above $23.6. But when that happens, it will be a very safe level to buy on a retest.
📊 More risky, but with greater earning potential, are purchases at $17.50 and $14.50.
Set your “buckets” for purchases and wait for them to “fill up.”
And then, who knows, maybe in 2025, the price of NYSE:ENS will reach its ATH.
_____________________
Did you like our analysis? Leave a comment, like, and follow to get more

BGC LongEquity Play. I plan to get a few shares of this stock since it's cheap, and run a covered call strategy up to 10, hopefully it stays above that level.

Signs of reversalBTC hit its technical target after breaking below its range at the resistance of the January ATH. The hourly RSI is showing signs of reversal.


SP500: Recursive Historic PatternAs a part of my research on fractal phenomena, I'm collecting recursive patterns directly to better understand the emerging structural landscape.
Documenting systemic behavior
Sharp drop
Distinctive growth cycle
Putting this out as current price is near all time high.

Waiting DOGE to hit ATHDoge is showing reversal signs. My first target is ATH (all-time high), which is just 163% away. The next goal is at least a 3x from there. Right now, we're in the weekly overbought zone (OB). If we break through it, the idea is invalidated.

USD/CHF 4H Analysis – Bearish Continuation Setting Up?USD/CHF is currently forming a textbook symmetrical triangle consolidation pattern just below key EMAs (20, 50, and 200), signaling potential exhaustion in bullish momentum. Price is compressing against the upper boundary of the triangle, failing to sustain above the 0.382 Fib retracement level (0.82302), which is aligned with the 50 EMA – a known area of dynamic resistance.
This consolidation follows a clear bearish leg from the swing high at 0.83472, which suggests this triangle is likely a continuation pattern. A clean break below the ascending trendline support would confirm bearish continuation, with a measured move target near the 0.81068 level, which aligns with the -0.27 Fib extension.
🔍 Key Technical Levels:
Resistance: 0.82302 (0.382 Fib), 0.82525 (0.5 Fib), 0.82753 (0.618 Fib)
Support: 0.82026 (0.236 Fib), 0.81579 (Swing Low), 0.81068 (Bearish Extension Target)
📌 Watch for:
A decisive break and close below triangle support
Volume spike or bearish engulfing candle for confirmation
RSI is neutral but leaning slightly bearish; room for downside
🎯 Bearish Bias
📍 Tag: #USDCHF #ForexAnalysis #WrightWayInvestments

XAU/USD 1H – Clean Impulsive Setup UnfoldingGold has completed a clean Wave (2) correction, bottoming at $3,292.30, respecting both structural demand and fib confluence. Price is now showing early signs of Wave (3) development to the upside.
📌 Key Structure:
Wave (1) High: $3,403.30
Wave (2) Low: $3,292.30 (confirmed higher low structure)
Market is now consolidating slightly above the 0.5 fib level ($3,324.45), with bullish structure still intact.
📈 Technical Confluence:
Price is holding the internal bullish trendline
RSI is neutral but building potential upside momentum
Price action is forming higher lows, indicating strength post-correction
🎯 Next Bullish Targets:
$3,366.08 (0.236 fib level of Wave (2) correction)
$3,403.30 (Wave (1) high retest)
Final Wave (3) extension zone: $3,445 – $3,500
📉 Invalidation Level:
A break and close below $3,292.30 would invalidate this Wave (2) bottom and open the door for a deeper correction.
✅ Bias:
Bullish, as long as price holds above the 0.618 – 0.705 fib zone. A strong push from this area could confirm the next leg of Wave (3).
@WrightWayInvestments
@wrightwayinvestments
@wrightwayinvestments

USD/CAD Breaks Through Multi-year Trend Support USD/CAD broke through a key pivot zone last week at 1.3721/94- a region defined by the 38.2% retracement of the 2021 advance and the 61.8% retracement of the late-2023 advance. The subsequent decline is now extending more than 2.9% off the May highs with initial support within striking distance.
Weekly momentum has now dropped to the lowest levels since 2021 and a break of the 2021 uptrend (2022 trendline) threatens further losses ahead. Initial weekly support rests at the 1.618% extension of the February decline / 78.6% retracement of the late-2023 advance near 1.3504/23. Note that basic channel support converges on this threshold over the next few weeks and further highlights the technical significance of this zone (area of interest for possible downside exhaustion / price inflection IF reached). Subsequent support rests with the 2024 low-week clow (LWC) at 1.3360 and the 2023 LWC at 1.3218.
Weekly resistance is now eyed back at 1.3721 & 1.3795. Broader bearish invalidation is now lowered to the 52-week moving average / 2022 swing high near ~1.3961/78- a breach / close above the yearly channel would ultimately be needed to suggest a more significant low is in place.
Bottom line : USD/CAD has broken below multi-year uptrend support and threatens further losses in the weeks ahead. From a trading standpoint, look to reduce portions of short-exposure / lower protective stops on stretch towards 1.3523 IF reached- rallies should be limited to 1.3795 IF price is heading lower on this break with a close sub-1.35 needed to fuel the next major leg of the decline.
-MB

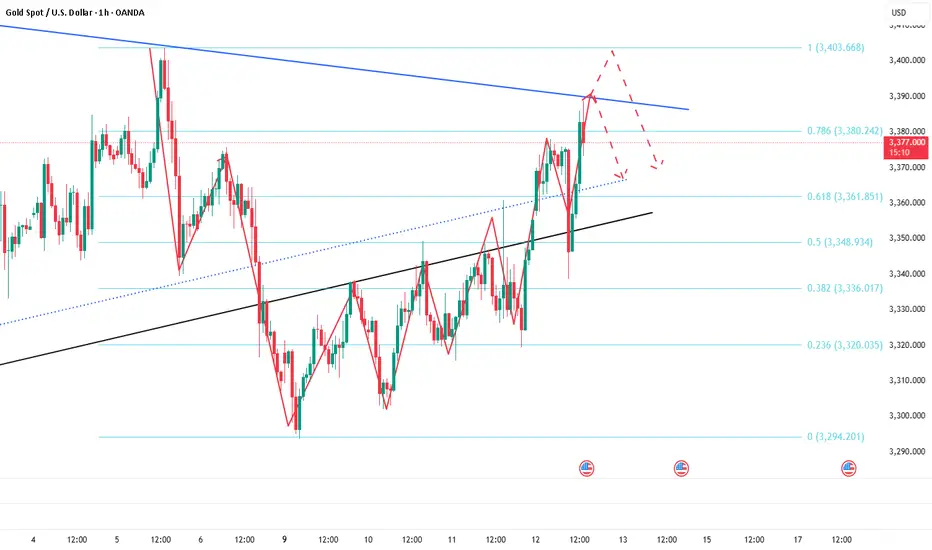
Short gold ,it is expected to retreatToday, we accurately seized the trading opportunity of long gold at 3350 according to the trading plan, and hit TP: 3380 in the process of rebounding. We firmly grasped the profit of 300pips in the short-term long trading. At present, gold maintains the trend of continued rise! Now I definitely do not advocate chasing gold in short-term trading. On the contrary, I will actively look for good opportunities for short-term short trading to earn profits from short-term retracement.
In the short term, the suppression area I focus on is the 3390-3395 area, because the gold trend is relatively strong during the European session, and the US session should continue. If gold cannot break through this area in the short term, gold will likely usher in a wave of retracement. I think it should not be difficult to test the 3370-3360 area downward; secondly, we must pay attention to the same suppression area as the short-term high of 3402: 3405-3415; if gold touches this area and stagflation occurs, then it may form a secondary high in the short term, thereby hitting the firmness of the bulls' confidence and ushering in a retracement.
So next, I will test the gold short trade around the two areas of 3390-3395 and 3405-3415. Relatively speaking, the profit and loss ratio is still very favorable to us! But in the process of trading, we must strictly set up protection, after all, it is a counter-trend trade in the short term!
BVOL (Bitcoin Historical Volatility Index) Weekly TF 2025 Summary:
BVOL (Bitcoin Historical Volatility Index) remains compressed near historic lows. This analysis explores the potential for a volatility expansion cycle, key Fibonacci retracement levels, and how shifts in volatility may precede directional moves in BTC and the broader crypto market.
Chart Context:
Timeframe: Weekly (1W)
Current BVOL: ~13.23
Historical Support Zone: ~11.76–15 (consolidation base since 2022)
Resistance Area: ~25–35 (marked breakout threshold)
Fibonacci Retracement (from peak ~192.79):
23.6% = 56.17 → 2nd TP
38.2% = 89.01 → 3rd TP
48.6% = 99.74 → Intermediate fib zone
61.8% = 123.63 → Cycle expansion cap (potential BTC top region)
100% = 192.79 → All-time spike (rare volatility events)
Key Technical Observations:
Consolidation Floor: Since mid-2022, BVOL has hovered near extreme lows often a prelude to sharp directional moves.
Support-turned-Resistance: Past volatility surges often topped near fib clusters (23.6%, 38.2%, 61.8%). These will likely act as TP zones during volatility spikes.
Expected Path:
Base breakout above 25 → TP1 = 35
Acceleration phase → TP2 = 56–60
High volatility climax → TP3 = 85–89
Volatility Trend Commentary:
Current Phase: Low volatility compression, common in accumulation phases.
Volatility Expansion Signal: A break above the 25–35 band may signal the start of a high-volatility impulse (typically aligned with large BTC directional moves).
Dotted Paths on the chart reflect the two key expansion possibilities:
Straight rally up to TP3 (85)
Mid-stage pullback post-TP2 (bear trap scenario)
Macro Correlation:
BVOL vs BTCUSD: Historically, BVOL lows precede strong BTC trends — both bull and bear cycles.
BVOL vs BTC.D: BVOL surges often shift dominance; either BTC leads during volatility or altcoins rotate post-BTC move.
BVOL vs TOTAL / TOTAL2 / TOTAL3:
Volatility compression in BVOL is directly tied to range-bound TOTAL3.
Total:
Total2:
Total3:
BVOL expansion is often mirrored by strong TOTAL2 & TOTAL rallies.
Confluence seen between BVOL TP zones and critical fib levels in TOTAL charts.
Bias & Strategy Implication:
Volatility Expansion Expected: Current structure is unsustainable; expansion is highly probable in coming weeks/months.
Watch BTC Price Action: If BTC breaks key levels while BVOL rises → Confirmed trend.
Portfolio Strategy: Prepare for volatility-driven liquidation zones. Use BVOL to gauge position sizing and risk.
Notes & Disclaimers:
This analysis is part of the BitonGroup Macro Series.
BVOL is not a directional indicator but a volatility proxy. use in combination with price and dominance metrics.
Always combine volatility forecasts with proper stop-loss and leverage management.

SHIBUSDT soon after breaking red trendline can pump hard On this pump for market we may not have a new ATH for coins like SHIBUSDT or we may have(10% possible).
But as we can see price had a huge amount of fall and now with simple touch near previous daily high we earn good +200% profit.
DISCLAIMER: ((trade based on your own decision))
<<press like👍 if you enjoy💚

Dollar Falling Ends Soon? Look What Pattern Is Forming!”Asset: U.S. Dollar Index (DXY)
Timeframe: 1D (Daily Chart)
Methodology: Elliott Wave + FVG (Fair Value Gap) + Price Action
DXY has completed an impulsive 5-wave bearish structure, now entering a high-probability reversal zone marked by strong buyer interest around the Wave 5 bottom.
📌 Key Insights:
Wave 5 approaching demand zone (Buyers' area)
Price inside Fair Value Gap (FVG) – potential order block
Bullish reversal expected from here
Forecast: A breakout into an ascending channel, confirming reversal
💡 If Wave 5 holds, we may see a sharp upside rally aligning with smart money accumulation + Elliott Wave psychology.
🔔 Watch for bullish confirmations near 97.50–98.00 for a potential long setup targeting the 104–107 zone.

DDOG eyes on $116.34: Golden Genesis fib to determine the TrendDDOG bounce just hit a Golden Genesis at $116.34
The sister Goldens above and below marked extremes.
This one could mark the orbital center for some time.
It is PROBABLE that we orbit this fib a few times.
It is POSSIBLE that we see a pullback from here.
It is PLAUSIBLE but unlikely to continue non-stop.
===============================================
.

LULU eyes on $243-248: Decent Support to buy after Earnings DumpLULU earnings report caused a severe dip in price.
It is now testing a serious support at $243.81-248.17
Look to hold, or stab below and come back above.
.
Last Plot that gave PERFECT entry and exit:
.

XAUUSD Video Analysis Brief – Weekly Forecast Summary (2025)This video summarizes the key scenarios and technical outlook for Gold (XAUUSD) on the weekly timeframe, integrating both Fibonacci-based projections and macro fundamentals.
Core Setup
Gold is currently positioned near the 161.8% Fibonacci extension (~$3,276).
A breakout toward $3,500 is possible before a potential corrective move.
Scenario 1: Bullish Continuation
Gold breaks above $3,435 → rallies to $4300 → continues toward major Fibonacci targets:
TP: $4,320, which is the Fibonacci level 261.8%
Scenario 2: Correction First
Gold fails to hold above $3,435 → triggers a healthy correction to:
TP1: $2,920
TP2: $2,650
If support 161.8% level holds in the correction zone, a renewed bullish phase is expected.
Macro Alignment
Central bank gold buying (notably BRICS) supports the long-term bid.
Fed policy leaning dovish → tailwinds for gold.
Inverse correlation with DXY:
DXY below 98.95 → bullish for gold
DXY above 100 → signals correction
Effect on Altcoins
If correction is risk-on driven, capital may rotate into altcoins.
If triggered by macro stress or USD strength, alts may fall alongside gold.
This analysis offers a multi-scenario framework to navigate the next major moves in gold, with key levels to watch for traders, investors, and macro analysts alike.

AMSC eyes on $29.20/40: Key Resistance holding BreakOut to $35AMSC has been grinding upwards in a nice uptrend.
Currently testing a serious resistance $29.20-20.40
Break should continue grind to next res around $35

CRWD watch $450 then 437: Supports to buy after Earnings dumpCRWD ran up into the earnings report then sold the news.
Initial drop hit a minor support zone $449.08-451.81
May well drop to semi-major support $436.67-437.51

AFRM eyes on $50.66: Semi-Major Genesis fib for High Support AFRM has been showing considerable strength.
Hit a Geneiss fib above and fell back to sister fib.
Strong Bull trend would hold this fib into new highs.
$50.66 is the immediate floor to hold
$49.17 is a minor fib for a speed brake.
$47.60 is Bulls' Last Stand to hold uptrend.
=============================================
.

EURAUD - Short Term Buy IdeaM15 - Strong bullish move.
No opposite signs.
Currently it looks like a pullback is happening.
Expecting further continuation higher until the two Fibonacci support zones hold.
If you enjoy this idea, don’t forget to LIKE 👍, FOLLOW ✅, SHARE 🙌, and COMMENT ✍! Drop your thoughts and charts below to keep the discussion going. Your support helps keep this content free and reach more people! 🚀

gold 15m for long *The content on this analysis is subject to change at any time without notice, and is provided for the sole purpose of assisting traders to make independent investment decisions.
