gold 15m for long *The content on this analysis is subject to change at any time without notice, and is provided for the sole purpose of assisting traders to make independent investment decisions.
Fibonacci

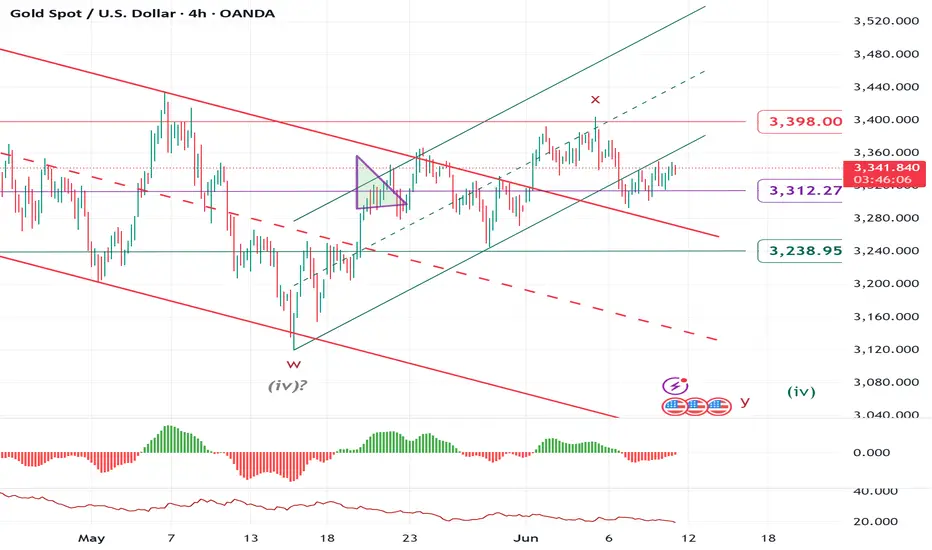
ELLIOTT WAVE XAUUSD H4 update
EW Trade Set Up H4
subminuette wave (iv):
downward price movement from 22 april high at 3500 area looks a sideway correction unless an impulsive movement start breaking up 3350 level first and then 3400 level shortly.
key levels (area)
3400
3350
3312 POC
3290
3240
EURUSD SHORTAccording to natural market structure theory, I observed a gradual increase in volume starting from May 29, which led to a rebound around June 5. However, the uptrend has since lost momentum.
The recent price action has approached the zero line of the descending Fibonacci retracement. This movement, combined with a possible liquidity grab, suggests that the market may shift downward. The target price area is near the 0.5 Fibonacci level, but further observation is needed to confirm this scenario. OANDA:EURUSD

Trend Break + Earnings Strength = ROHLTD Watch!Royal Orchid Hotels Ltd (ROHLTD) has caught the market’s attention recently with a powerful breakout move on the charts, supported by strong fundamentals. The company operates a growing chain of hotels across India under the Royal Orchid and Regenta brands. With domestic tourism booming and business travel recovering steadily, the company is well-positioned to benefit from rising demand in the hospitality sector.
From a technical perspective, the stock had been under a downward-sloping trendline for several months, consistently facing resistance. However, in the latest session, ROHLTD managed to break this trendline with a strong bullish candle and a noticeable increase in volume.
📈 The breakout occurred with volume confirmation, indicating genuine buying interest.
📍 The key breakout level is ₹403 — a daily close above this confirms strength.
🟩 A strong support (reversal) zone lies between ₹365–₹377, where buyers are expected to step in on dips.
🎯 Upside price targets in the near-to-mid term are ₹428, ₹450, ₹485, and possibly ₹545.
On the fundamental side, the company shows healthy financial performance. Revenues have been consistently growing and currently stand above ₹300 crore annually. Profit margins are stable, and the company is maintaining solid profitability.
💰 The Return on Equity (ROE) is around 25%, reflecting efficient capital use.
💸 The company is free cash flow positive, which adds to financial strength.
⚖️ Debt levels are moderate, with a manageable debt-to-equity ratio.
🧮 The stock may appear slightly overvalued near ₹398–₹400, but the strong business outlook and asset-light expansion model justify the premium to some extent.
ROHLTD is also strategically expanding into new cities using a franchise and management contract model, which reduces capital expenditure and increases scalability. This positions the company well for long-term growth without over-leveraging its balance sheet.
For swing traders, the breakout provides an opportunity to enter above ₹403 with a stop loss below ₹360. The targets to watch would be ₹428, ₹450, and ₹485 in the coming weeks. For long-term investors, gradual accumulation near ₹365–₹380 on dips could be a smart strategy, with the potential to reach ₹500+ over the next 6–12 months, provided the company maintains its growth momentum.
In conclusion, ROHLTD is a rare case of a technical breakout aligning with strong fundamentals. While near-term volatility may persist, the overall trend appears bullish, making it a solid candidate for both traders and investors keeping a mid- to long-term view.
Disclaimer: lnkd.in

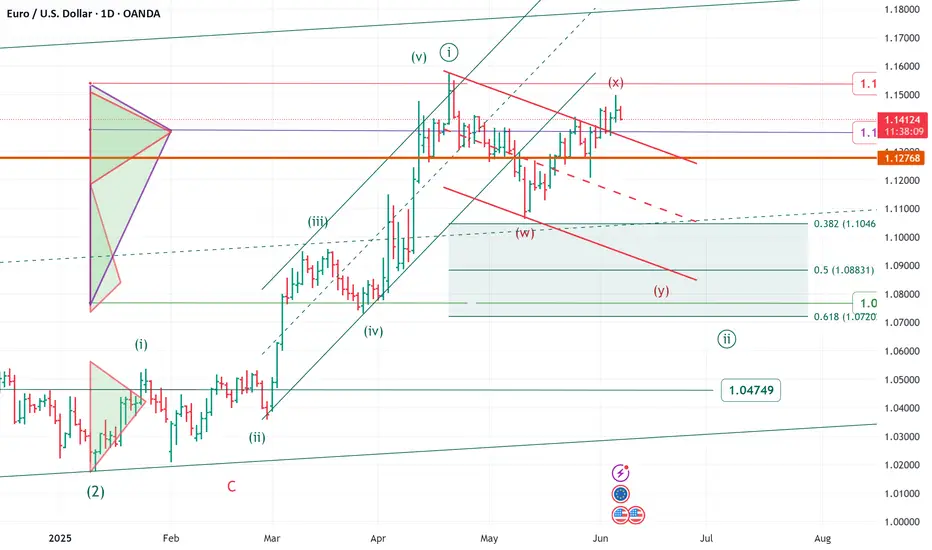
Elliott wave daily EURUSD update
Elliott wave daily EURUSD update
The price movement of the last few weeks requires a change
and update of the wave count
______________________________________
upward movement from area 1.018/genuary 2025 to area 1.1580/april 2025
looks impulsive - minute wave ((i)).
we are now in a corrective minute wave ((ii))
zigzag or flat or any double
target area 1.1040/1.0800 area
in the very short term level to monitor 1.1500 area
over 1.1500 area a flat correction more likely ( to area 1.1570)
note
FX option expiries for 6 June 10am New York cut
1.1500 (EUR 3.19bn)
1.1400 (EUR 2.38bn)
1.1300 (EUR 1.28bn)
FOREXLIVE
SPX'S BULLS !6200 Will get touched easily soon !
because the much vol up there waiting to be hunted at 6100+
𓄀𝓈𝓉𝒶𝓎 𝓉𝓊𝓃ℯ𝒹 𓃓

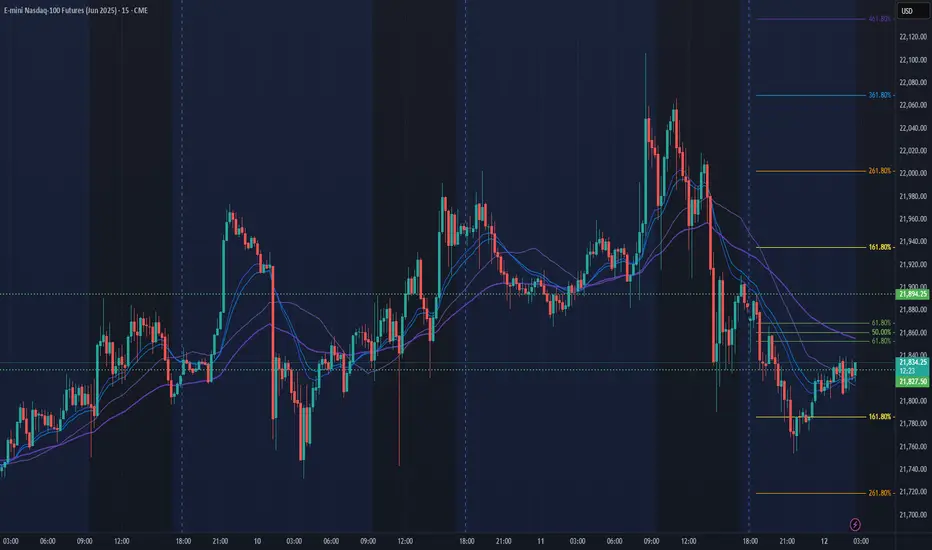
NQ Power Range Report with FIB Ext - 6/12/2025 SessionCME_MINI:NQM2025
- PR High: 21894.25
- PR Low: 21827.25
- NZ Spread: 150.0
Key scheduled economic events:
08:30 | Initial Jobless Claims
- PPI
13:00 | 30-Year Bond Auction
Session Open Stats (As of 12:25 AM 6/12)
- Session Open ATR: 376.45
- Volume: 24K
- Open Int: 268K
- Trend Grade: Neutral
- From BA ATH: -3.6% (Rounded)
Key Levels (Rounded - Think of these as ranges)
- Long: 22096
- Mid: 20383
- Short: 19246
Keep in mind this is not speculation or a prediction. Only a report of the Power Range with Fib extensions for target hunting. Do your DD! You determine your risk tolerance. You are fully capable of making your own decisions.
BA: Back Adjusted
BuZ/BeZ: Bull Zone / Bear Zone
NZ: Neutral Zone
Room for Further Strength as Price Approaches ResistanceOn the 1-hour timeframe, I estimate that XAUUSD is currently forming wave c of wave b of wave (a). This implies that XAUUSD still has the potential to strengthen, testing the 3379 level and possibly retesting the resistance area at 3403. However, caution is warranted going forward, as this outlook reflects the bearish scenario for XAUUSD.

GOLD → Strengthening and return to range. Focus on 3340FX:XAUUSD is forming a fairly strong support zone (a cascade within an upward line). The price is returning to the range, with bulls storming 3330-3340.
Markets are awaiting US inflation data (CPI), which may affect expectations for a Fed rate cut in September (chances are about 52%). Optimism following progress in US-China trade talks is supporting sentiment, but uncertainty remains due to a court ruling allowing Trump to maintain tariffs. This is holding back the dollar and helping gold. CPI forecast: 0.2% growth, core inflation 0.3%. Lower inflation, on the other hand, will support expectations of lower rates and strengthen demand for gold as a safe-haven asset.
Technically, gold is stuck between the boundaries of a symmetrical triangle. Overall, this situation is reflected in all markets. Consolidation is forming and the price could break out in either direction...
Support levels: 3301, 3330, 3340
Resistance levels: 3349, 3361, 3375
Focus on the boundaries of the previous range - 3330 - 3340. If the bulls, after the assault, manage to hold their ground above this zone, the market may take the initiative due to support and continue its growth towards areas of interest.
Best regards, R. Linda!

AUDUSD → Correction after a false breakout before growthFX:XAUUSD continues to rise amid uncertainty surrounding the dollar, which continues to consolidate. The currency pair is preparing to test resistance at 0.6537
The dollar is stuck in place due to market uncertainty. At the same time, the Australian dollar is strengthening and is ready to test the liquidity zone
Within the current trend, the currency pair is heading towards resistance and the liquidity zone. We opened far away, and as we move towards the target, the potential for further growth may end. A false breakout of 0.6537 could trigger a correction
Resistance levels: 0.6537
Support levels: 0.6509, 0.6479
A sharp move towards resistance without the possibility of further growth could cause a false breakout of 0.6537. Price consolidation below this level could trigger a correction before growth.
Best regards, R. Linda!

ETHEREUM → Consolidation amid a bull marketBINANCE:ETHUSD is consolidating in the range of 2400-2750, and locally, the coin looks quite promising even against the backdrop of Bitcoin forming a correction...
ETH is forming a strong consolidation within which it confirms a bullish market structure. After a false breakout of resistance, there is no sharp decline and the price returns to retest resistance.
If the bulls hold their defense above 2530-2550, then in the short and medium term, ETH may demonstrate growth towards the intermediate target.
Resistance levels: 2738, 2855
Support levels: 2525, 2470, 2400
A retest of support at 2525 - 2470 is possible, and if the price holds above this support zone, ETH may try to surprise us. There are good chances for growth.
Best regards, R. Linda!

ANIMEUSDT Eyes Bullish Continuation Cup & Handle SetupANIMEUSDT is shaping a potential cup formation, with current price action working on the handle. Focus remains on the immediate and strong PRZs for potential buy entries. A breakout above the neckline will confirm the pattern and may trigger a strong upside rally toward the final target shown on the chart.

JXY Stock Chart Fibonacci Analysis 061125Trading Idea
1) Find a FIBO slingshot
2) Check FIBO 61.80% level
3) Entry Point > 69.2/61.80%
Chart time frame:D
A) 15 min(1W-3M)
B) 1 hr(3M-6M)
C) 4 hr(6M-1year)
D) 1 day(1-3years)
Stock progress:A
A) Keep rising over 61.80% resistance
B) 61.80% resistance
C) 61.80% support
D) Hit the bottom
E) Hit the top
Stocks rise as they rise from support and fall from resistance. Our goal is to find a low support point and enter. It can be referred to as buying at the pullback point. The pullback point can be found with a Fibonacci extension of 61.80%. This is a step to find entry level. 1) Find a triangle (Fibonacci Speed Fan Line) that connects the high (resistance) and low (support) points of the stock in progress, where it is continuously expressed as a Slingshot, 2) and create a Fibonacci extension level for the first rising wave from the start point of slingshot pattern.
When the current price goes over 61.80% level , that can be a good entry point, especially if the SMA 100 and 200 curves are gathered together at 61.80%, it is a very good entry point.
As a great help, tradingview provides these Fibonacci speed fan lines and extension levels with ease. So if you use the Fibonacci fan line, the extension level, and the SMA 100/200 curve well, you can find an entry point for the stock market. At least you have to enter at this low point to avoid trading failure, and if you are skilled at entering this low point, with fibonacci6180 technique, your reading skill to chart will be greatly improved.
If you want to do day trading, please set the time frame to 5 minutes or 15 minutes, and you will see many of the low point of rising stocks.
If want to prefer long term range trading, you can set the time frame to 1 hr or 1 day.

USDKRW Stock Chart Fibonacci Analysis 061125Trading Idea
1) Find a FIBO slingshot
2) Check FIBO 61.80% level
3) Entry Point > 1368/61.80%
Chart time frame:D
A) 15 min(1W-3M)
B) 1 hr(3M-6M)
C) 4 hr(6M-1year)
D) 1 day(1-3years)
Stock progress:A
A) Keep rising over 61.80% resistance
B) 61.80% resistance
C) 61.80% support
D) Hit the bottom
E) Hit the top
Stocks rise as they rise from support and fall from resistance. Our goal is to find a low support point and enter. It can be referred to as buying at the pullback point. The pullback point can be found with a Fibonacci extension of 61.80%. This is a step to find entry level. 1) Find a triangle (Fibonacci Speed Fan Line) that connects the high (resistance) and low (support) points of the stock in progress, where it is continuously expressed as a Slingshot, 2) and create a Fibonacci extension level for the first rising wave from the start point of slingshot pattern.
When the current price goes over 61.80% level , that can be a good entry point, especially if the SMA 100 and 200 curves are gathered together at 61.80%, it is a very good entry point.
As a great help, tradingview provides these Fibonacci speed fan lines and extension levels with ease. So if you use the Fibonacci fan line, the extension level, and the SMA 100/200 curve well, you can find an entry point for the stock market. At least you have to enter at this low point to avoid trading failure, and if you are skilled at entering this low point, with fibonacci6180 technique, your reading skill to chart will be greatly improved.
If you want to do day trading, please set the time frame to 5 minutes or 15 minutes, and you will see many of the low point of rising stocks.
If want to prefer long term range trading, you can set the time frame to 1 hr or 1 day.

Powell Stock Chart Fibonacci Analysis 061125Trading Idea
1) Find a FIBO slingshot
2) Check FIBO 61.80% level
3) Entry Point > 187/61.80%
Chart time frame:B
A) 15 min(1W-3M)
B) 1 hr(3M-6M)
C) 4 hr(6M-1year)
D) 1 day(1-3years)
Stock progress:B
A) Keep rising over 61.80% resistance
B) 61.80% resistance
C) 61.80% support
D) Hit the bottom
E) Hit the top
Stocks rise as they rise from support and fall from resistance. Our goal is to find a low support point and enter. It can be referred to as buying at the pullback point. The pullback point can be found with a Fibonacci extension of 61.80%. This is a step to find entry level. 1) Find a triangle (Fibonacci Speed Fan Line) that connects the high (resistance) and low (support) points of the stock in progress, where it is continuously expressed as a Slingshot, 2) and create a Fibonacci extension level for the first rising wave from the start point of slingshot pattern.
When the current price goes over 61.80% level , that can be a good entry point, especially if the SMA 100 and 200 curves are gathered together at 61.80%, it is a very good entry point.
As a great help, tradingview provides these Fibonacci speed fan lines and extension levels with ease. So if you use the Fibonacci fan line, the extension level, and the SMA 100/200 curve well, you can find an entry point for the stock market. At least you have to enter at this low point to avoid trading failure, and if you are skilled at entering this low point, with fibonacci6180 technique, your reading skill to chart will be greatly improved.
If you want to do day trading, please set the time frame to 5 minutes or 15 minutes, and you will see many of the low point of rising stocks.
If want to prefer long term range trading, you can set the time frame to 1 hr or 1 day.

QuantumScape Stock Chart Fibonacci Analysis 061125Trading Idea
1) Find a FIBO slingshot
2) Check FIBO 61.80% level
3) Entry Point > 4.25/61.80%
Chart time frame:B
A) 15 min(1W-3M)
B) 1 hr(3M-6M)
C) 4 hr(6M-1year)
D) 1 day(1-3years)
Stock progress:B
A) Keep rising over 61.80% resistance
B) 61.80% resistance
C) 61.80% support
D) Hit the bottom
E) Hit the top
Stocks rise as they rise from support and fall from resistance. Our goal is to find a low support point and enter. It can be referred to as buying at the pullback point. The pullback point can be found with a Fibonacci extension of 61.80%. This is a step to find entry level. 1) Find a triangle (Fibonacci Speed Fan Line) that connects the high (resistance) and low (support) points of the stock in progress, where it is continuously expressed as a Slingshot, 2) and create a Fibonacci extension level for the first rising wave from the start point of slingshot pattern.
When the current price goes over 61.80% level , that can be a good entry point, especially if the SMA 100 and 200 curves are gathered together at 61.80%, it is a very good entry point.
As a great help, tradingview provides these Fibonacci speed fan lines and extension levels with ease. So if you use the Fibonacci fan line, the extension level, and the SMA 100/200 curve well, you can find an entry point for the stock market. At least you have to enter at this low point to avoid trading failure, and if you are skilled at entering this low point, with fibonacci6180 technique, your reading skill to chart will be greatly improved.
If you want to do day trading, please set the time frame to 5 minutes or 15 minutes, and you will see many of the low point of rising stocks.
If want to prefer long term range trading, you can set the time frame to 1 hr or 1 day.

Walgreens Stock Chart Fibonacci Analysis 061125Trading Idea
1) Find a FIBO slingshot
2) Check FIBO 61.80% level
3) Entry Point > 11/61.80%
Chart time frame:B
A) 15 min(1W-3M)
B) 1 hr(3M-6M)
C) 4 hr(6M-1year)
D) 1 day(1-3years)
Stock progress:B
A) Keep rising over 61.80% resistance
B) 61.80% resistance
C) 61.80% support
D) Hit the bottom
E) Hit the top
Stocks rise as they rise from support and fall from resistance. Our goal is to find a low support point and enter. It can be referred to as buying at the pullback point. The pullback point can be found with a Fibonacci extension of 61.80%. This is a step to find entry level. 1) Find a triangle (Fibonacci Speed Fan Line) that connects the high (resistance) and low (support) points of the stock in progress, where it is continuously expressed as a Slingshot, 2) and create a Fibonacci extension level for the first rising wave from the start point of slingshot pattern.
When the current price goes over 61.80% level , that can be a good entry point, especially if the SMA 100 and 200 curves are gathered together at 61.80%, it is a very good entry point.
As a great help, tradingview provides these Fibonacci speed fan lines and extension levels with ease. So if you use the Fibonacci fan line, the extension level, and the SMA 100/200 curve well, you can find an entry point for the stock market. At least you have to enter at this low point to avoid trading failure, and if you are skilled at entering this low point, with fibonacci6180 technique, your reading skill to chart will be greatly improved.
If you want to do day trading, please set the time frame to 5 minutes or 15 minutes, and you will see many of the low point of rising stocks.
If want to prefer long term range trading, you can set the time frame to 1 hr or 1 day.

NASDAQ Potential UpsidesHey Traders, in today's trading session we are monitoring NAS100 for a buying opportunity around 21,700 zone, NASDAQ is trading in an uptrend and currently is in a correction phase in which it is approaching the trend at 21,700 support and resistance area.
Trade safe, Joe.

XAUUSD BUYS PROJECTION Hello everyone yup lately I’ve been slacking off on the charts and haven’t taken a Gold trade since we took a loss tho I have been trading other pairs but nothing like Gold so I’m back and fully active and will be giving my all to XAUUSD only and will be updating you guys so this is my buy projection for Gold I will be waiting for a breakout of the 3,400 zone and also wait for a good pullback with our confirmation to take buys to the last ATH we in this game to win it so let’s watch how the chart plays out and will be updating y’all if am taking any entry….

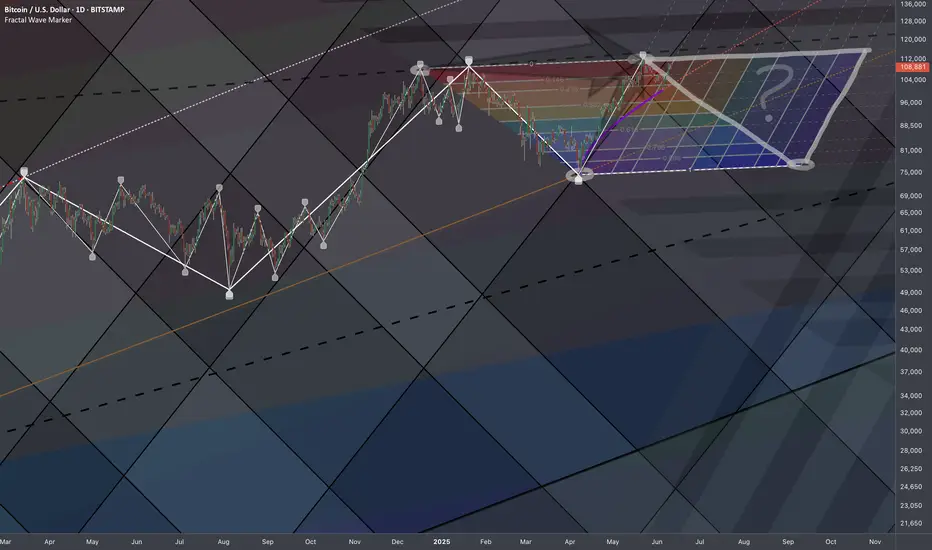
Bitcoin: Temporal ST FibsSo we have consecutive 2 rejections after registering Lower High on bigger scale..
Research Notes
Hypothetically, if it's about to fall based on similar flow of market reactions forming on top then this would be the closest fractal for bearish scenario.
Should be perceived as squeezed version of historic pattern. Not to scale on price axis solely, as increase in volatility can accelerate replication rate at places. The value is in temporal aspect like frequency of reversals.
To be sure I'd add a curve that describes current growth on smaller scale, and which could later on indicate a turning point.
Crossing under would confirm a scenario of bearish continuation.
Experiment
If we connect highs and map it to the local bottom, would the dimensions of original wave carry any structural significance?
Original Fib Channels (price oriented)
Temporal Fibs Sharing common coordinate to define them.
Yet to evaluate this approach for structural buildup. Fibs Channel lines are extended upwards in order to capture the reactions at any scenario.
Is NVDA Building Strength Before a Breakout?After cooling off from its $150 highs, NVIDIA (NVDA) is consolidating in the $140–$145 zone. While some traders fear the AI hype has peaked, others see this as the calm before another rally. With solid fundamentals, continued leadership in AI, and strong institutional backing, NVDA remains a name to watch closely.
🎯 Trade Setup:
Entry Points
✅ $142 – Current price zone (speculative buy)
✅ $135–$130 – Strong support (ideal swing entry)
✅ $125 (only if market-wide pullback occurs)
Profit Targets
📈 TP1: $149 – All-time high retest
🚀 TP2: $160 – Extension target
💰 TP3: $175+ – Long-term bullish scenario if momentum returns
💡 Strategy: This is a “buy-the-dip, trade-the-breakout” setup. Wait for confirmation above $146 if you're conservative, or accumulate gradually into weakness with a clear risk plan.
📌 Disclaimer: This is not financial advice. Always do your own research and use proper risk management. I'm sharing my personal view for educational purposes.

usdcad short in 1H*The content on this analysis is subject to change at any time without notice, and is provided for the sole purpose of assisting traders to make independent investment decisions.

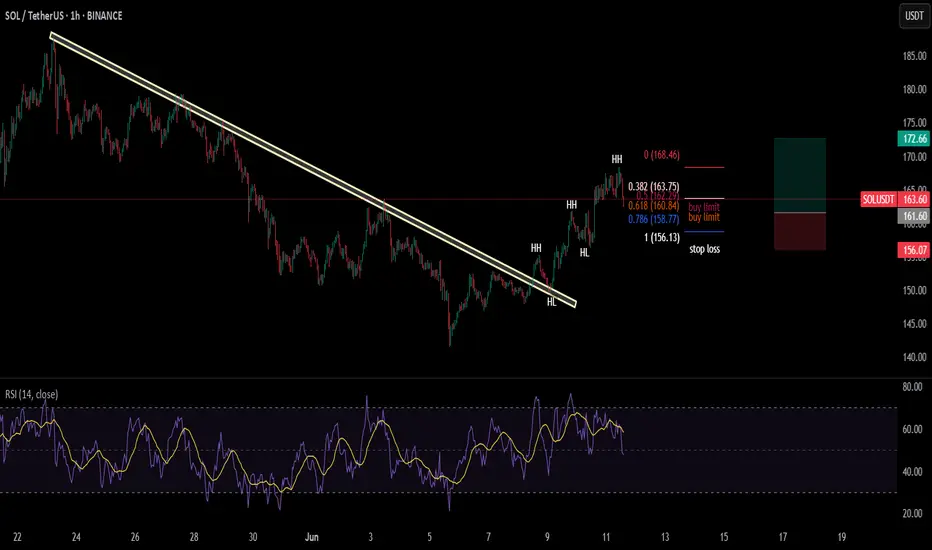
Solana(SOL) in bullish trend!!!the coin has broken the trendline and then also retested it to confirm its bullish rally right now the price action is simply following DOW theory by making HHs & HLs. I have opened a long position on the chart with 1:2 RR.