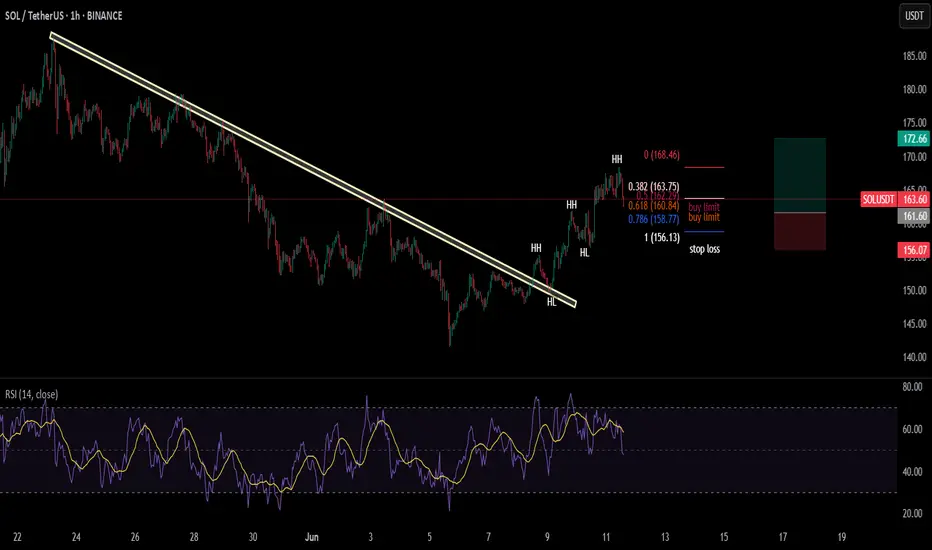
Solana(SOL) in bullish trend!!!the coin has broken the trendline and then also retested it to confirm its bullish rally right now the price action is simply following DOW theory by making HHs & HLs. I have opened a long position on the chart with 1:2 RR.
Fibonacci
CVX – Waiting for Pullback to 0.382 Before Targeting Gap FillsChevron (CVX) recently broke structure to the upside after holding a 1D demand zone near $136.
I'm now watching for a pullback toward the 0.382 retracement (~$141.80) of the recent impulse. This level aligns with the breakout area and offers a potential continuation setup.
🎯 Trade Setup:
Bias: Long (on retracement)
Entry zone: $141.80 – $142.00
Targets:
📌 Gap 1 → ~$158
📌 Gap 2 → ~$166
Invalidation: Close below $138 would negate the bullish thesis.
🧠 Context:
Structure flipped bullish after BoS.
Gaps above remain unfilled, acting as magnet zones.
Pullback to 0.382 = logical spot to join trend continuation.

USD/JPY – Short-term bullish structure within a larger downtrendThe USD/JPY pair has been in a well-established downtrend on the daily timeframe, showing consistent weakness over recent weeks.
Daily timeframe
The pair recently bounced from a significant and well-respected support zone around the $140.00 level. This area has historically provided a strong base for price, and once again, it appears to be holding as reliable support. Although the overall daily trend remains bearish, this bounce introduces the potential for a short-term retracement or consolidation phase.
Clear Rising Trendline on the 4H Chart
Zooming into the 4-hour timeframe, the price action shows a notable shift in momentum. A clear rising trendline has formed, acting as a dynamic support level and guiding the pair higher in the short term. As long as this trendline remains intact and unbroken, the bullish bias on the 4H remains valid. This upward move suggests a corrective phase within the broader daily downtrend, supported by increasing demand at higher lows.
Approaching Key Resistance — FVG and 0.786 Fibonacci Level
The pair is currently approaching a key resistance area near the $145.50 level. This zone aligns with the 4-hour Fair Value Gap (FVG) left by the previous strong downward move and coincides with the 0.786 Fibonacci retracement level, measured from the most recent swing high to swing low. A few days ago, price action briefly tested the lower boundary of this FVG but failed to fully fill the imbalance. Given the current momentum, another attempt to fill the entire FVG and test the 0.786 Fibonacci level is likely. This confluence of technical factors creates a strong resistance zone that could trigger significant price reactions, potentially resuming the broader downtrend.
Target Levels — Where to Look for Reversal or Profit-Taking
A sensible short-term target would be the previous lower high around the $144.00 level. This zone may serve as an initial resistance or take-profit area before price challenges the $145.50 resistance region. Additionally, if the pair breaks below the rising trendline on the 4H, this $144.00 zone could become a support level from which the pair might attempt another move higher.
Conclusion
To summarize, the USD/JPY pair remains in a broader daily downtrend but has shown signs of short-term strength after bouncing from the $140.00 support zone. On the 4-hour timeframe, bullish momentum is evident, supported by a rising trendline and upward movement toward a significant resistance area. Traders should closely watch the $145.50 zone, as it represents a confluence of the FVG and 0.786 Fibonacci retracement — both of which could act as a strong ceiling for price. Until the rising trendline breaks, the short-term outlook remains cautiously bullish, but the medium-term bias leans bearish if resistance holds and selling pressure resumes.
Disclosure: I am part of Trade Nation's Influencer program and receive a monthly fee for using their TradingView charts in my analysis.
Thanks for your support.
- Make sure to follow me so you don't miss out on the next analysis!
- Drop a like and leave a comment!

ULTA eyes on $455/457: Key support after Earnings spike and DipULTA had a good earnings report and spiked into resistance.
Now pulling back to first good support at $455.61-457.03
Look for this to hold, or dip below and then Break-n-Retest

How to Draw Support & Resistance In TradingViewLearn how to effectively identify, draw, and utilize support and resistance levels in TradingView with this comprehensive step-by-step tutorial. Whether you're a beginner trader or looking to refine your technical analysis skills, this video covers everything you need to know about one of the most fundamental concepts in trading.
What You'll Learn:
Understanding support and resistance: the foundation of technical analysis and price action trading
Step-by-step instructions for drawing horizontal support and resistance lines in TradingView
Creating support and resistance zones for more flexible trading approaches
Practical tips for using TradingView's drawing tools effectively
This tutorial may be helpful for day traders, swing traders, and investors using TradingView who want to improve their chart analysis skills. The techniques covered could help you make more informed entry and exit decisions by understanding where price might find support or encounter resistance.
Visit Optimus Futures to learn more about trading futures with TradingView: optimusfutures.com
Disclaimer:
There is a substantial risk of loss in futures trading. Past performance is not indicative of future results. Please trade only with risk capital. We are not responsible for any third-party links, comments, or content shared on TradingView. Any opinions, links, or messages posted by users on TradingView do not represent our views or recommendations. Please exercise your own judgment and due diligence when engaging with any external content or user commentary.
This video represents the opinion of Optimus Futures and is intended for educational purposes only. Chart interpretations are presented solely to illustrate objective technical concepts and should not be viewed as predictive of future market behavior. In our opinion, charts are analytical tools—not forecasting instruments. Market conditions are constantly evolving, and all trading decisions should be made independently, with careful consideration of individual risk tolerance and financial objectives.

ICP: $20-$30 Next as Major B-Wave 'c' Leg Unfolds?Hey TradingView Community! 👋
I'm refining my Elliott Wave analysis on ICP, and after further review, I'm now leaning towards a Major ABC Zigzag Correction playing out for ICP's long-term structure. This is a significant shift from my previous Flat idea, and it has different implications!
My Current Hypothesis: A Major ABC Zigzag Correction is in Play
Looking at the larger degree, I'm interpreting ICP's initial significant decline from its highs as Major Wave A of a larger ABC Zigzag Correction.
A standard Zigzag is a 5-3-5 wave structure:
Major Wave A: A 5-wave impulse down.
Major Wave B: A 3-wave correction (a-b-c) that retraces only a portion of Wave A (typically 38.2% to 61.8%).
Major Wave C: A 5-wave impulse down, often extending significantly below the end of Wave A.
Focusing on the Current Price Action: The Major Wave B
I believe we are currently within Major Wave B of this larger Zigzag pattern. This Major B-wave should be a 3-wave corrective bounce (a-b-c) against the prevailing downtrend.
My read on the internal structure of this Major B-wave is as follows:
'a' wave (of Major B): The initial upward move of this 'B' wave (which itself is a 3-wave corrective pattern, typically a zigzag or flat).
'b' wave (of Major B): The recent price action, including the strong pump over the last few days/weeks, appears to be the completion of the 'b' wave within Major Wave B. This 'b' wave, being a part of a corrective B-wave, would be a 3-wave counter-trend move against the direction of 'a'.
'c' wave (of Major B): If my count holds, we are now either starting or are very early into the 'c' wave of Major Wave B. This 'c' wave, if it conforms to a zigzag structure, should be a downward-moving 5-wave impulse. This implies a decline to complete the Major B-wave, before the larger Major C-wave unfolds.
Key Difference from the Flat Scenario:
In a Zigzag, the 'B' wave is a corrective pullback that does not retrace significantly (unlike a Flat where it can be 80-100%+). Also, the 'c' wave within the 'B' wave of a Zigzag is typically a 5-wave move in the opposite direction of the 'a' wave.
What Happens Next? (The Big Picture After Major B)
If this Major B-wave (composed of its internal a-b-c corrective pattern) successfully completes its downward journey (with the 'c' wave I'm anticipating), my analysis suggests we should then anticipate the start of Major Wave C of the larger Zigzag correction.
Major Wave C in a Zigzag is typically a powerful, impulsive 5-wave decline, often taking prices significantly below the lows of Major Wave A. This implies a potentially steep decline for ICP to complete the overall correctional pattern.
Crucial Invalidation Point! 🚩
As always, invalidation levels are paramount for risk management.
My primary count for this Major B-wave as a corrective structure is invalidated if:
ICP breaks significantly start level of the 'a' wave of Major B. If 'B' retraces too much of 'A', it breaks the typical Zigzag rule.
What are your thoughts, community?
Do you agree with this shift to a Major Zigzag correction?
Are you seeing the same internal structures for the 'B' wave?
What key levels are you watching for ICP given this potential scenario?
Let's discuss respectfully and help each other gain better insights into ICP's future movements!
#ICP #InternetComputer #ElliottWave #TechnicalAnalysis #CryptoTrading #PricePrediction #TradingView

Hyperliquid HYPE price analysis🧐 This idea regarding the price of #HYPE is based more on our "intuition", as the project's tokenomics are excellent:
there will be no major coin unlocks this year, and 97% of the commission income of the #hyperliquid exchange will be directed towards the repurchase of its own token.
🤖 We previously managed to “predict” the growth of the #HypeUSDT price, so maybe our forecast will come true again) 👇
❗️ But this is by no means a call to shorts!
This idea is more about the opportunity to buy #Hype for $22-23 for your investment portfolio.
_____________________
Did you like our analysis? Leave a comment, like, and follow to get more

PLTR eyes on $133.37 (again): Golden Genesis to BREAK this time?PLTR has made a round trip to our Golden Genesis.
Looking for a Break-and-Retest of this proven fib.
This time we should POP nicely after it breaks.
.
Full Frontal of its Genesis Fib:
See "Related Publications" for previous EXACT plots --------------->>>>>>>
.

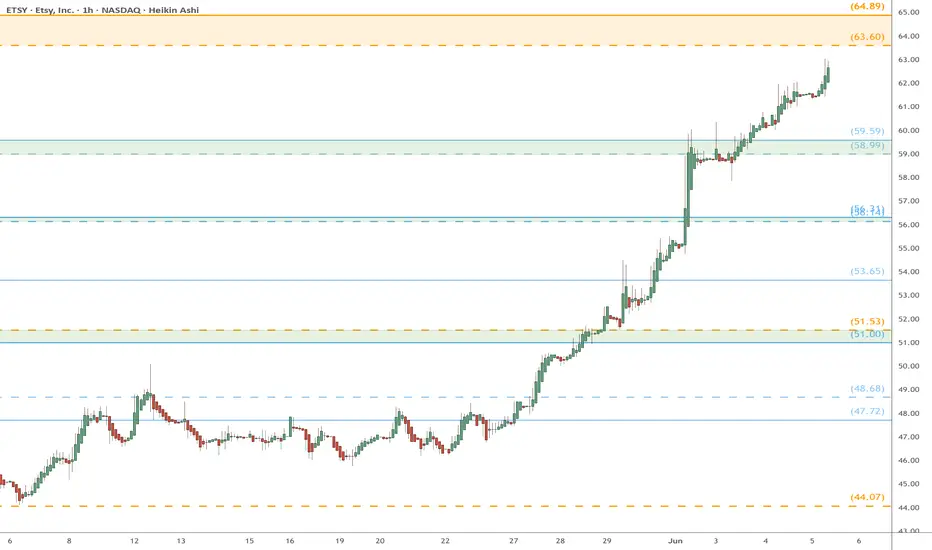
ETSY watch $64.xx: Double Golden zone to take some ProfitsETSY finally coming off its bottom and moving with gusto.
Approaching a Double-Golden fib zone at $63.60-64.89
Look for a Dip or Consolidation before uptrend resumes.
Bitcoin update - 120k soonFollowing my LINK chart, I stated that link tends to lead large Bitcoin pumps. We just noted a huge addition of liquidity to Bitcoin, which has flowed to Eth. Altcoins will follow in a few weeks. Bitcoin will probably be over 120k by end of month. I believe we see a local top around 140k.
BBWP has a lot of room
Stochastic can remain high for a long time for such a volatile asset class

SMR heads up at $40.78: Golden Genesis fib may cause a DIPSMR got a strong spike with all nuclear stocks.
It has just hit a Golden Genesis fib at $40.78.
Look for a Dip-to-Fib or Break-n-Retest for longs.
.
See "Related Publications" for previous plots including this BOTTOM CALL:
===========================================
.

607 EOD Non uclidean Mathematics Dual Band Fibbonaci📍 SPY is now accelerating through the 1.272–1.618 active band.
📍 607 is the next harmonic projection level on the mirrored Non-Euclidean spectrum.
📍 No rejection at Passive ⇒ continuation through Active ⇒ magnet to 607.
FAST watch $42.64/76: Double Golden zone holding up new ATH FAST has been grinding higher into ATH territory.
Struggling against Double Golden zone $42.64-42.76
Look for a Break-n-Retest as the likely next move.

DXY Monthly Analysis | Smart Money Concept + CHoCH BreakdownPair: US Dollar Index (DXY)
Timeframe: 1M (Monthly)
Strategy: Smart Money Concept (SMC) + Market Structure + Demand/Supply Zones
Bias: Bearish (Mid to Long-Term)
Breakdown:
Price reacted strongly from the monthly supply zone (110–104), showing signs of exhaustion.
Clear CHoCH (Change of Character) visible at the top structure, confirming loss of bullish intent.
Internal structure printed a liquidity sweep + FVG (Fair Value Gap) ➝ BOS ➝ lower low.
Current PA (price action) is targeting the first demand zone near 92–94, but major interest lies at the macro demand zone (85.100–84.900).
This level aligns with unmitigated historical demand and potential long-term accumulation range.
---
📅 Projection:
Expecting a continuation to the downside after retesting minor imbalance zones.
Potential multi-year bearish leg forming Wave 3 (macro view).
Ideal accumulation/buy zone: 85.100–84.900 – if structure supports.
---
📌 Key Levels to Watch:
Supply Zone: 110.800 – 104.600
CHoCH Level: ~102.300
Short-Term Demand: 92.000 – 94.000
Long-Term Demand (Institutional Interest): 85.100 – 84.900
---
💡 Conclusion: Smart Money has exited from premium pricing, and the macro structure aligns with a bearish transition. As long as price respects current lower highs, we may see a deeper correction or possible trend reversal near 85 levels.
---
🧠 #DXY #SmartMoney #CHoCH #ForexAnalysis #SupplyAndDemand #PriceAction #Forex #Month

ADA - hope for the best, plan for the worstDaily TF
Key level @ 0.73
Breaks above this level and the downtrend would send Cardano to 0.98
With mega-bullish target @ 2.20 - 2.40 price range.
5 touches @ 1.15 - 1.17 range which could be another Take-profit zone enroute. I think also a hedge-short bet at this level could work as a separate trade.
If we fail to break above 0.73 I believe the next natural move down would the 618 fib which has multiple touch points and could present a long entry @ 0.46

NQ (Nasdaq) Futures Trading Levels [6/11/25]For Day Traders, here's some trading levels for NQ Futures Trading for today. It's CPI day, so we should get some nice swings today. Trade carefully and trade smart!

GBPJPY for long 15m*The content on this analysis is subject to change at any time without notice, and is provided for the sole purpose of assisting traders to make independent investment decisions.

eurusd analyse 1H*The content on this analysis is subject to change at any time without notice, and is provided for the sole purpose of assisting traders to make independent investment decisions.
Gold CPI data forward-looking layout
📊Technical aspects
Gold trend from the perspective of technical analysis
From the daily technical chart, the gold price has experienced complex fluctuations. Although there have been ups and downs recently, it is still in a relatively high range. In terms of moving averages, short-term moving averages such as the 5-day moving average and the 10-day moving average show a certain entanglement trend, indicating that the short volume is relatively strong in the short term and the short trend is obvious.
From the MACD indicator, its double lines are running below the zero axis. Although the bar chart has shrunk, it still remains in the positive area, suggesting that the bullish force has weakened in the near future, but the overall market is still in a bearish market pattern, and the upward momentum is gradually fading. At present, the RSI value is further downward, indicating that the bearish force will gradually increase.
From the Bollinger Bands indicator, the gold price is currently running below the middle track of the Bollinger Bands, and the Bollinger Bands opening shows a slight narrowing sign. If the price falls below the middle track of the Bollinger Bands and continues to decline, the bearish trend may intensify. If the downward trend accelerates, gold still has a profit momentum of about $100
💰 Strategy Package
Short Position:3330-3340

Gold – Holding Mid-Week Gains Ahead of US CPIGold prices have moved slowly higher at the start of this week, moving from a Monday low at 3293, up to a Tuesday high of 3349, with prices slightly lower this morning at time of writing (3335 – 0700 BST).
Traders have already had much to consider this week, with heightened tensions in the Middle East and Ukraine to focus on, as well as the midnight conclusion of the eagerly awaited second round of trade talks between the US and China.
These talks finished after 20 hours of negotiation over 2 days and have seemingly produced a framework for President’s Trump and Xi to sign off on, with progress made in key areas (supply of rare earth metals and advanced technology), while leaving the wider issues for another time.
This leaves the May US CPI (inflation) release due out later today at 1330 BST as the next major scheduled event that could have an influence on where Gold moves into the Friday close. This release takes on more significance as it is the first month where President Trump's tariffs should start to impact prices paid by US consumers. The extent to which this shows up in the data could be the catalyst for a wider shift in risk sentiment and Gold prices depending on how far the print deviates from expectations.
Technical Update: Considering the Bollinger Mid-Average Support
Since the test of the psychological 3500 level on April 22nd, which held and reversed the sharp acceleration higher in Gold, the latest price activity has seen a consolidation extend, as can be seen on the chart below.
Of course, this type of consolidation can materialise following the type of aggressive activity as that seen into the April 22nd all-time high and may be viewed by traders as an on-going attempt to unwind upside price extremes.
However, traders are always looking forward for insight into where Gold may move next, especially with the May US CPI update release out later today.
With that in mind let’s consider what might be the potential support and resistance levels to focus on?
Potential Support Levels:
Within a positive trending condition such as that recently seen in Gold a rising Bollinger mid-average can provide a support level.
For Gold the mid-average currently stands at 3311 (see chart below) and this may represent a relevant first support level for traders to monitor on a closing basis.
While closing breaks below this type of support level offer no guarantee of further price declines, if it were to happen, it may lead to a more extended phase of price weakness.
This could in turn open further downside tests towards to the next potential support at 3289, which is equal to the 38.2% Fibonacci retracement of May 15th to June 3rd 2025 strength, and if this in turn were to break, the 61.8% retracement which stands at 3225.
Potential Resistance Levels:
While the support at 3311 offered by the rising Bollinger mid-average remains intact on a closing basis, it is possible further attempts at price strength may develop. This could lead to tests of higher resistance levels.
The first resistance level for traders to monitor could be 3392, which is the June 3rd session high. Any potential closing breaks above this resistance may be viewed as a more constructive development, which could then open the possibility of further attempts at price strength towards 3435, which is the May 6th session high (see chart above).
The material provided here has not been prepared in accordance with legal requirements designed to promote the independence of investment research and as such is considered to be a marketing communication. Whilst it is not subject to any prohibition on dealing ahead of the dissemination of investment research, we will not seek to take any advantage before providing it to our clients.
Pepperstone doesn’t represent that the material provided here is accurate, current or complete, and therefore shouldn’t be relied upon as such. The information, whether from a third party or not, isn’t to be considered as a recommendation; or an offer to buy or sell; or the solicitation of an offer to buy or sell any security, financial product or instrument; or to participate in any particular trading strategy. It does not take into account readers’ financial situation or investment objectives. We advise any readers of this content to seek their own advice. Without the approval of Pepperstone, reproduction or redistribution of this information isn’t permitted.

ELLIOTT WAVE EURUSD H4 update
EW Trade Set Up H4
minute wave (ii) running
is not already clear wheter it will develope in a sideway or sharp correction usually wave 2 is sharp in a zigzag to 0.618 retracement value.
short term key levels (area)
1.1445
1.1425
1.1365 POC
1.1320
1.1220
PI to 1.5$ ? :)Folks
Pi broke a major trendline on the 4H timeframe, and it's been crawling for a while.
This could be a preparation for a big rise!!
Buckle up, let's warm up the engines ;)
Good luck <3

Sell Gold Potentialas we can see, we have a good entry here with a small Stop Loss and a good target
Risky trade but worth it
Good Luck