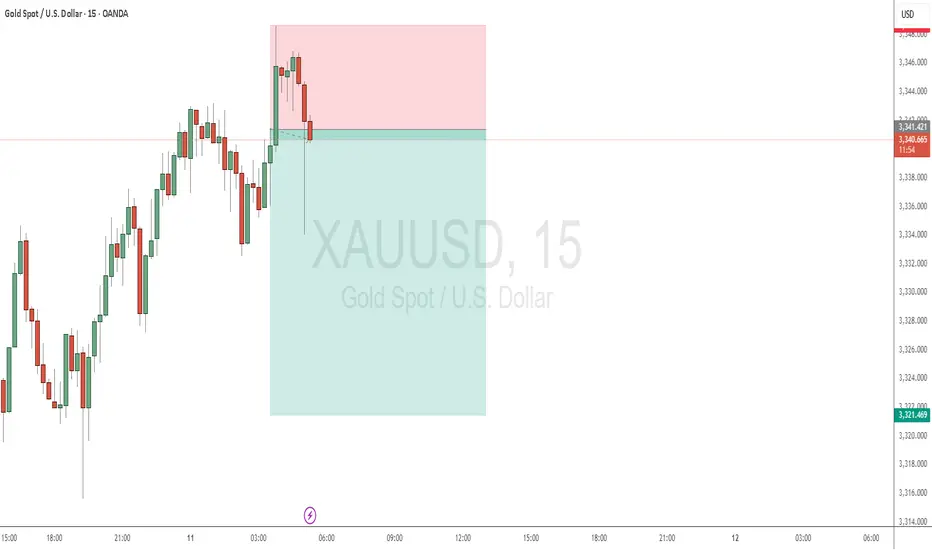
Sell Gold Potentialas we can see, we have a good entry here with a small Stop Loss and a good target
Risky trade but worth it
Good Luck
Fibonacci
NFLX – Bearish Divergence Playing Out, $1,177 in FocusThis is a follow-up to my June 7 post where I highlighted a high-probability bearish divergence setup on Netflix. Since then, price has rejected from the supply zone and is now hovering above the critical $1,177 structure support.
🔍 What’s changed:
📉 Bearish divergence confirmed — price rejected the highs
🔻 Momentum continues to fade, RSI rolling down from >73
📊 Price now sitting on $1,177, the last higher low
📏 Fibonacci levels mapped for potential continuation if broken
📐 Key Levels:
Structure Support (still holding): $1,177
Breakdown targets (Fibonacci):
0.382 → $1,094
0.5 → $1,042
0.618 → $990
Resistance to monitor for retest: $1,240–$1,260
🧠 Outlook:
If $1,177 holds → we may bounce temporarily.
If it breaks → bearish continuation likely, targeting 5–10% lower.
The bearish divergence setup is now in motion. Structure will determine whether this turns into a full breakdown.

Technical outlook for the EUR/JPYThe EUR/JPY pair is trading in a general uptrend, forming higher highs and higher lows, which maintains a bullish momentum.
What’s the pair’s next expected move?
As long as the 164.556 level is not broken with a 4-hour candle closing below it, any pullback remains corrective. The pair is likely to rebound from the 164.823 level to target the 165.510 level.

Htf Levels for gold In this video I look at the Higher term timeframe and mark what I consider to be 2 relevant levels looking forward for the month of June .
At the present we are sitting in the middle of the range but at some point we will break out or down from that range and the levels I have highlighted may be of guidance for gold traders.
In this video I use the Trend based Fib Extension, Tr pocket , vwap and standard fibs.

GBPUSD → Countertrend retest of support before growthFX:GBPUSD is forming a countertrend correction to the zone of interest and liquidity while the dollar is stagnating. The market is waiting for a fundamental driver.
Within the uptrend, a countertrend correction is forming towards the liquidity zone at 1.342. Against this backdrop, the dollar is correcting and contracting towards support. The currency pair's price continues to decline, but within the uptrend, breaking the local structure but not the market character. The focus is on the current trading range of 1.342 - 1.359. A retest of support could bring the price back to resistance.
Support levels: 1.3421, 1.339
Resistance levels: 1.3507, 1.3593
A quick retest of the liquidity zone at 1.3421, the inability of GBPUSD to continue falling, a false breakdown, and the price consolidating above 1.3421 would be a good indication that buyers are trying to hold the market. In this case, we could see the price strengthen.
Best regards, R. Linda!

NQ Power Range Report with FIB Ext - 6/11/2025 SessionCME_MINI:NQM2025
- PR High: 21983.75
- PR Low: 21937.00
- NZ Spread: 104.75
Key scheduled economic events:
08:30 | CPI (Core|YoY|MoM)
10:30 | Crude Oil Inventories
13:00 | 10-Year Note Auction
Session Open Stats (As of 12:25 AM 6/11)
- Session Open ATR: 380.78
- Volume: 24K
- Open Int: 272K
- Trend Grade: Neutral
- From BA ATH: -3.4% (Rounded)
Key Levels (Rounded - Think of these as ranges)
- Long: 22096
- Mid: 20383
- Short: 19246
Keep in mind this is not speculation or a prediction. Only a report of the Power Range with Fib extensions for target hunting. Do your DD! You determine your risk tolerance. You are fully capable of making your own decisions.
BA: Back Adjusted
BuZ/BeZ: Bull Zone / Bear Zone
NZ: Neutral Zone

VIC hope you are watching it.---
### 🇻🇳 Vin Group (VIC): An On-the-Ground Perspective from Vietnam 📈
After first visiting Vietnam in 2022, it became clear Vin Group is doing a lot of interesting things in Vietnam. To me, Vin Group seemed like an obvious thing to get exposure to a lot of the growth in Vietnam.
* **Accessibility Note:** HOSE:VIC is not easily available outside Vietnam, other than within Vietnamese indexes.
---
### The NASDAQ:VFS Anomaly & Free Float Insights
While in 2023, NASDAQ:VFS (VinFast) went to prices that defied all logic on US markets, US media most likely had no idea about $VIC. All you needed to do was see that HOSE:VIC held most of the NASDAQ:VFS shares (I thought it was 80%, but some suggestions indicate it might have been closer to 99%).
* **Key Takeaway:** A lot of retail investors won't understand free float risks. Starting my investing journey in the crypto space, I am well versed in dealing with assets with low float.
**(Image 1: VFS Marketcap)**
` `
*VFS Marketcap*
**(Image 2: VIC Marketcap & The Disconnect)**
` `
*VIC Marketcap – Note: VIC is in VND, VFS in USD. At one point, HOSE:VIC (approx. $12B USD) held VFS shares valued vastly higher, highlighting a significant market disconnect.*
> Needless to say, I wanted exposure to the things Vin Group was doing but chose to wait rather than join that insanity.
---
### An Expat's View: Seeing Vietnam's Transformation zmiany
As of Q4 2023, I moved to Vietnam. Living here, I get to see what's going on. Though I am still a foreigner, I get a different perspective.
> You see, when you look in the mirror every day, it's hard to see the changes. Then you see that family member you haven't seen in a while who still thinks you're 6, but you're actually 16. This is the case in Vietnam; many people came years ago and think it's the same or worse, or perhaps just watched a movie.
---
### Understanding Vietnam's Economic DNA: Đổi Mới and its People 🚀
To understand economics in Vietnam, you must first understand **Đổi Mới** – those changes are the start of economic success in Vietnam.
* **Human Capital:**
* First-generation university/college-educated individuals are very common.
* First-generation English, Chinese, or Korean speakers are gaining more access to markets outside Vietnam. (Korean is significant for FDI and cultural influence like movies/TV).
* **The Vietnamese Grit:** Many Vietnamese had very rough younger lives, and grit is a character trait they could win prizes for. It's seen in an extreme you don't find in other places. They just won't quit.
* **International Relations:** International business requires friendliness, and they choose to be friendly with everyone.
> Investing is about backing winners so that you can win with them.
---
### Navigating Vin Group's Diverse Portfolio:
**1. Real Estate Market & HOSE:VIC :**
The real estate market has struggled after the incident with Truong My Lan. A lot of stuff is empty and unsold. I have no clue when Vietnamese housing will top or bottom. While HOSE:VIC is largely made up of real estate, I believe that with lower mortgage rates now, they will sell properties they have and don't want, moving debt and assets off the balance sheet.
**2. VinFast ( NASDAQ:VFS ) & Xanh SM 🚕:**
* **Indonesian Expansion:** Watch for expansion into Indonesia – a massive, often underestimated market. (Unless it's someone who follows National GDP rankings globally and other macroeconomics.)
* **Path to Profitability:** VinFast just needs to reach a point where it's no longer cash-flow negative.
* **Long-Term Value:** The money will come from the Vision training they are doing.
* **Xanh SM (Taxi Service):**
* Now the largest taxi company in Vietnam.
* Creates organic demand (buy pressure) for VinFast cars.
* **A Better "Green" Product:** Unlike my experience in Canada where "green" options often felt forced and uncompetitive, Xanh SM is something you take because it's simply a *better product*. Smart, innovative people can make something "Green" AND better for the consumer. If you haven't tried it, just try it – it's better in every way (specifically the VinFast cars).
* **Scooter Critique:** The VinFast scooter needs a very simple change. The handle to hold onto the scooter located on the back is really bad. If I had one request, it would be to change that handle; it's awful. Put a large man in the front and try it.
**3. Vin Bus 🚌:**
Wow, the bus is the same quality as the newest buses I have seen in Canada, with one huge change: They are *extremely clean*. I have never been on a dirty VinBus.
**4. Vin Homes 🏡:**
Truly amazing, with great amenities. Lots of people run or play sports in the early morning. Mall access, VinBus access.
**5. Other Ventures:**
* **VinSchool & VinMec:** I've heard a lot of great stuff, but I haven't used them personally.
* **VinWonders Theme Park:** Also a lot of fun.
* **Vin Group Hotels:** Can also be really great.
---
### My Investment Journey with HOSE:VIC charted
**(Image 3: My Entry Point)**
` `
*So when did I actually get into Vin Group? In 2024.*
**(Image 4: Weekly MACD Signal)**
` `
*To me, this weekly MACD made it really obvious downside momentum was done. It was a matter of time to buy it up.*
* **Stop-Loss:** Having a stop-loss was also pretty obvious with the 2023 low.
* **Sentiment:** Sentiment was also really low.
* **Conviction:** Yet, I kept using the products of HOSE:VIC subsidiary companies, thinking the only way I see this company not doing better is if it goes bankrupt. The products are definitely amazing.
* **Debt vs. Rates:** If you looked at the company balance sheets, debt was a risk, but Vietnam changed its rates, and eventually, most nations will change their rates.
---
### Price Targets & Risk Management for HOSE:VIC 📈📉
**(Image 5: Long-Term View & Current RSI)**
` `
* **Long-Term Target:** I think this Company could go well over **200k VND**.
* **Short-Term Caution:** Price going straight up is risky. With 2024 buying, you could have a narrow stop-loss. In 2025, with this price movement, a simple weekly reversion to the mean would be very rough.
* **Overbought RSI:** The RSI hit 97 – not a number that makes me think, "Wow, lots of room to grow immediately."
> For me, I want to hold enough stock that I am okay if, before going to 200k VND, we first go back to 60k VND.
---
**Disclaimer:**
*The information provided in this post is for educational and informational purposes only. It does not constitute financial advice, investment recommendations, or a solicitation to buy or sell any financial instruments. All investments involve risk, and the past performance of a security, market, or trading strategy does not guarantee future results. I am not a financial advisor. Please conduct your own thorough research and consult with a qualified financial professional before making any investment decisions. You are solely responsible for any investment decisions you make.*

PayPal: Rebound or Rerun?PayPal in 2025: A breakout with backbone or just another spineless fintech?
PayPal is still in the rehabilitation ward after its fall from grace in 2021. Management drama, growth slowdown — the full fintech fatigue package. But something has shifted behind the scenes. A new CEO is cutting costs, AI integration is being whispered about, and earnings have started to surprise again. Wall Street pretends not to notice — but volume tells a different story.
Technically, we’re looking at a well-formed inverse head and shoulders. The neckline stretches from $72.00 to $74.76, aligning with the 0.5 Fibonacci level. A confirmed breakout above this zone opens the path to a clear target at $93.66 — the 1.0 Fibonacci extension. Multiple EMA clusters and strong pattern symmetry reinforce the setup. But no fairy tales here: the real entry comes after a retest. Without confirmation, it’s just another pretty formation for chart enthusiasts.

Upstart Stock Chart Fibonacci Analysis 061025Trading Idea
1) Find a FIBO slingshot
2) Check FIBO 61.80% level
3) Entry Point > 58/61.80%
Chart time frame:C
A) 15 min(1W-3M)
B) 1 hr(3M-6M)
C) 4 hr(6M-1year)
D) 1 day(1-3years)
Stock progress:B
A) Keep rising over 61.80% resistance
B) 61.80% resistance
C) 61.80% support
D) Hit the bottom
E) Hit the top
Stocks rise as they rise from support and fall from resistance. Our goal is to find a low support point and enter. It can be referred to as buying at the pullback point. The pullback point can be found with a Fibonacci extension of 61.80%. This is a step to find entry level. 1) Find a triangle (Fibonacci Speed Fan Line) that connects the high (resistance) and low (support) points of the stock in progress, where it is continuously expressed as a Slingshot, 2) and create a Fibonacci extension level for the first rising wave from the start point of slingshot pattern.
When the current price goes over 61.80% level , that can be a good entry point, especially if the SMA 100 and 200 curves are gathered together at 61.80%, it is a very good entry point.
As a great help, tradingview provides these Fibonacci speed fan lines and extension levels with ease. So if you use the Fibonacci fan line, the extension level, and the SMA 100/200 curve well, you can find an entry point for the stock market. At least you have to enter at this low point to avoid trading failure, and if you are skilled at entering this low point, with fibonacci6180 technique, your reading skill to chart will be greatly improved.
If you want to do day trading, please set the time frame to 5 minutes or 15 minutes, and you will see many of the low point of rising stocks.
If want to prefer long term range trading, you can set the time frame to 1 hr or 1 day.

XLV Stock Chart Fibonacci Analysis 061025Trading Idea
1) Find a FIBO slingshot
2) Check FIBO 61.80% level
3) Entry Point > 136/61.80%
Chart time frame:D
A) 15 min(1W-3M)
B) 1 hr(3M-6M)
C) 4 hr(6M-1year)
D) 1 day(1-3years)
Stock progress:B
A) Keep rising over 61.80% resistance
B) 61.80% resistance
C) 61.80% support
D) Hit the bottom
E) Hit the top
Stocks rise as they rise from support and fall from resistance. Our goal is to find a low support point and enter. It can be referred to as buying at the pullback point. The pullback point can be found with a Fibonacci extension of 61.80%. This is a step to find entry level. 1) Find a triangle (Fibonacci Speed Fan Line) that connects the high (resistance) and low (support) points of the stock in progress, where it is continuously expressed as a Slingshot, 2) and create a Fibonacci extension level for the first rising wave from the start point of slingshot pattern.
When the current price goes over 61.80% level , that can be a good entry point, especially if the SMA 100 and 200 curves are gathered together at 61.80%, it is a very good entry point.
As a great help, tradingview provides these Fibonacci speed fan lines and extension levels with ease. So if you use the Fibonacci fan line, the extension level, and the SMA 100/200 curve well, you can find an entry point for the stock market. At least you have to enter at this low point to avoid trading failure, and if you are skilled at entering this low point, with fibonacci6180 technique, your reading skill to chart will be greatly improved.
If you want to do day trading, please set the time frame to 5 minutes or 15 minutes, and you will see many of the low point of rising stocks.
If want to prefer long term range trading, you can set the time frame to 1 hr or 1 day.

Gold (XAUUSD) Weekly TF 2025Overview
This analysis outlines the structural Fibonacci confluences, scenario planning, and macro-aligned projections for Gold (XAUUSD) on the weekly timeframe. It integrates multi-layered Fibonacci extensions and retracements, mapping out key support and resistance levels, and proposes a nuanced primary scenario that includes both intermediate rallies and corrective movements.
Primary Scenario – Multi-Stage Movement Hypothesis
We anticipate that gold may initially extend higher from the current level (~$3,325) to test the 127.2% Fibonacci extension at $3,435, with the possibility of a further intermediate peak near $3,500. This level marks a psychological and technical resistance zone and could act as a temporary top.
Following this local peak, a corrective phase may unfold. This pullback could evolve into one of the two outlined correction scenarios:
1 TP Correction Scenario
Support Target: ~$2,950
Basis: 100% Fib extension confluence and prior resistance turned support
Expected Outcome: Price stabilizes at this level and resumes upward momentum
2 TP Correction Scenario
Support Target: ~$2,650
Basis: Strong historical structure + 100% Fib confluence from a broader cycle
Expected Outcome: This zone acts as a long-term demand accumulation area
Upon completion of the corrective structure, we expect gold to reinitiate its primary bullish trend.
Bullish Continuation Targets
TP1: ~$4,050 (161.8% Fibonacci extension)
TP2: ~$4,319 (261.8% Fibonacci extension)
These targets align with macroeconomic conditions, central bank accumulation trends, and long-term structural cycles.
Supporting Technicals
RSI: Holding above 50, indicating preserved bullish momentum
MACD: Positive crossover with widening histogram on weekly timeframe
Price Action: Strong support zone between $3,280–$3,300 aligning with 161.8% Fib retracement of the recent minor wave
Macro Fundamentals & Correlations
Central Bank Gold Demand: Sustained net buying by BRICS nations, particularly China and Russia, supports the structural bid on gold
Fed Policy: Market anticipates a prolonged pause or gradual rate cuts, favoring non-yielding assets like gold
DXY & US10Y Yields: Any further decline in DXY or softening yields would add tailwinds to gold
Crypto Correlation: During inflationary hedging or systemic risk periods, gold and crypto may correlate positively, especially with weakening USD
Intermarket Relationships: Gold, DXY, and TOTAL (Crypto Market Cap)
Gold vs. DXY (US Dollar Index)
Gold historically maintains an inverse correlation with DXY. A rising DXY tends to apply downward pressure on gold prices, while a falling DXY enhances gold's upside momentum.
Scenario Interactions:
If DXY breaks below 98, this could validate the bullish scenario for gold toward $3,435–$4,050.
If DXY rallies back above 100, it could trigger the correction scenarios ($2,950 or $2,650) in gold.
Gold vs. TOTAL (Crypto Market Cap)
Gold and TOTAL may show positive correlation during periods of USD weakening and global liquidity expansion.
Scenario Interactions:
If gold rallies toward $3,500 and TOTAL also breaks key resistance (e.g., $1.8T–$2T), this signals synchronized bullish risk appetite.
If gold corrects while TOTAL continues to rise, it could indicate rotation of liquidity from defensive to risk-on assets.
A simultaneous correction in both may occur if DXY strengthens aggressively or if macro shocks reduce global liquidity.
These intermarket relationships should be monitored continuously to assess the evolving macro context and validate the chosen scenario.
In the case of a gold correction toward $2,950 or $2,650, the impact on altcoins will hinge on the prevailing macroeconomic backdrop. If the correction stems from a healthy, technical rebalancing within a risk-on environment—without a concurrent surge in the U.S. dollar—it could signal a shift in capital from defensive assets like gold into more speculative plays, including altcoins. This type of capital rotation often benefits the crypto market, particularly if TOTAL (crypto market cap) holds or advances structurally. However, if the correction is caused by rising dollar strength, tightening financial conditions, or broader risk-off sentiment, altcoins may instead suffer alongside gold, as liquidity is withdrawn across the board. Therefore, the context and drivers behind gold’s correction are crucial in assessing its downstream effects on altcoin performance.
From a philosophical lens, gold's cyclical ascent and retreat mirrors the rhythm of nature and human experience—expansion, contraction, and renewal. Just as rivers carve valleys before surging toward the ocean, the market too must surrender gains to gather force. A correction in gold is not merely a financial event, but a moment of recalibration—an inhale before the next exhale of momentum. It invites reflection: whether wealth seeks refuge or ventures into risk, whether fear contracts or ambition expands. In this interplay, altcoins may inherit the restless spirit of capital in search of yield, as gold, the ancient anchor of value, briefly pauses in its timeless journey.
Conclusion
We present a multi-phased path for gold where:
An initial bullish breakout toward $3,435–$3,500 forms a short- to mid-term peak
A subsequent correction brings gold to either $2,950 or $2,650, depending on macro triggers
A renewed bull rally drives gold toward $4,050 and potentially $4,319 and beyond
This scenario reflects both the cyclical nature of market structure and the macro-fundamental backing that continues to support long-term gold strength.

GBPUSD ANALYSISAfter seeing the previous daily candle close bearish and below support, we could expect the move to continue since the 4hr also has structural type move pushing to the downside

EURJPY ANALYSISAfter seeing the previous daily candle close really bullish above 165.000 key weekly are, we could expect the bullish momentum to continue with confirmations on the 4hr structure making HH and HL

Chainlink Wave Analysis – 10 June 2025- Chainlink broke daily down channel
- Likely to rise to resistance level 16.00
Chainlink recently broke the resistance trendline of the daily down channel from the start of May (which encloses the previous minor ABC correction 2).
The breakout of this down channel accelerated the active impulse wave 3, which started earlier from the key support level 13.00.
Chainlink can be expected to rise to the next resistance level 16.00 (top of the minor correction ii from the end of May).

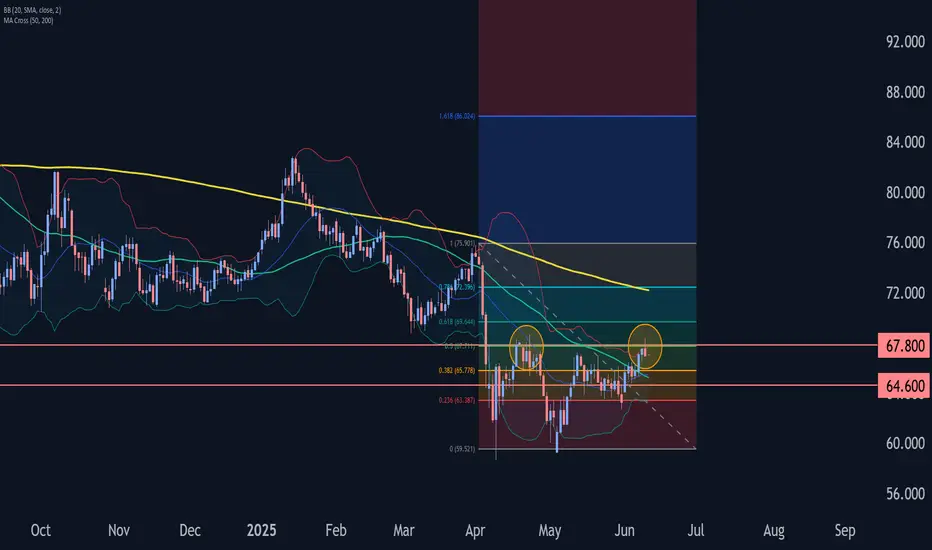
Brent crude oil Wave Analysis – 10 June 2025
- Brent crude oil reversed from key resistance level 67.80
- Likely to fall to support level 64.60.
Brent crude oil recently reversed down from the resistance area between the key resistance level 67.80 (which stopped wave (2) in the middle of April), upper daily Bollinger Band and the 61.8% Fibonacci correction of the downward impulse from January.
The downward reversal from this resistance area stopped the previous short-term ABC correction 2 from the start of May.
Given the strong daily downtrend, Brent crude oil can be expected to fall to the next support level 64.60.
Gold Futures – Double Top Leads to Bearish SetupGold Futures on the MCX chart is showing a classic Elliott Wave pattern in play. After forming a regular flat correction with a double top near the 99,300–99,200 zone, prices have started to drift lower. The double top structure—combined with the completion of Wave B—suggests that a Wave C decline is underway.
Wave A took the price down to around 90,890, followed by a corrective Wave B that failed to break the previous high convincingly.
The near-term outlook on the 4-hour timeframe remains bearish. I am anticipating five waves down within Wave C, which may take price back toward the previous Wave A low or slightly lower, possibly ending in a diagonal pattern, before a bullish reversal can be expected.
Disclaimer: This analysis is for educational purposes only and does not constitute investment advice. Please do your own research (DYOR) before making any trading decisions.

Public trade #15 - #TRX price analysis ( Tron )Earlier we wrote that if you want a stable crypto deposit growth, then invest in CRYPTOCAP:TRX
And although the fate of the project, roughly speaking, depends on one person, this person loves his creation!)
📊 Instead of a thousand words, just compare what happened to the alts in 2020 or 2022 and how stable the course and price vector of OKX:TRXUSDT was.
So, if you don't have #Tron in your investment portfolio yet, you should probably buy it at around $0.23. And buckets for “what if” in the range of $0.165-0.18
💰 Justin Sun - Just do it - #TRX to $1.7 !)
_____________________
Did you like our analysis? Leave a comment, like, and follow to get more

XRP Is Quiet—But This Calm Is Deceptive!Yello Paradisers—have you noticed how #XRP isn't on anyone’s radar right now? It’s not trending, no one’s hyping it, and to many, it’s just another slow mover. But here’s the thing: this type of silence often comes before the real storm, and the technical are quietly lining up.
💎#XRPUSDT is seeing now a period of consolidation The 1D bullish trend structure has been broken, and since then, price has entered into a tightening consolidation phase. While this may seem like indecision, it’s more likely a preparation for a potential high-probability upside expansion.
💎Price is now hovering just above the 0.786 Fibonacci level (~$2.25), which has started acting as a soft support. This is not a level to blindly trust, but one to monitor for reactions. If price manages to hold here, the next high-probability target lies at the short-term resistance around $2.5917, followed by major resistance at $2.9480, which aligns with a broader liquidity zone.
💎One key factor to keep in mind: the descending trendline liquidity has not been swept for a long time. That uncollected liquidity still sits just overhead, and markets usually don’t leave such inefficiencies behind forever. A spike toward that zone becomes increasingly probable the longer we range here.
💎At the same time, the MTF EMA on the daily chart is acting as a soft dynamic resistance, pushing the price down gradually. This setup increases the probability that we may see another touch of the 0.786 level. If that fails to hold decisively, the next likely area of interest will be the major support zone around $2.00.
💎Still, that major support remains unbroken and continues to act as a probability-backed structure for potential bullish defense. Until we get a clean daily candle close below $1.791 (invalidation level), this entire zone remains technically favorable for a potential reversal or liquidity sweep to the upside.
We are playing it safe right now, Paradisers. If you want to be consistently profitable, you need to be extremely patient and always wait only for the best, highest probability trading opportunities.
MyCryptoParadise
iFeel the success🌴

FIVE eyes on $63.00: Golden Genesis fib for 8% bounceFIVE trying to launch off Golden Genesis fib at $63.00
Target for bounce would be double fib at $68.46/54
Stop Loss just below Golden for high Risk -:- Reward.


Gold ShortAmidst dxy consolidation, gold seems to be forming a correction. A new trading range is formed between 3300 and 3340. Earlier in the session, false breakout of 3340 resistance formed, but price got rejected strongly. Our focus is on gold correcting itself, where it has the potential to tap the important support zone at 3275.
Levels to lookout for
Support: 3300, 3275
Resistance: 3340
Happy trading!

USD/JPY Battle Lines Drawn at Key Support- CPI on TapUSD/JPY plunged 4.4% into the close of May- The bears have been unable to break the 2021 original slope line, and the immediate focus is on a breakout of near-term range above support.
Initial weekly resistance is now eyed with the May high-week close (HWC) / 61.8% retracement of the May decline at 145.63-146.15- a breach / weekly close above this level would be needed to suggest a larger rebound is underway. Subsequent resistance objectives eyed at the December low / May high at 148.65 and the 52-week moving average (currently ~150.08). Ultimately a weekly close above the 61.8% retracement of the yearly range / 2022 & 2023 highs at 151.62/95 would be needed o threaten resumption of the broader multi-year uptrend in USD/JPY.
Weekly support rests with the yearly low-week close (LWC) at 143.68 with a close below the 2021 slope needed to fuel another run at key support (multi-year bullish invalidation) at the yearly lows near 139.58-140.49- a region defined by the December 2023 & 2024 lows and the 61.8% retracement of the 2023 advance. Look for a larger reaction there IF reached. Subsequent support objective seen at the 100% extension of the 2024 decline / July 2023 swing low around 136.51-137.24.
Bottom line: USD/JPY is trading just above multi-year uptrend support with a tight-range in view early in the month. From a trading standpoint, the immediate focus is on a breakout of the 143.68-146.15 range for guidance here with the yearly downtrend vulnerable while above the 2021 trendline. Look for the breakout in the days ahead.
-MB

LRCX watch $71.06-71.37: proven Fib Zone to Pump or DumpLRCX trying to recover along with the semis overall.
Currently testing a well proven zone at $71.06-71.37
Bulls want to push immediately without any dip here.
