Is the dollar's a trend or temporary?📊Technical Analysis for:
🕒 Timeframe:
📈 General Trend:
🔍 Analysis Summary:
We are currently observing a rebound from the 98.400 level.
• Major Support Level:
• Resistance Level:
• Technical Indicators: We note that this correction is due to divergence.
🎯 Suggested Entry and Exit Points:
✅ Entry: Upon a breakout/rebound from
⛔ Stop Loss:
🎯 Targets:
• First Target:
• Second Target:
📌 Recommendation:
– It is recommended to wait for confirmation of the technical signal before making a decision.
🛑 Disclaimer:
This analysis is not considered financial advice or a direct buy or sell recommendation. Do your own research and carefully consider risk management before making any decisions.
📥 Do you agree with this analysis? Share your opinion in the comments!
🔁 Follow me for daily analysis. ICEUS:DX1! ICEUS:DX1!
Fibonacci

TSM eyes on $194: Major Resistance to Break-n-Run or Dip-to-Buy TSM has been recovering with the chip sector.
Currently testing a Major Resistance zone.
Look for a Dip-to-Buy or Break-n-Retest entry.
$193.92-195.18 is the exact zone of concern.
$177.83-178.31 is the first major support.
$203.68-204.56 is the first resistance above.
========================================
.

ethusd for short *The content on this analysis is subject to change at any time without notice, and is provided for the sole purpose of assisting traders to make independent investment decisions.

AVGO heads up at $265: Take Profits at this Major Resistance ?AVGO has hit our target from last idea below.
Golden Covid + Minor Genesis at $264.56-265.27
Likely a dip here, or Break-n-Retest as surprise.
.
Last Plot that caught the BreakOut:
.
Hit the BOOST and FOLLOW to encourage more such a PRECISION
.

CRM watch $262-265: Major Support that will call Bull or BearCRM gave us a nice long and exit in last idea below.
Now retreated to a major support $262.54-265.36
Bottom bound is a Golden Genesis, most important.
Above this zone is Bull, below is more Bear hell.
Look for a clean bounce or rejection for next leg.
.
Last Plot that gave perfect Entry/Exit:
Earlier Plot that gave PERFECT BOTTOM entry:
Hit the Follow and Boost to encourage more such PRECISE trade calls.
.

CRWV eyes on $96.08: Golden Genesis fib Ends 60% trade now DIP? Our last plot (see below) gave a nice 66% gain.
Now looking for a decent dip to re-enter longs.
Each fib below is of interest, especially Goldens.
Previous trade that just closed with 66% gains
=============================================
.

MU eyes on $95/97: Double Golden fib zone Ultra-High GravityMU looking to exit a Double Golden zone $95.33-97.23
Break could pop to next resistance zone $109.41-111.38
Expecting some orbits around this ultra high gravity zone.
.
Previous Plot that caught the bottom EXACTLY:
==================================================
.

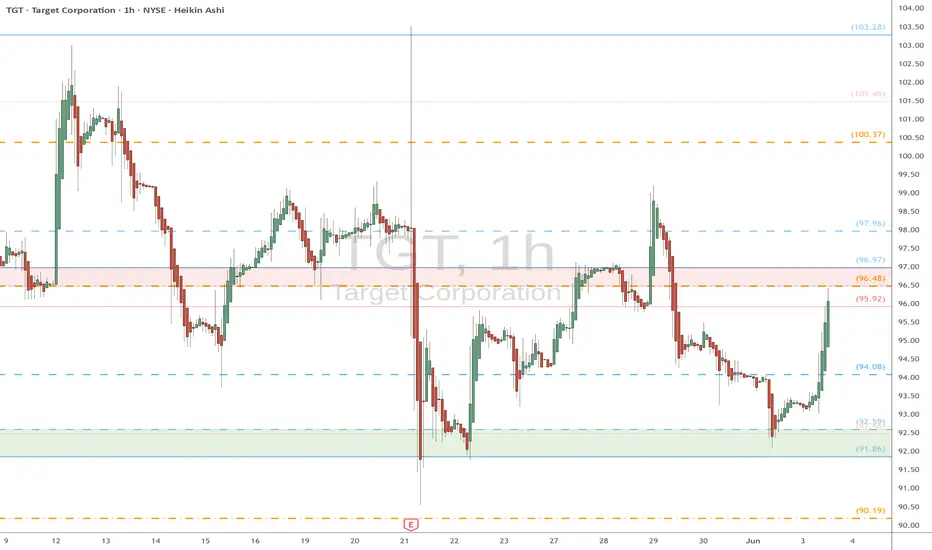
TGT watch $96.48/97: Proven Resistance could Mak / Break bottomTGT trying to paint a bottom to its huge downtrend.
About to test a key resistance zone at $96.48-96.97
Looking for Dip-to-Fib or Break-n-Retest to go long.
Delta Air Lines: Potential BreakoutDelta Air Lines has squeezed into a tight range, and some traders may think it’s breaking out.
The first pattern on today’s chart is the series of lower highs since May 13. DAL closed above that falling trend line last Friday, which could mean the resistance has been overcome.
The move resulted in a bullish outside week, immediately after a bullish inside week. That’s potentially consistent with prices consolidating before moving again.
Bollinger Band Width compression in the lower study may substantiate that view. (Notice the potential volatility squeeze taking shape.)
Next, the airline held a 50 percent retracement of its surge between April 30 and May 12. Does that suggest movement is pointing higher?
Finally, the 8-day exponential moving average (EMA) has stayed above the 21-day EMA. That may also be consistent with a short-term uptrend.
Check out TradingView's The Leap competition sponsored by TradeStation.
TradeStation has, for decades, advanced the trading industry, providing access to stocks, options and futures. If you're born to trade, we could be for you. See our Overview for more.
Past performance, whether actual or indicated by historical tests of strategies, is no guarantee of future performance or success. There is a possibility that you may sustain a loss equal to or greater than your entire investment regardless of which asset class you trade (equities, options or futures); therefore, you should not invest or risk money that you cannot afford to lose. Online trading is not suitable for all investors. View the document titled Characteristics and Risks of Standardized Options at www.TradeStation.com . Before trading any asset class, customers must read the relevant risk disclosure statements on www.TradeStation.com . System access and trade placement and execution may be delayed or fail due to market volatility and volume, quote delays, system and software errors, Internet traffic, outages and other factors.
Securities and futures trading is offered to self-directed customers by TradeStation Securities, Inc., a broker-dealer registered with the Securities and Exchange Commission and a futures commission merchant licensed with the Commodity Futures Trading Commission). TradeStation Securities is a member of the Financial Industry Regulatory Authority, the National Futures Association, and a number of exchanges.
TradeStation Securities, Inc. and TradeStation Technologies, Inc. are each wholly owned subsidiaries of TradeStation Group, Inc., both operating, and providing products and services, under the TradeStation brand and trademark. When applying for, or purchasing, accounts, subscriptions, products and services, it is important that you know which company you will be dealing with. Visit www.TradeStation.com for further important information explaining what this means.

US10Y (10-Year Treasury Yield) Weekly TF 2025
📊 Chart Context
Current Yield: \~4.50%
Current Structure: Consolidation below major Fibonacci resistance, with multiple breakout and breakdown paths marked by confluence zones.
📉 Key Technical Observations
Bullish Scenario – Yield Rally (Rate Hike Cycle / Inflation Surprise)
TP1 (5.0%): 0.00% Fib level, psychological resistance.
TP2 (6.10%): 38.2% Fib + -27% extension zone.
TP3 (7.70%–7.91%): Major Fib confluence (-61.8% & 48.60% projection)
Bearish Scenario – Yield Drop (Rate Cuts / Recession)
Support 1 (3.91%): 23.6% Fib retracement, key structural demand.
Support 2 (3.22%): 38.2% retracement
Support 3 (2.74%): 48.6%
Support 4 (2.12%): 61.8%
Support 5 (1.33%): 78.6%
Forecast Scenarios (Based on Arrow Colors & Pathways):
Red Boxes & Zones: Critical Resistance / Reaction Zones
These are strong confluence levels that may trigger pullbacks before continuation.
Green Arrows – Bullish Projection with Pullbacks
Scenario A: Price may rally toward the 5.0% TP1 zone but experience a temporary pullback before continuing toward the 6.10% TP2 zone.
Scenario B: After a short-term correction near 6.10%, if bullish momentum sustains, yield may spike toward the 7.70–7.91% TP3 zone.
These movements reflect a stair-step advance with corrective legs between key levels — bullish macro outlook with intermittent risk events.
Pink Arrows – Bearish Pullbacks & Correction Phases:
Scenario A: Initial rejection from current zone (~4.5%) may send yields down to the 3.91% support confluence.
Scenario B: If support at 3.91% fails, yields may further retrace to 3.22% or 2.74%, activating the lower fib retracement zones.
After stabilizing in these zones, a rebound may begin and realign with the broader bullish structure.
These pink arrows suggest that even in bullish macro cycles, the market may correct deeply before resuming its ascent.
Macro & Fundamental Context:
1.Fed Pivot Dynamics: With inflation cooling and unemployment ticking higher, markets price in possible Fed rate cuts by late 2025.
2.Bond Demand Outlook: Recession fears and de-risking scenarios trigger massive flows into long-term Treasuries, pulling yields lower.
3.Global Liquidity Conditions: Lower yields = increased liquidity = favorable conditions for crypto, gold, and risk assets.
4.Hawkish Risk: Any oil shock or CPI surprise can pause or reverse easing expectations, pushing yields up.
Effects on Gold & Crypto (as scenarios play out):
↗ If US10Y Yields RISE to 6% or 7.7% (TP2/TP3)
* Gold: Likely to suffer due to rising real yields; institutional demand weakens.
* Crypto: Bearish; risk assets sell off amid higher opportunity cost and tighter liquidity.
* Dollar (DXY): May strengthen, applying more pressure on gold & crypto.
* Strategy: Favor defensive positioning. Look for shorting rallies or hedge exposures in BTC, ETH, and high-beta alts.
↘ If US10Y Yields FALL toward 3.2% to 2.1% (Support 2–4):
* Gold: Bullish. Lower yields reduce holding costs and boost safe-haven appeal.
* Crypto: Bullish. Liquidity rotation into high-risk assets often follows easing cycles.
* DXY: Likely to weaken, further supporting BTC and altcoins.
* Strategy: Look to accumulate crypto during dips. Gold may offer breakout opportunities.
Rangebound Near 4.5% (Current Zone):
* Gold: Mixed; capped upside until clear direction emerges.
* Crypto: Ranges or whipsaws. Watch for breakout signals from BTC.D and TOTAL3.
* Strategy: Stay cautious. Monitor DXY and macro events for confirmation.
Related Reference Charts
TOTAL3 – Altcoin Market Cap Weekly
BTC.D – Bitcoin Dominance Weekly

LINK Bulls Building Toward a Chain ReactionIf you find this information inspiring/helpful, please consider a boost and follow! Any questions or comments, please leave a comment!
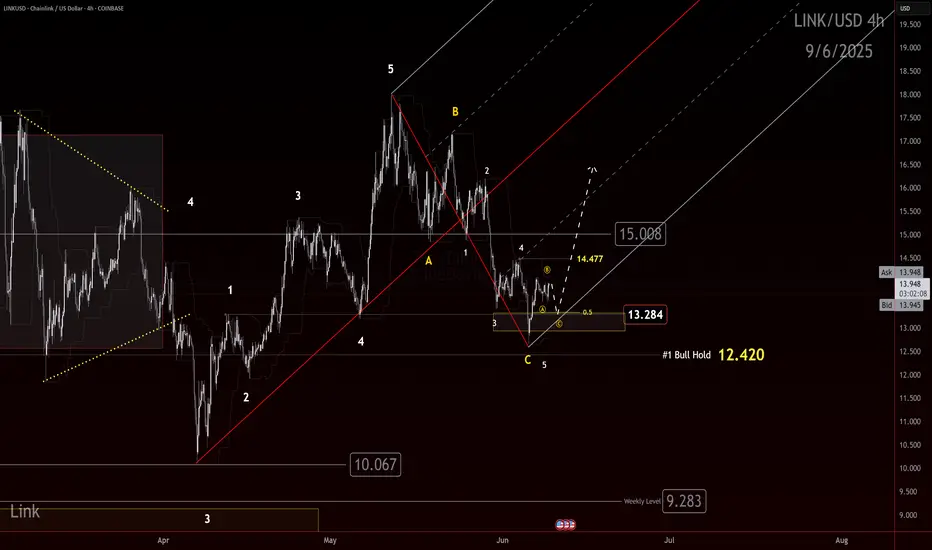
LINK just gave us a clean reaction out of an identified box. Bulls may finally be gaining control and a trend shift up is on the table.
We had eyes on this box for a potential reaction. The market delivered. Now bulls need to prove they can build on it. The first key is to defend 13.284. As long as this level holds, the case for a higher trend remains alive.
Next, bulls need to clear 14.47. That is the first smaller degree LH that must be taken out to confirm that buyers are pushing through the structure.
The big step remains 15.00. This has acted as a major flipping level. A true test for the bulls will be whether they can reclaim and hold above it. If they do, the door opens for stronger upside follow through.
The path is clear:
💥 Hold 13.284
💥 Break 14.47
💥 Reclaim 15.00
We will continue to track this closely with the Elliott Scanner mindset. If momentum picks up through these levels, this could become an attractive higher-degree setup.
Watch these levels carefully. Bulls have work to do, but the ingredients for a shift are building.
Trade Safe!
Trade Clarity!
QUBT watch $8.64/75: Key Resistance after quantum sector rallyQUBT rallied with all quantums, into a serious resistance.
Looking for a Dip to Buy or a Break-n-Retest entry for longs.
Some companies are apparently close to commercial usage.
$8.64-8.75 is the exact zone of interest.
$9.36 would be first target for a breakout.
$8.16 then 7.65 are supports below if needed.
====================================================
.

APP watch $310-313: Key Resistance before next Target at $350APP recovering well but watch key resistance at $310.50-313.14
If we get a dip then we look to support below at $289.58-291.00
Break and run has some blue skies above it until the $350 area.

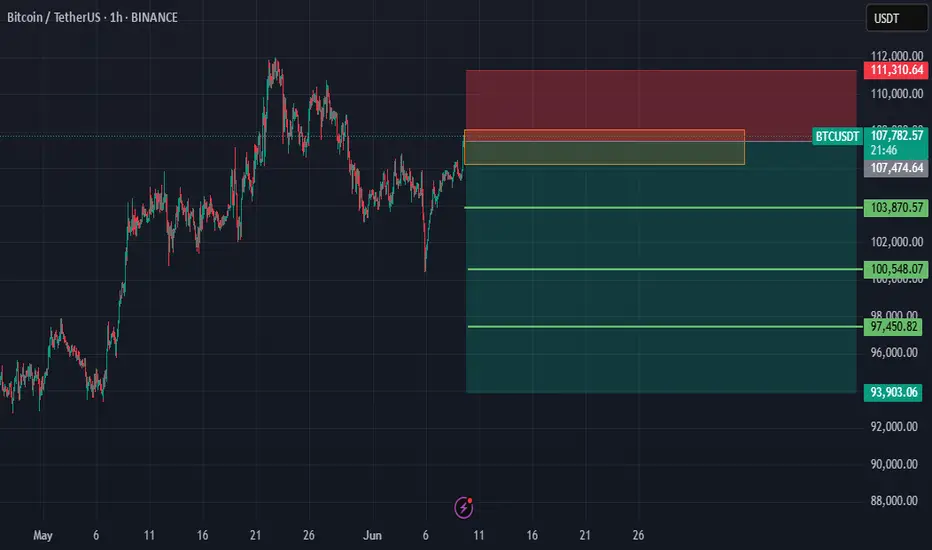
btcusd for short *The content on this analysis is subject to change at any time without notice, and is provided for the sole purpose of assisting traders to make independent investment decisions.
TRV eyes on $265.51: Golden Fib break should run to new ATHTRV has been struggling with a Golden Covid fib at $265.51.
This is a MAJOR landmark. proven by the many rejections.
This break may be the ONE, the one to hit All Time Highs.

AIQ eyes on $37: Double Fib resistance to Break or Reject AIQ recovering nicely after AI demand show to continue.
Currently testing a double fib resistance at $36.99-37.01
Looking for a Brean-n-Retest or if dips to $35.20-35.24

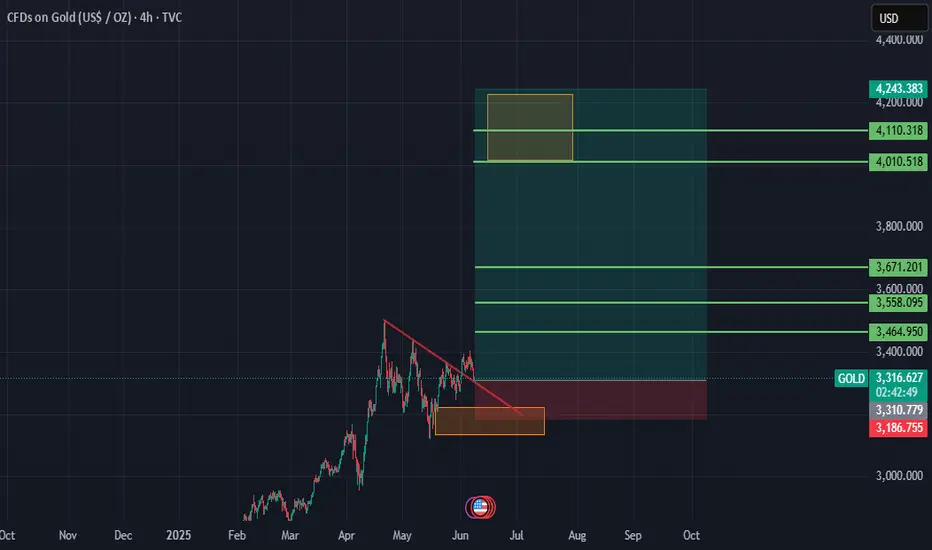
gold for long*The content on this analysis is subject to change at any time without notice, and is provided for the sole purpose of assisting traders to make independent investment decisions.
Could $COOKIEUSDT be heading to $0.60??BINANCE:COOKIEUSDT has been retracing for a while following massive bullish rally the previous month. It seems to have broken out of a bearish trendline after retesting a support zone twice and also putting a bullish divergence in the process. So lookout for a move to about $0.60
Be on the look out and expect minor retracements while at it, as there are some support and resistance zones it can bounce off from. These zones are already marked out in the setup.
Kindly support this analysis to enable it reach to other people, and do comment your thoughts.

H100 Group AB - Une bitcoin Treasury : 7.7 BTH100 Group AB is a company listed on Nasdaq First North (NGM Sweden), positioned as a Bitcoin Treasury Company. Formerly known as eBlitz Group, it recently underwent a major strategic pivot through a reverse merger with Healthy to 100 AS, a company focused on health, longevity, and sustainable technologies.
Since April 2025, H100 has started shifting to a hybrid model combining:
Bitcoin holdings as its primary treasury asset,
Investments in healthtech and wellness innovation,
An aggressive fundraising strategy through convertible loans to expand BTC acquisition and fund growth.
The company has recently accumulated 7.7 BTC in a “MicroStrategy-like” approach.
Trading volume has surged since May 2025.
The stock shows high volatility, often correlated with Bitcoin movements.
Active financing through convertibles (dilution risk to monitor).
Conclusion: H100 is a speculative play on Bitcoin performance, supported by a growth-oriented vision in the health and digital assets sectors.

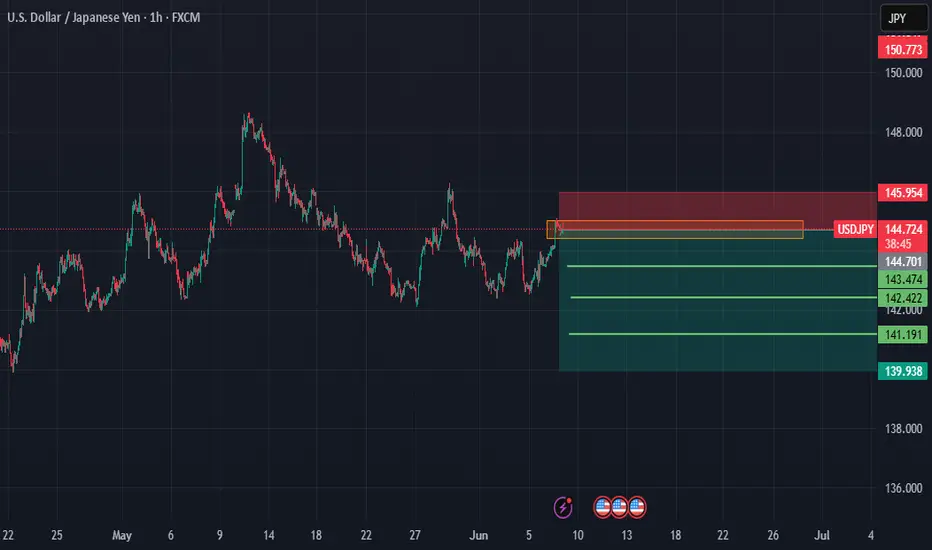
usdjpy for shoert *The content on this analysis is subject to change at any time without notice, and is provided for the sole purpose of assisting traders to make independent investment decisions.
This is a textbook example of price action on ETH!After trading back above it, the price retreated to the lower band of the range. This is exactly the price action we want to see in order to confirm that the break below the range was a fakeout. This suggests that we will most likely see a real breakout above the range at some point, with much upside potential.

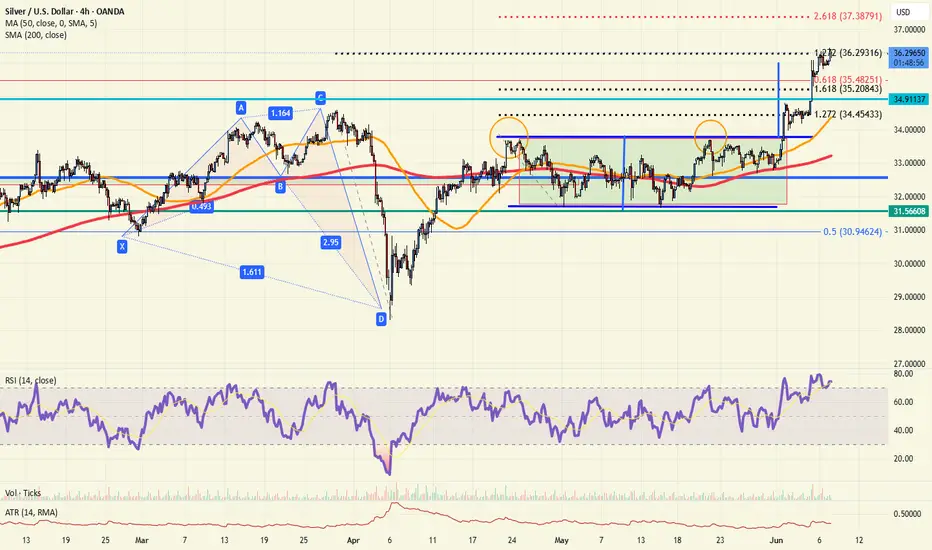
Silver breakout: Bullish, but divergentIntraday Update: Silver is at the 127% extension of the March 28th highs to April 7th lows, RSI is divergent which may stall the rally, but dips back to the 35.50 level should find buyers now.
Keep in mind we trade well above the long term 61.8% retracement still at 35.48
Pudgy Penguins PENGU Gearing Up for a +100% Move! 🐧 BINANCE:PENGUUSDT has completed its 5-wave advance from the April low (wave 1) and corrected with a 3-wave Zigzag structure in wave (2), reaching the buying area at equal legs $0.009 - $0.008.
🚀 Now, it's setting up for wave (3) higher, with an initial target at $0.022.
🌊 Are you positioned to catch the next wave higher?
