BTCUSD analysis for this cycle TopBTCUSD analysis for this cycle Top
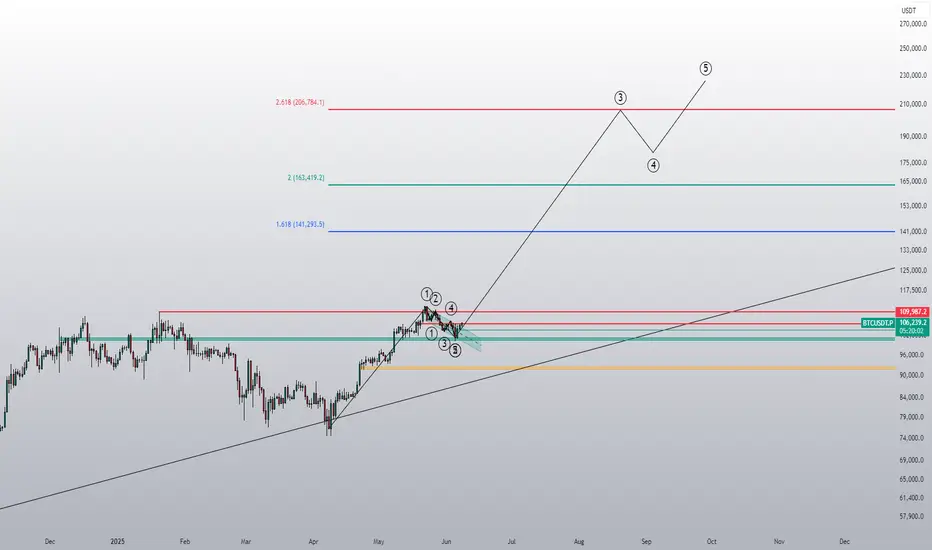
1. According to the Elliot wave it is the 5th wave of elliot theory
2. As per the time cycles Btc should define the top in the last quarter of this year possibility in (oct or nov)
3. And for the projection as always the Btc favourite patthen AB=CB is also in play.
4. Fib extension tool level 1.618
So as we can see if btc will play according to this analysis. As its always follows this same things again & again in all cycle. So we can expect the top somewhere around (165,000).
Fibonacci

S&P500 Short: Ending DiagonalHi all, over here, I presented a cleaned-up chart of the EW counts for S&P500 and gave 2 entry points for shorting. The most important points are here:
1. 5th wave completion (or completing)
2. Ending Diagonal: will follow a sharp move down.
Alternatively, you can wait for a breakdown of the lower trendline to short.
Good luck!

CHECK BTCUSD SIGNALS READ CAPTAIN BTCUSD buy Zone limit from order block
TRADE
Entry point 105.501
take profit Target 106.848
Stop loss 105.074
Follow money Menagment

GOLD → Correction to 3275FX:XAUUSD and medium-term outlook: Friday's strong unemployment data strengthened the dollar and triggered a sell-off in gold. Money is temporarily flowing out of the metal and into currencies and the stock market...
Technically, gold is still in a bullish phase on the global timeframe. Logically, the situation is more reminiscent of a countertrend correction of the zone of interest before continuing growth.
Despite the rise in the DXY after Friday's news, the dollar is still under pressure from Trump, who is pushing for an early interest rate cut. This move could significantly shake the market (dollar down, gold up)
Locally, on the hourly XAUUSD timeframe, we can clearly see how the price is breaking out of the uptrend, thereby triggering a downward impulse.
Resistance levels: 3325, 3343
Support levels: 3303, 3275
The liquidity level of 3300 could act as a magnet for the price, from which a correction to the resistance of the range of 3325 could form (liquidity hunt), but due to the change in the fundamental background, gold may continue its correction to 3275 (support zone) before a possible continuation of growth.
Best regards, R. Linda!

NQ Power Range Report with FIB Ext - 6/9/2025 SessionCME_MINI:NQM2025
- PR High: 21820.75
- PR Low: 21730.25
- NZ Spread: 202.25
No key scheduled economic events
Session Open Stats (As of 12:15 AM 6/9)
- Session Open ATR: 406.53
- Volume: 25K
- Open Int: 272K
- Trend Grade: Neutral
- From BA ATH: -4.0% (Rounded)
Key Levels (Rounded - Think of these as ranges)
- Long: 22096
- Mid: 20383
- Short: 19246
Keep in mind this is not speculation or a prediction. Only a report of the Power Range with Fib extensions for target hunting. Do your DD! You determine your risk tolerance. You are fully capable of making your own decisions.
BA: Back Adjusted
BuZ/BeZ: Bull Zone / Bear Zone
NZ: Neutral Zone

Gold Short Update: SL at 3340; TP at 3272Hi all, here is the video update to the short idea that I posted 19 hours ago. Main thing is the update of the Stop Loss and Take Profit.
Thank you.

audusd for sell *The content on this analysis is subject to change at any time without notice, and is provided for the sole purpose of assisting traders to make independent investment decisions.
BTC Multi-Timeframe Analysis: Daily, Weekly & Monthly Structure📊 CRYPTOCAP:BTC Daily Chart
Price bounced cleanly off the 0.236 Fibonacci retracement at $104.6 and is now pressing into local resistance.
– Heikin Ashi candles turned green
– RSI is curling upward
– MACD remains weak, no confirmation yet
Key levels:
→ Break above $106.3 could open the way to $112K
→ Drop below $104.6 puts $100K back in play
📅 All eyes on tonight’s weekly close.
A candle close above $106K would confirm strength into next week.

This could go very high!This looks incredibly like a full-send setup, which could blast Bitcoin up to 200k in a wave 3 of an Elliot wave pattern.
ETH Monthly Masterplan – From Frogs to the Moon 🐸 1. Miracle’s Take – The Legendary Leap Begins!
“Yo yo yo! Miracle here – and ETH just jumped outta the swamps straight into the order block jungle! 🐸💥”
We kissed the Order Block Buy zone like it’s the holy ground of memes 📿
3 Buy Levels hit – frogs were loading while normies were panicking 🤡
Price now chilling near the FOMO Zone – and trust me, most are buying now that it's too late
First target: 4,100 💸
Second target: 5,700+ – That’s where meme dreams start getting real!
Ultimate dream: 6,100+ – That’s a 250% leap... Frogs do fly 😤
💣 But yo, don’t ignore that massive Sell Order Block between 4.1K and 5K.
"Miracle Rule: You don't chase green candles – you trap 'em in green nets." 🎣
🟥 If we fall? Warning zone at 1.9K and hell no below 1.3K – STOP LOSS city 🚨
🐸 “ETH isn’t just a coin. It’s the ticket to meme kingdom.”
🔍 2. Clean Technical Breakdown – Analyst Mode
ETHUSD Monthly shows a textbook rebound from a long-term demand zone (“Order Block Buy”)
Three strong entry levels respected:
$2,142
$2,269
$2,394
Current price is retesting FOMO zone, last seen as local resistance
First Take Profit: $4,100
Second Take Profit: $5,718
Final fib extension target: $6,116 (254% from lows)
“Price must break and close above $2,750 with volume for confirmation.”
A monthly close below $1,942 is a strong warning
Final invalidation at $1,331, where structure is broken
“Respect the order blocks. Trade the levels.”
🎭 Which side are YOU on this time?
📈 Logical Analysis OR 🐸 Meme Mastery?
💬 Type #TeamMiracle or #TeamAnalyst and let the ETH prophecy unfold!
🎬 @TradeWithMky – where altcoins speak louder than Bitcoin!
#ETHtoMoon #EthereumMonthly #TradeWithMky #AltcoinSeason #MemeAnalysis

Will BTCUSD see $90,000 ever again? Phoenix FX mid term analysisBTCUSD 4-Hour Outlook: The Week Ahead
🔴 Key Resistance Zones
First Resistance
$107 000–$108 500
Recent swing highs where price stalled before the last leg down. Clearing and closing above $105 000 on the 4H would open the door toward this zone.
Final Resistance
$111 000–$113 000 (If broken expect a run to $115,000)
The all-time-high area. Heavy sell-side liquidity lives here and past price action shows repeated FVG fills and wicks into this region.
🔵 Critical Support & Buy Zones
Discount Buy Zone:
$92 000–$89 000 (50% at $89 150)
A deeper weekly FVG and longer-term trend support. The ultimate “buy the dip” area if the premium zone gives way.
Premium Buy Zone:
$100 000 – $99 000 (50% at $99 450)
A 4H Fair Value Gap that aligns with our higher-timeframe trend support. The recent bounce here signals strength—and a possible launchpad back into resistance.
📊 Weekly Price Action Scenarios
Bullish Theory:
If BTC can close cleanly above $105 000 on the 4H, look for a run into $107 000–$108 500 (First Resistance). A follow-through push could then target $111 000–$113 000 (Final Resistance) by week’s end with a potential further move to $115 000 where the 8 year trend will be tested again.
Bearish Theory:
Failure to reclaim $105 000, or a clear rejection in the $107 000–$108 500 zone, could usher in a retest of the Premium Buy Zone (~$100 000). A break below $99 000 would shift focus toward the Discount Buy Zone around $92 000–$89 000.
💡 Trade Ideas for the Week
Potential Long Ideas
Entry: 4H candle close above $105 000
Targets: First take-profit at $108 500; stretch target $112 000–$113 000
Stop-Loss: Below $103 000
Zone Re-Entry Long
Entry: Bullish 4H candle close in $100 000–$99 000
Targets: $107 000 then $112 000
Stop-Loss: Below $97 500
Potential Short Ideas
Entry: Bearish price action (e.g., engulfing candle or wick rejection) in $107 000–$108 500
Targets: $100 000→$92 000
Stop-Loss: Above $109 000
Just a Heads-Up:
This is my take on the charts—not gospel, not financial advice, and definitely not a crystal ball 🔮.
Trading is part skill, part patience, and part “what just happened?” 😅
We all see things a little differently, and that’s the beauty of it.
So if you’ve got a hot take, wild theory, or just want to drop some chart wisdom—hit the comments!
Let’s grow, learn, and laugh through the madness together. 🚀📈
Each one, teach one.
— Phoenix FX Team 🔥🦅

US100 (NASDAQ)🔍 Short-Term Outlook (Next Few Days)
✅ Structure Highlights:
Market recently made a Higher High (HH).
Strong bullish BOS occurred after reclaiming the $21,600 zone.
Currently trading inside the brown supply zone (Area of Interest) between $21,775–$21,839.
0.236 Fibonacci retracement is holding as support — a sign of bullish control.
🟢 Short-Term Bullish Signals:
Strong bullish momentum with higher lows and internal BOSs.
If price breaks and holds above $21,839, the market may rally toward:
Target 1: $22,000
Target 2: $22,150 (psychological level)
⚠️ Short-Term Bearish Scenario:
If price gets rejected from the current supply zone:
Pullback expected toward $21,670 (0.382) or $21,597 (0.5 Fib)
Further dip to $21,500–$21,400 is possible if buyers fail to hold structure
📉 Short-Term Bias: Bullish with a possible pullback
Enter long on pullback to 0.382–0.5 Fib with bullish confirmation
Avoid fresh longs if price shows strong rejection at $21,839
📈 Long-Term Outlook (1–4 Weeks)
🧠 Macro Trend:
Consistent bullish structure from below $19,000 in early May
Every correction has been shallow with strong continuation
As long as $21,400–$21,200 holds, macro trend remains bullish
📊 Long-Term Fib Zones:
0.5–0.618 retracement (strong accumulation zone) = $21,400–$21,250
Last confirmed Higher Low (HL) at ~$21,000, structure break below this = trend invalidation
💡 Long-Term Bias: Strong Bullish
Any correction into the green AOI or Fib zone = potential long opportunity
Next upside expansions could target:
$22,500
$23,000

Gold ShortThis week's focus is on Gold going short (despite it being bullish Globally). Fundamental pressure + technicals point towards it going further down. We might see gold touching 3300-3303 zone, a short bounce back from here to the 3325 zone, before it delves deep down towards the important zone at 3275. All zones confluence with fibonacci as well as shown.
Once this correction is completed, it can resume its global bull run.
Important levels to watch out for
Support: 3300-3303, 3275
Resistance: 3325, 3342-45
Happy trading!

GOLD🔍 Short-Term Outlook (Next Few Days)
✅ Structure Breakdown:
Price has made a lower high (LH) and recently a CHoCH to the downside, indicating short-term bearish pressure.
Rejection from the red supply zone / AOI near $3,375 confirms seller strength.
Price is currently retracing into the Fibonacci zone between 0.382–0.618, with:
0.5 Fib ≈ $3,308 (current level)
0.618 Fib ≈ $3,297
These levels align with possible short-term bounce or rejection zones.
⚠️ Key Short-Term Risks:
If price holds below $3,325, short-term momentum remains bearish.
A bounce could occur around $3,297–$3,275 (0.618 to 0.786 zone) due to demand and historical reaction.
📉 Short-Term Bias: Bearish → Potential Bullish Reversal
Expect possible continuation to $3,275 if support doesn't hold at 0.5 Fib.
Watch for bullish reversal structure (i.e., i-CHoCH + BOS) in the $3,275–$3,250 demand zone to go long.
📈 Long-Term Outlook (1–4 Weeks)
🧠 Macro Structure:
We’ve seen a solid uptrend from $3,125, but the market is stalling near previous highs.
The double top (HH) around $3,375–$3,400 and CHoCH down hint at potential trend exhaustion.
However, long-term trend is still intact unless price closes below $3,250.
📊 Fib Confluence and Demand:
Major demand zone (yellow AOI) sits at $3,250–$3,275.
This zone aligns with the 0.618–0.786 retracement, a typical long-term accumulation area.
💡 Long-Term Bias: Bullish (If $3,250 Holds)
If price reacts strongly from $3,250–$3,275 → Expect new rally attempts to:
$3,375 (resistance)
$3,400+ (breakout target)
If $3,250 breaks down, Gold could retrace to:
$3,200, and worst-case scenario, $3,125 (last strong demand area)
🧭 Key Levels to Watch
Type Price Note
Resistance $3,375 Key supply zone / top
Resistance $3,400–$3,425 Historical HH / exhaustion
Support $3,308–$3,297 0.5–0.618 Fib (short-term)
Support $3,275 0.786 Fib + AOI
Support $3,250 Break = trend shift
Major Support $3,125 Long-term bullish invalidation below here

BTC OUTLOOK🔍 Short-Term Outlook (Next Few Days)
Current Price: ~$105,754
Immediate Structure:
BTC just completed a bullish break of structure (BOS) and internal change of character (i-CHoCH) to the upside.
Price rebounded sharply from the demand zone (green AOI) around $101,000–$102,000.
Price is now approaching the 0.786 Fibonacci retracement level (~$106,150) from the recent swing high to swing low, which often acts as resistance.
Short-Term Bias: Bullish → Cautious
✅ Momentum is currently favoring bulls as shown by the breakout above recent structure.
⚠️ Resistance Zone between $106,150–$107,000 could cap this move, especially with past lower highs (LH) and supply visible in that region.
Short-term traders should watch for:
Break above $106,150 → continuation to $108,000–$110,000
Rejection at $106,150 → possible retest of $104,000–$103,000
📈 Long-Term Outlook (1–4 Weeks)
Market Structure:
Still showing signs of a macro lower high (LH) and lower low (LL) structure.
Despite recent bullish push, the macro downtrend from the highs around $112,000–$113,000 remains intact.
Reclaiming above $110,000 would be the first signal of a true trend reversal.
Fibonacci Confluence:
The current swing aligns with 0.618–0.786 retracement, which is often a “golden pocket” for institutional sell zones.
There’s a major supply zone (red AOI) that may keep price suppressed unless there's a breakout with high volume.
Long-Term Bias: Bearish Unless Proven Otherwise
Unless BTC breaks and holds above $110,000, long-term trend remains down.
Likely scenario:
Range-bound between $101,000–$107,000
Break below $101,000 → opens the door to $98,000 or lower
Break above $107,000 and hold → potential reversal towards $112,000

PEPEUSD going to moon according to my analysis. {08/june/2025}Educational Analysis says that PEPEUSD may give trend Trading opportunities from this range, according to my technical analysis.
Broker - binance
So, my analysis is based on a top-down approach from weekly to trend range to internal trend range.
So my analysis comprises of two structures: 1) Break of structure on weekly range and 2) Trading Range to fill the remaining fair value gap
Let's see what this pair brings to the table for us in the future.
Please check the comment section to see how this turned out.
DISCLAIMER:-
This is not an entry signal. THIS IS FOR EDUCATIONAL PURPOSES ONLY.
I HAVE NO CONCERNS WITH YOUR PROFIT OR LOSS,
Happy Trading, Fx Dollars.

Altseason Index Proxy (TOTAL3 / BTC.D) Weekly TF
Symbol & Timeframe:
* **Symbol**: CRYPTOCAP\:TOTAL3 / CRYPTOCAP\:BTC.D
* **Timeframe**: Weekly (1W),
* **Purpose**: A clean, data-driven proxy for detecting altseason momentum
Technical Structure:
✅ Key Support Zones
* **13.47B (61.8% Fib)**: Critical golden zone; current price consolidation area
* **12.45B (50.0% Fib)**: Lower bound of golden zone
* **11.00B**: Historical support zone
* **8.15B (0.0%)**: Absolute bottom of retracement range
🔹 Hidden Bullish Divergence
* **MACD Histogram & Signal Lines** show hidden bullish divergence
* Price action forming **higher lows** while MACD makes **lower lows**
* Indicates trend continuation potential
🔢 Fibonacci Targets
TP1: 16.8B (100.0%)
TP2: 22.2B (161.8%)
TP3: 30.7B (261.8%)
🔄 Expected Path
* Potential short-term correction toward 12.4B followed by a breakout
* Bullish continuation path sketched with progressive Fib targets
📈 Macro & Fundamental Confluence
📉 Liquidity and Monetary Easing
* Global monetary policy is easing (e.g., Fed pivot expected mid-2025)
* Increased liquidity historically precedes strong altcoin rallies
BTC Dominance Decline
* BTC.D rolling down from long-term highs
* Signals beginning of capital rotation into altcoins
🚀 Emerging Narratives
* Rise of L2s (e.g., Base, zkSync), AI tokens, real-world asset protocols
* Fresh narratives tend to amplify altseason rotations
💼 Institutional Tailwinds
* Spot ETH ETF approvals pave way for alt ETF flows
* Regulatory clarity expected to reduce uncertainty in late 2025
Related Reference Charts:
🌐 TOTAL3 (Altcoin Market Cap Excluding BTC & ETH)
📊 BTC Dominance (BTC.D)
These charts offer standalone confirmation of:
Altcoin strength forming on TOTAL3
BTC dominance facing structural resistance
Composite Altseason Thesis:
1. Liquidity injections + halving = BTC rally
2. BTC.D breakdown + TOTAL3 support = altcoin strength
3. Technical confirmations: hidden divergence, fib confluence
4. Narrative and regulatory catalysts = widespread rotation
**Conclusion**:
We are entering a prime zone for altseason acceleration. Price reclaim above 13.47B and continued BTC.D drop will validate bullish thesis. Monitor closely for breakouts past TP1 and momentum into TP2/TP3.
📌 Current status:
- Price rebounding in the 12.45–13.47B Fibonacci zone (50–61.8%)
- Hidden bullish divergence on MACD + ascending price structure
- BTC.D has rolled off 65% resistance — suggesting capital rotation
📊 Altseason Thesis:
1. Post-halving BTC rally → profit dispersion into altcoins
2. Macro conditions (Fed pivot, record liquidity) enabling risk-on environment
3. Technical confirmation via index momentum and fib structure
4. Narrative tailwinds: Layer-2 adoption, AI-crypto, altcoin ETF catalysts
📈 Targets:
- TP1 @ 16.8B (100% Fib)
- TP2 @ 22.2B (161.8% Fib)
- TP3 @ 30.7B (261.8% Fib)
🟢 Key support: 12.45–13.47B zone; breakout + BTC.D collapse = altseason trigger.

ETH.D (Ethereum Dominance) Weekly TF 2025
Summary:
Ethereum Dominance (ETH.D) has likely bottomed after retracing to its 78.6% Fibonacci level (~6.59%) and is showing early signs of a structural reversal. With institutional inflows, growing staking adoption, and key upcoming Ethereum upgrades, ETH.D may reclaim significant market dominance over the next 12–18 months. Our chart anticipates a bounce-pullback-rebound structure, aiming for 3 target zones: TP1 (23.5%), TP2 (30.8%), and TP3 (39%).
Contextual Market Alignment:
This ETH.D bullish bias aligns strongly with our broader market outlook:
TOTAL Market Cap Analysis → Bullish breakout structure, indicating overall crypto expansion.
TOTAL2 (Altcoin Market Cap Ex-BTC) → Bullish retracement completion and extension targets active.
BTC.D (Bitcoin Dominance) → Bearish confluence zone, suggesting Bitcoin may underperform versus ETH and altcoins, freeing up dominance space for ETH.D to rise.
Chart Context:
This weekly ETH.D chart uses a Fibonacci retracement from the top (~30.81%) to bottom (0%) to identify potential reversal zones. The dominance hit a key support area at the 78.6% Fib retracement (6.59%), showing a reaction that may develop into a reversal. The roadmap includes:
Rebound toward TP1 (23.54% = 23.5%)
Minor correction or consolidation
Breakout continuation toward TP2 (0.0% = 30.8%)
Extension leg targeting TP3 (–27% = 39%)
Key Technical Observations:
Support Levels:
78.60% = 6.59% (bottom support)
88.60%=3.5%
Possible Resistances:
61.80% = 11.77%
48.60% = 15.84%
38.20% = 19.04%
Resistance & TPs:
TP1: 23.54% (23.6% Fib)
TP2: 30.81% (Full retrace = 0%)
TP3: 39.13% (–27% extension)
Current level: ~9.36%
Clear bullish structure with a “bounce–pullback–rebound” sequence
Indicators:
Fibonacci retracements from ~30.81% to 0%
Structural pattern: rounded bottom / double bottom
Hidden bullish divergence forming on weekly timeframe
Fundamental Context:
Institutional Inflows & ETF Dynamics:
Since July 2024’s launch of spot Ether ETFs, inflows have been strong with a 15-day streak totaling approximately $837 million (~25% of total net inflows).
Recently, the SEC approved options trading on spot ETH ETFs (e.g., BlackRock, Grayscale), deepening liquidity and offering hedging mechanisms.
BlackRock is now pushing to add staking functionality allowing yield generation within an ETF wrapper. If approved, this could markedly increase demand.
Staking Growth & On-Chain Supply Dynamics:
27% of ETH is already staked, and ETF inflows could lift that by >10%.
A staking ETF would institutionalize ETH staking: more capital locked, less circulating supply → supply constraints could support dominance and valuation.
Ethereum Backbone in DeFi & RWA:
Ethereum still leads the Real-World Asset (RWA) space: over 50% market share and ~$5–6 billion in assets tokenized on-chain.
Its core infrastructure underlies the majority of DeFi, smart contracts, and stablecoins, reinforcing ETH.D’s structural resilience.
Network Upgrades & Tech Progress:
The Pectra upgrade (mid-2025) is on the horizon, introducing EIP-7251/7702, improving validator flexibility and network usability.
Combined with recent Dencun improvements, Ethereum is becoming cheaper and more efficient, boosting adoption in L2 ecosystems.
Price action & on-chain indicators:
ETH price has surged ~46% in the past 30 days, driven by ETF demand; some analyst forecasts target $3,000–5,000 year-end.
The withdrawal of ~$1.2 billion ETH from exchanges suggests increasing long-term holdings and less selling pressure.
Integrating with Your Technical Setup:
Level: 78.6%–61.8% bounce zones (6–11%)
Fundamental Support: Institutional re-entry via ETFs often begins with accumulation near support.
Level: TP1 at 23.6% (23.5%)
Fundamental Support: Could coincide with ETF inflows + early vesting of staking narratives.
Level: TP2 (~30.8%)
Fundamental Support: Full retrace driven by mass ETF adoption, options trading, and upgrade momentum.
Level: TP3 >39% (–27% ext.)
Fundamental Support: If staking ETF and yield-bearing structures go live, ETH.D could reach new dominance highs.
Summary of Fundamental Catalysts:
Spot ETH ETF inflows (~$800 M), with options exposure adding liquidity.
Upcoming staking ETF (BlackRock, Grayscale) with >10% locked-up supply implications.
Ethereum remains the DeFi and RWA backbone, sustaining structural demand.
Protocol upgrades (Pectra, Dencun) enhance scalability and adoption.
On-chain withdrawal trends show growing holder conviction.
Narrative / Bias & Strategy Implication:
ETH.D has likely completed its correction and is primed for a staged bullish reversal, mirroring prior cycles. The chart forecasts a rally toward TP1, where some short-term profit-taking and rotation to alts may occur (Alts season). Following that, a retrace may set up the next impulsive move to reclaim lost dominance and eventually challenge prior highs.
Time Horizon: Mid-2025 to late 2026

BTC.D (Dominance at Critical Fibonacci Confluence) 2025 Weekly
**Summary:**
Bitcoin Dominance (BTC.D) is testing a major Fibonacci confluence near the 66% level. This zone historically acts as a major pivot and may signal either a continued dominance rally or a potential reversal setting the stage for altseason. We use three layered Fibonacci retracements to outline dominant trend zones, key resistances, and projected targets.
**Chart Context:**
This chart uses **three distinct Fibonacci retracements** to map the historical and projected behavior of BTC dominance:
1. **Primary Fib** (100% to 0%): Captures the macro move from BTC.D \~100% down to its 0% level at \~0%, which aligns with the first altseason (2018–2019).
2. **Secondary Fib** (100% to 38.88%): Maps the first bearish wave to identify potential recovery levels. BTC.D retraced up to the 61.8% (\~73.68%) but failed to break further.
3. **Third or the Current Fib** (73.68% to 38.88%): Maps the latest bearish fall in BTC.D. As of now, BTC.D is hovering at the 78.6% retracement level of this move, indicating heavy resistance.
**Key Technical Observations:**
* **1st TP (Resistance):** 66% — Strong Fibonacci confluence zone:
* Fib2 48.6% ≈ Fib3 78.6%
* Major reversal zone historically
* **2nd TP (Support):** 52.25% — Multi-Fib confluence:
* Fib1 48.6%, Fib2 61.8%, Fib3 38.2%
* **3rd TP (Ultimate Support):** 38.88% — Historical BTC.D bottom, aligned with the first altseason.
* Intermediate Fibonacci confluences between 48%–60% serve as layered support during decline phases.
**Indicators:**
* No external indicators used; pure multi-frame Fibonacci confluence.
* Price action structure and historical patterns highlight potential market rotation zones.
**Fundamental Context:**
The current phase of the market reflects increasing speculative activity in altcoins while Bitcoin consolidates. Historically, high BTC.D correlates with Bitcoin-led rallies, while a sharp drop often triggers altseason.
* Growing inflows into ETH, SOL, and possible now XRP, and mid-cap alts suggest capital rotation.
* If BTC.D faces rejection from 66%, the market could enter a new altseason phase.
* Macro tailwinds (e.g., easing monetary policy, risk-on sentiment) support altcoin performance in the medium term.
**Philosophical or Narrative View:**
BTC.D acts as a barometer of market risk preference. As confidence expands beyond Bitcoin, money flows into altcoins—like tributaries branching off the main river. The rejection from major confluences signals this psychological shift, marking phases of creative decentralization.
**Related Reference Charts:**
* TOTAL3 Fibonacci Setup (Altcoin market excluding BTC & ETH):
* TOTAL2 Correction Probabilities:
**Bias & Strategy Implication:**
* **Primary Bias:** Bearish rejection from 66% followed by correction to 52% and potentially 38.88%.
* **Alternative Scenario:** Brief breach above 66% before reversal.
* Traders may consider rotating into altcoin exposure if BTC.D confirms reversal at the confluence zone.
**Time Horizon:**
* Mid to Long Term (1–6 months outlook)
* Weekly timeframe tracking
**Notes & Disclaimers:**
* This analysis is for educational purposes. Market conditions may evolve rapidly.
* Use proper risk management when acting on dominance signals.

IREDA forming Shark pattern now towards 200 and the further....IREDA has formed shark pattern it has immediate target for 200. with SL 190.
Consecutive 3 candles close above 200 will open targets as below,
Target2: 210 / 220
Also in short term it will have possible target for 250 / 270.

Nifty Smallcap Index can go upto 12,450With Fib retracement Nifty small cap index has potential to reach 12,450
It will have following targets.
14800 / 14100 / 13850 / 13100 / 12450

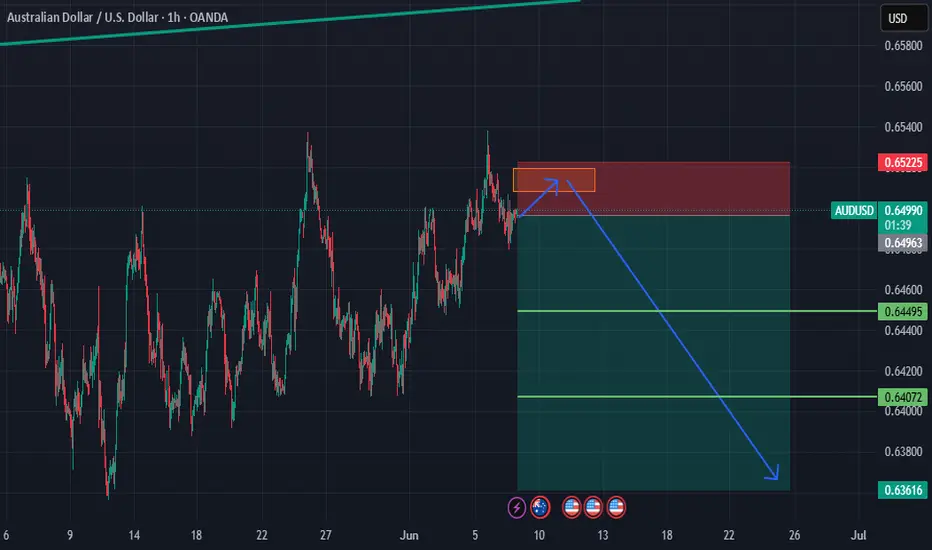
AUDUSD Start of Week DropThe DXY index has double bottomed and left a significant FVG at around $1. This has yet to retrace and market sentiment towards seeing the USD under $1 is tough. This FVG is likely to close this week as a last ditch effort to hold the USD at $1 level.
We have business confidence news twice in the early week that is likely to be not great pressuring the AUD, then later on we have USD news that will likely hold or temporarily bolster USD confidence. This is the dynamics shift that I believe will bring on that larger retracement of the USD to $1.
Be ready for a significant rejection once we arrive at the FVG though.

“Bitcoin Elliott Wave Breakdown – Watch This Before You Trade!”🔹 “This is Bitcoin on the 1-Month chart. What we see here is a completed 5-wave impulse according to Elliott Wave Theory.”
🔹 “Wave (1) through (5) is now complete, and the price has hit the upper boundary of a long-term ascending channel.”
🔹 “Notice this red zone? This is a strong resistance area between $76K and $111K. We might be forming a potential double top pattern here.”
🔹 “Divergence is likely forming in wave 5 — a classic sign of weakening momentum.”
🔹 “If we break below $66K and then $53K, expect a drop all the way to the $31K zone.”
🔹 “This level aligns with the bottom of the channel and possibly the 0.618 Fibonacci retracement.”
🔹 “Final target? $31,000 – a key zone for accumulation before the next major cycle.”
