Nifty Smallcap Index can go upto 12,450With Fib retracement Nifty small cap index has potential to reach 12,450
It will have following targets.
14800 / 14100 / 13850 / 13100 / 12450
Fibonacci

AUDUSD Start of Week DropThe DXY index has double bottomed and left a significant FVG at around $1. This has yet to retrace and market sentiment towards seeing the USD under $1 is tough. This FVG is likely to close this week as a last ditch effort to hold the USD at $1 level.
We have business confidence news twice in the early week that is likely to be not great pressuring the AUD, then later on we have USD news that will likely hold or temporarily bolster USD confidence. This is the dynamics shift that I believe will bring on that larger retracement of the USD to $1.
Be ready for a significant rejection once we arrive at the FVG though.

“Bitcoin Elliott Wave Breakdown – Watch This Before You Trade!”🔹 “This is Bitcoin on the 1-Month chart. What we see here is a completed 5-wave impulse according to Elliott Wave Theory.”
🔹 “Wave (1) through (5) is now complete, and the price has hit the upper boundary of a long-term ascending channel.”
🔹 “Notice this red zone? This is a strong resistance area between $76K and $111K. We might be forming a potential double top pattern here.”
🔹 “Divergence is likely forming in wave 5 — a classic sign of weakening momentum.”
🔹 “If we break below $66K and then $53K, expect a drop all the way to the $31K zone.”
🔹 “This level aligns with the bottom of the channel and possibly the 0.618 Fibonacci retracement.”
🔹 “Final target? $31,000 – a key zone for accumulation before the next major cycle.”

HYPE Precision Trading — Pattern, Patience, ProfitHYPE has shown strong performance since early April, maintaining a clear uptrend. Currently, the market is consolidating in a range between $30 and $40 and it’s setting up for something interesting. Let’s break it down and map the next high-probability trade setup.
Potential Gartley Harmonic Pattern Forming
A valid Gartley pattern may be developing, with point D potentially forming around the $29 level. This zone offers solid confluence for a high-probability long setup.
🟢 Long Setup – Gartley Harmonic Pattern Completion at around $29
Confluences around $29–$28.3:
0.786 Fib retracement of XA
Trend-based Fib Extension 1:1
Negative -0.618 Fib as take-profit level for prior short
Anchored VWAP (0.666 band multiplier) acting as dynamic support
200/233 EMA/SMA support on the 4H TF
FVG + liquidity pool resting just below $30
Setup Details:
Entry Zone: Trend-based Fib Extension 1:1 or laddered between $30–$28.3
Stop Loss: Below $27.5 (adjust depending on where point D forms)
Target: 0.618 of CD leg ≈ $34.4
R:R ≈ 1:3.5
🔴 Short Setup – look for rejection at $36
0.618 Fib retracement from previous move (ideal short entry)
Invalidation: Break above $38.2 (above point C)
Take Profit: $30-$29
R:R ≈ 1:3
🧠 Educational Insight:
Harmonic patterns offer precise entries and targets by aligning Fibonacci levels with market structure. When combined with tools like Anchored VWAP and liquidity analysis, they become powerful tools for swing trading.
Summary:
HYPE continues to respect structure beautifully, offering repeated swing setups in the 10%–20% range. With clear fib symmetry and predictable behaviour, it remains one of the more technically sound altcoins.
Stay patient. Wait for the pattern to complete. As always — don’t chase. Let the trade come to you.
_________________________________
If you found this helpful, leave a like and comment below! Got requests for the next technical analysis? Let me know.

Update Plan Gold next weekGold next week the main plan is to sell down. We will wait for a good entry point from there to get the shortest stop loss. If the price does not recover to sell, I will wait for a confirmation signal and accept to sell at a low price. Target is 3178

TOTAL3 – Altcoin Market Cap (Excluding BTC & ETH) Weekly TF 2025Summary
TOTAL3 is currently in a macro bullish cycle and undergoing a mid-cycle correction. The chart presents a Fibonacci-based structural roadmap with 3 Take Profit zones, identifying both correction supports and breakout targets. There is a high probability of short-term downside before a significant altcoin rally.
🌈 Chart Context
Fibonacci Retracement (Primary Leg):
100% = 285.3B
0% = 1.16T
Trend-Based Fibonacci Extension
A = 285.3B
B = 775B
C = 464.11B
Price as of analysis: ~845.62B
Key Technical Observations
Support Levels:
61.8% Fib Retracement = 618.5B
Strong Confluence Zone: Fib Retracement 48% + Fib Extension 50–61.8% (highlighted on chart)
38.2% Fib Retracement = 824.38B
Resistance Levels:
951.73B: 23.6% Retracement + 100% Extension – strong resistance zone before $1T psychological level
Take Profit Zones:
1 TP (1.1T) = 127% Fib Extension (Upper leg of parallel extension)
2 TP (1.28T) = 161.8% Fib Extension
3 TP (1.7T) = -61.8% Fib Retracement and 261.8% Extension confluence zone
Pattern & Projection:
The structure suggests a possible correction phase to lower support before continuation.
Bullish continuation expected after corrective phase, shown by the projected dotted path.
Structure: Bullish structure with healthy correction in mid-phase of the macro uptrend.
Fundamental Context
Altcoin Lag: TOTAL3 remains ~40% below its ATH, while BTC and ETH have already hit new highs.
Liquidity Shift Expected: Altcoin capital rotation tends to follow after BTC dominance stabilizes or drops.
Macro Backdrop:
Fed expected to cut rates later in 2025
Stablecoin legislation and ETF narratives building altcoin trust
Institutional inflows are slowly diversifying from BTC to ETH and large-cap alts
These suggest a possible shakeout or deeper correction before altseason breakout gains strength.
Bias & Strategy Implication:
Bias: Bullish Mid-Term – Correction Before Continuation
Expected Scenario: Pullback to strong support zones (824B–733B–618B), followed by a sustained breakout toward 1.1T–1.7T.
Invalidation: Weekly close below 618B may delay bullish structure and extend correction.
Strategy:
Long entries at support zones with tight invalidation
Scaling out near TP1, TP2, TP3 based on market momentum
Philosophical View
Patience is the virtue of the second leg in a macro trend. The correction serves to eject the impatient, reprice risk, and strengthen conviction. When TOTAL3 rises from deep support, it will be not just price but confidence that rallies.
Related Reference Charts
TOTAL Market Cap Structural Breakout:
TOTAL2 Altcoin Chart with Fibonacci Path:
✅ Tags
#TOTAL3 #AltcoinMarket #Fibonacci #Altseason #CryptoCorrection #CryptoMacro #TechnicalAnalysis #BullishOutlook #MidCycleCorrection #Crypto2025
⚠️ Notes & Disclaimers
This analysis is educational and not financial advice. Markets are inherently risky. Do your own research and manage risk accordingly.

Ratos AB - one of my favourite chartsRatos has provided us with a golden opportunity to at least double our investment if my Elliott wave count remains correct.
After a 14 year corrective move that ended in 2020 the company value has increased impulsively - white ((1)) - and peaked in august 2021. Since then we have seen overlapping price action in what I believe is a wxy formation which recently ended in April this year. (78.6 fib retracement)
Since then price has climbed fast again which makes me believe that we start the wave 3 which potentially could stretch out to new ATHs. However, if the bearish momentum remains we could at least see the stock reach twice its current valuation.
Let´s hope for the best and keep an eye on potential pullbacks to enter long again.
P.S. If I´m not mistaken the fundamentals are also indicating a bright future for the company.

BTC liquidity zones4H timeframe
Inverted chart
Looking at a short entry @ 107,000.
618 fib @ 107,400
Liquidity Zone @ 107,000 - 107,600
Take profit approx 98,000
This move would fill a Fair Value Gap a grab liquidity in the 98,000 - 100,000 price range.
Retracement worth - 7.7% from entry.

Bitcoin Short to 97 K into cpi numbersIn this video I cover the recent drop and what might be a great short on the horizon . With the V shape recovery off the defended 100K level I anticipate that we continue the move up to 107/108K before hitting some resistance and pushing us back into the range leading into the midweek . With cpi news release this could be the catalyst needed to trap the late buyers and drop us into 96K zone .
This video provides context and theory for this short setup so I encourage you to watch .
Tools used Vwap , volume profile , Fibonacci pulls .
Thanks for watching
Any questions please leave in the comments
Safe trading

Double Bottom Formation--PRAJ- Bullish view- Educational PurposeBOUNCE FROM WEEKLY DEMAND ZONE- BULLISH VIEW
EDUCATIONAL PURPOSE
Bounce back observed from weekly demand zone after consolidation of 6-7 weeks
Double bottom formation in weekly demand zone indicates reversal of downtrend
Fibo Targets
Target 1 : 1088 (116%) (24-36 months)--June 2028
Target 2 : 1240 (146%) (40-60 months)-- June 2030
stoploss : Weekly closing below 438 (-15%)
RR ratio 1:10
Only long term view, Need to clear hurdle near 825-850

ICP Short-term Elliot Wave OutlookICP is currently in a short to medium term corrective phase which has lasted just over half of the year. In terms of the macro count it is completing the last leg of a zig-zag in either wave 2 or a B wave.
The primary count in white shows an impulse with five completed waves. In this instance, it is a non-overlapping ending diagonal where the impulse sub-divides as 3-3-3-3-3.
This count is invalidated if price breaks below the aqua support area.
If price breaks below the aqua support area the alternate count becomes more likely. In this case, we're looking at a WXYXZ in yellow.
Z can be either 61.8, 100.0, 123.6 or 138.2 of W. Generally targeting the area between 4.22 and 3.35

BULLISH VIEW IN RK FORGING--Educational PurposeBOUNCE FROM WEEKLY DEMAND ZONE- BULLISH VIEW-
Educational purpose
Bounced after testing weekly demand zone and consolidating for 3 weeks suggest reversal of the downtrend.
Fibo targets :
Target 1 : 1375 (108%) (24-30 months)
Target 2 : 1570 (137%) (36-42 months)
SL : weekly closing below 550 (-17%)
RR Ratio : 1:8.5
Only long term view

Gold liquidity run short setup In this video I map out the range using the fixed range tool and talk about the possibility of a liquidity run on the weekly high before dropping back inside the range .
Engineering liquidity at the range value area high and thus heightening the expectation for more upside continuation , take the liquidity at $3392 and pull back below the vah *Value area high and head down to fill the new week open gap and the new monthly pivots $3297 and the poc * point of control and remain rangebound.
We all know that nothing is set in stone and this is just an idea out of many but its something to consider .
Set alerts and wait for reaction and lower time frame for confirmation
Thanks for your support

Gold liquidity run short setup Update 2This video is an update on the Gold setup that was posted on the 4/06/25
I cover the price action and discuss what I think will be occurring from this point onwards as
part of the original trading plan .

Bitcoin is ready for next ATH (if 100K hold)As we can see two major daily supports now can pump the price and one is 93K$ support zone and the other which is already started to pump the price is 100K$ support zone and price above these supports means market is still bullish and we can expect more rise and gain like the green arrows on chart to the new ATH.
DISCLAIMER: ((trade based on your own decision))
<<press like👍 if you enjoy💚

BITCOIN → Correction. The hunt for liquidity...BINANCE:BTCUSDT.P is recovering after liquidity was captured in the 100K zone. Locally, the technical situation is controversial despite the global bullish trend
Bitcoin is changing its market character (106700) and breaking the bullish structure (103000) during a correction phase. As part of the downward momentum, the movement is testing liquidity below the 100700 support level. As for the liquidation, there are several reasons: the conflict between Trump and Musk, strangely enough, the market reacted with a fall; the liquidation of whales, history repeats itself...
Traders are buying back Bitcoin, but technically the market has a bearish structure. Locally, there is a bearish trend, and a countertrend correction, “liquidity hunting,” is forming.
Ahead lies a fairly important zone of 105900-106700. The initial retest may end in a false breakout, as there may not be enough potential for continued growth (after a strong buyback).
Resistance levels: 105,900, 106,720, 110,400
Support levels: 103000, 101400, 100K
After a correction from 105900, which could target half (0.5) of the trading range, the market may attempt to return to a bullish phase, provided that the bulls keep the price from falling and do not allow it to update local lows. That is, in the short term, I expect a decline from 105900 to 103000, but further, if the price starts to return to 105500-105900, there may be chances for growth to 110K
Best regards, R. Linda!

TOTAL2 – Altcoin Market Cap (Weekly TF) 2025
**Summary:**
The TOTAL2 chart (crypto market cap excluding BTC) is showing a structurally bullish formation after a deep retracement and a higher low confirmation. This setup suggests a potential multi-phase rally toward 2.98T and beyond, with defined support zones and Fibonacci targets aligned with liquidity cycles. This analysis visualizes the expected roadmap based on trend-based Fibonacci extensions, retracement levels, and psychological market phases. Notably, the outlook includes the possibility of an initial correction to retest strong support zones before the market begins its ascent.
**Chart Context:**
TOTAL2 represents the aggregated market capitalization of all crypto assets excluding Bitcoin. Historically, it reflects capital rotation into altcoins, especially following BTC dominance peaks. The current chart shows strong reaccumulation above the 1T support zone, with Fibonacci confluences hinting at a sustained recovery pattern. Dotted arrows illustrate a wave-like projection of accumulation, rally, retracement, and expansion. The possibility of a near-term correction to lower support zones is also embedded in the path structure.
**Key Technical Observations: and Levels**
TP1 = 1.78T
TP2 = 2.05T
TP3 = 2.4T
TP4 = 2.85T
* **Secondary Fib Retracement :** 0% = 1.23T, 100% = 425.89B
* Key zones: 23.6% = 1.04T, 38.2% = \~840.42B, 61.8% = \~569.41B
Possible Support Levels: 1.04T, 930B, 840B, 766B, 735B,
* **Trend-Based Fib (A-B-C):** A = \~420B, B = \~1.23T, C = \~735B
* This projection aligns with TP1 at 1.78T
* **Support Area:** Around 1T psychological zone (930B)
* **Strong Support Zone:** 735 Bto775B
* **First Target Zone:** Between 1.73T and 1.89T (early resistance + Fib cluster)
**Indicators:**
* Weekly structure forming higher lows
* Long-term Fib retracements respected
* Trend-Based Extension projecting 1.618 move
* No divergence, confirming strength
**Fundamental Context:**
* Liquidity conditions are improving globally with rate cuts expected into late 2025.
* ETH and ecosystem tokens are likely to lead altcoin recovery.
* Regulatory clarity and ETF flows add legitimacy to broader crypto allocations.
* Historical alt-seasons emerge from BTC profit rotation—TOTAL2 leads that shift.
* However, several macro risks may trigger a correction before rallying:
* The Crypto Fear & Greed Index is currently high, suggesting overbought conditions.
* Macroeconomic uncertainties (e.g., inflation, rate hike fears) can suppress short-term risk appetite.
* Regulatory tightening across major jurisdictions introduces hesitation in capital deployment.
* Technical signs of a five-wave drop in BTC hint at a larger ABC correction scenario.
* DAT (Digital Asset Treasury) exposure among public firms may lead to forced liquidations during downturns.
**Philosophical or Narrative View:**
This is not just a market cycle—it's a reflection of decentralized innovation reclaiming narrative dominance. After fear-induced lows, TOTAL2's rise echoes the resilience of builders, protocols, and investor conviction. Each Fibonacci level acts like a checkpoint in the unfolding story of crypto's evolution beyond Bitcoin.
**Related Reference Charts:**
*
**Bias & Strategy Implication:**
* **Bias:** Bullish with short-term corrective risk
* **Accumulation Zone:** 1.0T–1.23T
* **Initial Risk:** Price may revisit the **Support Area (1T)** or even the **Strong Support Zone (775B–725B)** before a sustained move higher.
* **Partial TP:** 1.78T–2.05T
* **Extended TP:** 2.4T–2.98T
* Caution near TP4–Bonus zones as distribution risk increases
* Invalidated if closes below 725B (structure break)
**Notes & Disclaimers:**
This is a structural macro outlook and not financial advice. Markets are dynamic and subject to rapid shifts in sentiment, liquidity, and regulation. Always use risk management.

All eyes are on the daily closeA daily close back within the range would look super bullish for ETH.

Bearish Structure Still in Control, But a Twist is PossibleALKEM continues to respect its larger downward channel, forming what looks like a classic W-X-Y corrective structure.
Wave W unfolded as a zigzag .
Wave X developed as a contracting triangle , ending near ₹5400.
The current drop appears to be the start of Wave Y , possibly forming another zigzag.
As long as price stays below ₹5460 (the 0.5 retracement of the entire W-Y structure), the bearish setup remains valid.
The RSI breakdown below 40 adds strength to the bearish bias. The projected Wave Y could extend toward the ₹3450 zone if symmetry with Wave W plays out.
Alternate Bullish Scenario :
While bearish remains the primary view, there's a low-probability bullish alternate :
If the move from the February lows to ₹5400 was actually a leading diagonal, then the current fall could be a Wave 2 correction. A sharp reversal from above ₹4491 might trigger a bullish breakout toward new highs.
Chart will be updated as price action evolves.
Disclaimer: This analysis is for educational purposes only and does not constitute investment advice. Please do your own research (DYOR) before making any trading decisions.

OM - fib / entry targetsWeekly TF
@ 618 = 0.180 - 0.205 price range.
Would treat this as a long trade with low lvg. 50% up vs 15% down.
@ 786 = 0.05 - 0.07 price range.
Spot buy. 11,000% (to ATH) up vs 37% down.
Weekly RSI moving to oversold would be a good buy signal.

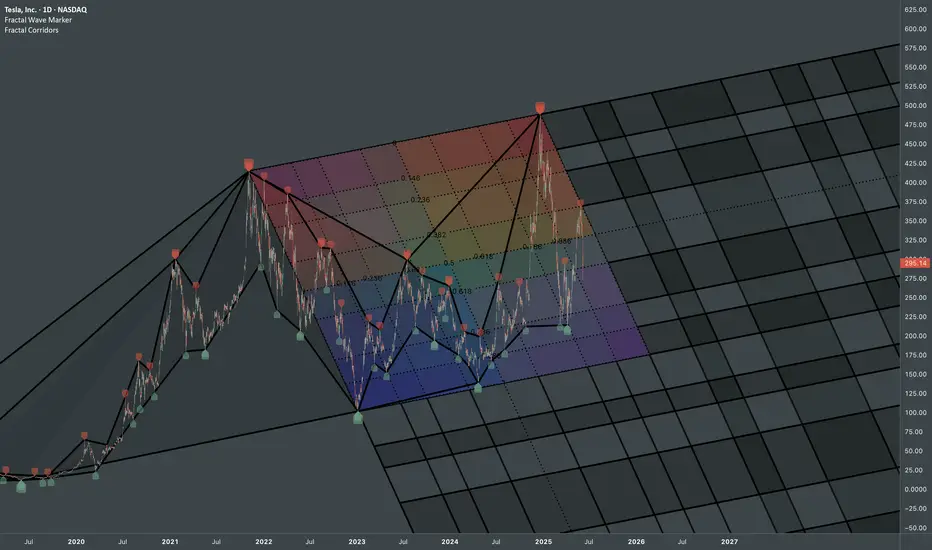
Tesla: Interconnected ATHsStructural update to:
Chronologically connecting pivots via fib channels creates a probabilistic map that captures the rhythm and scale relationships inherent in systematic price movements.
Fractal Wave Marker & Fractal Corridors were used to transform raw price data into a coherent, multiscale structure. Combo of those indicators makes you actually pay attention to ongoing patterns and get an idea how formations on smaller scale can be part of a bigger structural narrative.
$BTC Failed to Reclaim EMA9 - 200DMA in SightSo close, but so far away.
CRYPTOCAP:BTC held the 50DMA as support today but failed to break above the EMA9.
I suspect ₿itcoin now makes it way back down for the long awaited retest of the 200DMA ~$95k as I’ve been stating since the death cross.
If BTC can reclaim the EMA9 to close the week there may be a shot to continue the bullish uptrend, otherwise this correction will take a few weeks to play out.

Detailed analysis of the BTC/USD 4H chart🔍1. Chart Context
Interval: 4 hours (H4)
Current price: Around 104,950 – 105,400 USD
Range of recent candles: Strong rebound after a decline to around 101,000 USD.
Lower indicator: Stochastic RSI
📊2. Price Action Analysis
Market structure
Main trend (recent days): Downtrend – from the peaks of ~114,000 USD a clear sequence of lower highs and lower lows.
Recent hours: Dynamic decline, followed by a quick, strong rebound from around 101,000 USD to ~105,000 USD.
Key technical levels
✅Resistance:
~105,500–106,000 USD – local peak of the last rebound wave and earlier lows from the end of May.
~108,000 USD – next key level, with a bigger upward movement.
Support:
~102,000–101,000 USD – bottom of the last movement, quick demand reaction, so-called “stop run” or false breakout.
~99,000 USD – psychological zone and important level in case of further declines.
📊3. Indicators
Stochastic RSI (bottom of the chart)
Currently: Stochastic RSI strongly overbought (above 80 points), both lines (blue and orange) are at the top and slightly curling.
Conclusion: Possible short-term correction/slowdown in growth. Overbought Stochastic RSI often precedes pullbacks, especially when testing important resistances.
🧠4. Possible scenarios
Bulls – Upside scenario:
If BTC breaks above $105,500 with momentum, a move to $106,000–108,000 is possible (another resistance and short squeeze).
The key will be the closing of the 4h candle above $105,500.
Bears – Downside scenario:
If the price does not break $105,500, profit taking and a pullback to $103,000–102,000 are possible.
Strong defense of the $101,000–102,000 level by the bulls – if it is broken again, it threatens to deepen the declines even to $99,000.
📊5. Additional Notes
Reduced Volatility: After such a strong bounce, there is often a period of “calmness” and consolidation.
Potential Traps: False breakouts for 4h and sudden changes in direction (characteristic of the crypto market).
📌6. Warning Signals
Stochastic RSI overbought – suggests to be cautious with long positions “on the top” without additional confirmation.
Lack of continuation after a strong bounce – if the price does not “reach” higher in the next candles, the risk of a correction increases.
🧠Summary:
Currently: BTC/USD in a short-term bounce phase after a strong decline. The price is approaching a significant resistance (~105,500 USD). Stochastic RSI shows overbought – possible correction or sideways movement.
Direction for the next few hours: Reactions at USD 105,500 (resistance) and ~USD 102,000 (support) will be key.
