USDCAD → One step away from distributionFX:USDCAD is recovering amid the dollar's growth. Unemployment news is ahead. A return of the price to the buying zone may support the currency pair.
Against the backdrop of the dollar's growth, a change in the market phase is forming (unconfirmed). The price has stopped updating lows and is forming an eql, from which it is breaking out of the downtrend. The initial retest of liquidity at 1.366 may end in a correction. However, a quick retest and consolidation of the price above the level will confirm the change in sentiment
Resistance levels: 1.3686, 1.3732
Support levels: 1.3675, 1.366
Despite the fact that the price broke the downward resistance, the currency pair is still under pressure from sellers who are waiting for the price to fall from 1.3686. A breakout, a change in market sentiment to bullish, and consolidation above 1.3675-1.3686 will confirm readiness for a recovery. Zones of interest: eqh 1.3732
Best regards, R. Linda!
Fibonacci

TRUMPUSDT price analysis✊ It seems that the price of $Trump will only skyrocket when #Trump is impeached!
And we're keeping our fingers crossed that this happens as soon as possible... Mr. #Musk, you have nothing to lose — spill the beans!
As a Ukrainian classic wrote: “I gave birth to you — I will kill you.”
🕯 As for the price of OKX:TRUMPUSDT , it is moving very harmoniously and according to the canons of TA, regardless of who makes some “news throws” and does it on time or not.
And this is not surprising, as the crypto market titan Justin Sun has invested in it. His reputation is controversial, but he knows how to defend his “creations” and investments, pump them up, and make money on them.
So, it's purely hypothetical to assume that the price of $Trump will continue to rise, but this is by no means a call to invest in the red-haired jerk's coin. ✊
_____________________
Did you like our analysis? Leave a comment, like, and follow to get more

Digital Turbine inc. Future of the Stock impressive, where it Target level = 47.57$
Cup and Handle at the Bottom in progress of formation 👌
1st Target price = 47 $ - 48 $
A Motive powerful wave in the way, and I expected a Massive positive News in the way any moment
Highly recommended for Buying & Accumulation.

A healthy pullback before moving to the upward.Everything is based on market structure and price action, as indicated by the charts that ETH is bullish.

This is a healthy pullback before the price moves to the upside Everything is based on market structure and price action, as indicated by the charts that ETH is bullish .

BTCUSDT reversal is not yet complete -> 95k???Despite yesterday's mini-dump, which initially appeared to be the right shoulder of the head and shoulders breaking out, the immediate retracement means the trading range sits within the range seen in the left shoulder.
We are still inside the incomplete head and shoulders pattern, and a bearish parallel channel.
If the price breaks out to the downside of the channel and the left shoulder range, the target for the retracement would be the same as the distance from the head to the neckline of the H&S pattern (y). This puts it inside the support zone of the 78.6% fib level of the continuation of the swing in the head of the pattern, at ~95k.
If the bulls thought they're through worst of it, the pain may not have even begun yet.
Even breaking out of the parallel channel might not be enough. The only thing that would signal the failure of the head & shoulders pattern is a new ATH, and that would need to happen quickly to save BTC from further falls.

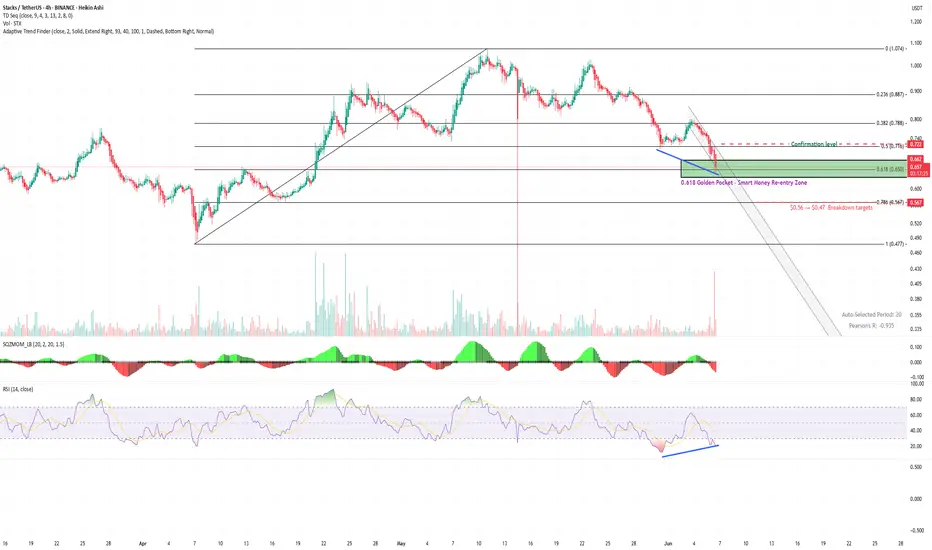
$STX / USDT (4H) – Golden pocket re-entryCOINBASE:STXUSD is testing the 0.618 Fib retracement ($0.65)
A zone where smart money often re-enters after corrections.
Confluence:
🔹 TD9 buy
🔹 RSI divergence
🔹 Fading momentum
🔹 Volume pickup near support = early demand?
Reclaim $0.72 could trigger a relief rally to $0.78–$0.80
Break $0.65 opens $0.56 and $0.47.
Mask Network MASK price analysis🤖 Now "they" are trying to “restore” #MASK price after “someone accidentally let it go free.”
After such a sharp drop in the price of OKX:MASKUSDT , probably 80% of long positions have been liquidated.
Those who held this coin on the spot should watch carefully, as there may be a chance to sell it either at "zero" or at a profit!
🍿 Because, looking at the OKX:MASKUSD chart now, we can assume that “those” who are raising the price of #Mask now have announced a "hunt for shorts".
This is, of course, our assumption, but the vendetta against those who shorted OKX:MASKUSDT in difficult times and drowned it in even more “blood” is close at hand.
✔️ $2.10 - $2.70 - $3.50 - $4 - these are the levels that the price of the #MaskNetwork token can reach when the “short squeeze” starts - a cascade of liquidations that accelerates growth.
_____________________
Did you like our analysis? Leave a comment, like, and follow to get more

Tesla Update Longs and shorts At the start of the video I recap my previous video and then bring us up to date with the present price action .
In this video I cover Tesla from the higher time frame and breakdown both a long term bullish scenario as well as a local bearish scenario .
Both of these scenarios present longs and short entries for day trade opportunities and swing positions .
Tools used Fibs , TR pocket , Volume profile , Pivots , and vwap .
Any questions ask in the comments
Safe trading and Good luck


Good signs for the stock market opening?S&P 500 E-mini Futures: The range breakout hit its target below perfectly. Now, we're trading back within the range and above the mid-band on the 4-hour timeframe. This looks incredibly bullish, imo!

Ethereum is still on trackETH might've printed a spot-on "spring" below its daily range. If there's a breakout on the daily RSI, that'll probably be a confirmation.

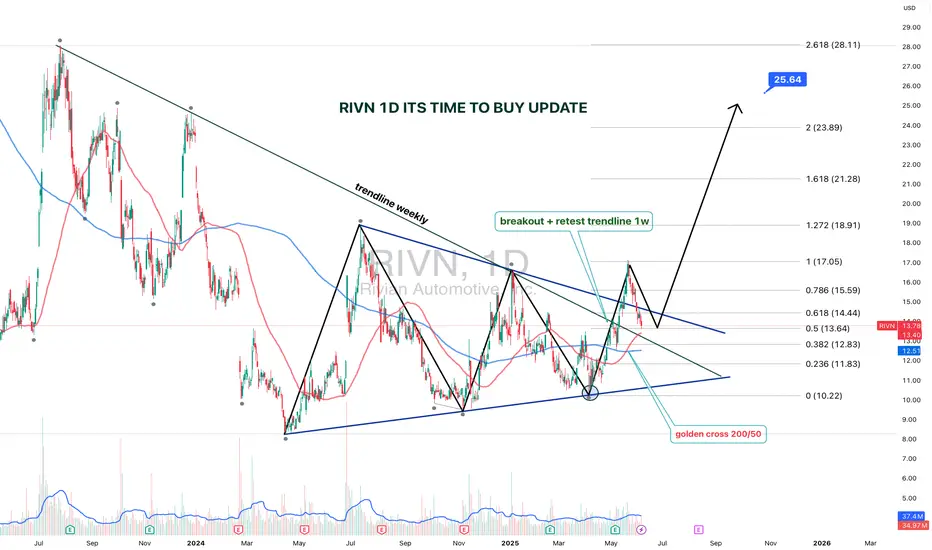
RIVN 1D — It’s Time to Buy: Setup UpdateThe setup on Rivian (RIVN) just got upgraded from “interesting” to “strategically significant.” We’re looking at a textbook symmetrical triangle that’s been developing since July 2023, with a clean breakout and retest on the weekly trendline.
The breakout was followed by a bullish retest, right at the intersection of the triangle base and the key trendline. Volume kicked in, price held — and that’s what smart money calls confirmation.
Now, the Golden Cross is live: the 50-day MA just crossed the 200-day MA from below. Price is confidently holding above both — momentum is shifting hard. Fibs from the bottom (10.22) to the last local top (17.05) project the first target at $17, and the extended Fibonacci confluence gives us $25.64 as a long-range goal (2.618 extension).
The weekly trendline — which acted as resistance for over a year — has flipped to support. Price action respects it, bulls are loading, and structure is clean.
This is not just a bounce. It’s a technical rotation from accumulation to expansion.
The time to talk about potential is over — price action has spoken.
NATF LongNATF has broken its all time high with a marubozu candle and has retested its breakout level successfully.
Next targets are 295 (Conservative) and 305 (Optimistic).
Resistance level is 217-219 region.
Support is 198 and stop loss should be placed at 190.

Btc ran stopsQuick wick as a swing fail pattern and poked into the fair value gap inefficiency, looks like we might get a retest and we’ll see how it goes. We might get 150k BTC before GTA 6

BTC eyes on 97.8k then 95.2k: Next major Support Zone incomingBTC now watching 97.8k then 95.2k: Next support zone incoming
BTC pulling back hard from our 111.7k Top call (see below).
Loss of 104/105k has opened the next major support zone.
Sub-100k stop hunt was expectable and looking likely now.
==================
Previous Plots below
==================
TOP call at 111.7k:
Subsequent warning about 105k:
Hit the BOOST to encourage more such PRECISE publications ======================================================
.

Bitcoin Short: Video Walkthrough on 4th and 5th waveOver in this video, I explained the bitcoin short by explaining the wave 4 structure and how I set the stop losses and take profit target using resistance level and previous waves and Fibonacci extension levels.
I also talk about how I will trade this setup by scaling in.

Gold Short: Wave C of 2Gold has completed a 5-wave structure. This big structure should be a wave 1 of cycle wave 5. Now we should be on wave B and going into Wave C of Wave 2 of cycle Wave 5.

Bitcoin Wave Analysis – 5 June 2025
- Bitcoin broke support zone
- Likely to fall to support level 98,000.00
Bitcoin cryptocurrency recently broke the support zone located between the key support level 102150.00 (which reversed the price multiple times from the start of May) and the 50% Fibonacci correction of the upward impulse from last month.
The breakout of this support zone accelerated the active short-term ABC correction 2, which started earlier from the major multi-month resistance level 110,000.00.
Bitcoin cryptocurrency can be expected to fall to the next support level 98,000.00 (former strong resistance from February).

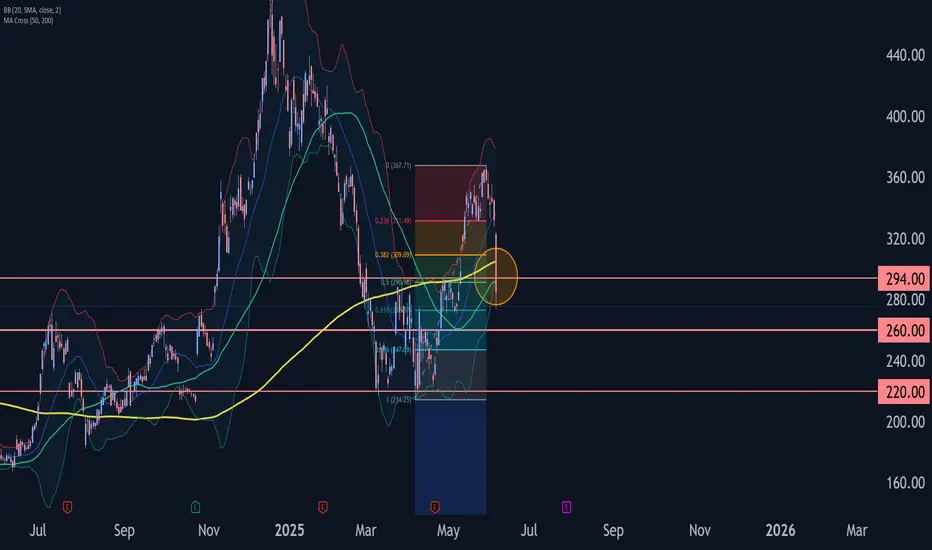
Tesla Wave Analysis – 5 June 2025
- Tesla broke the support zone
- Likely to fall to support level 260.00
Tesla recently broke the support zone located between the support level 294.00 (former resistance from April and March) and the 50% Fibonacci correction of the upward impulse from April.
The breakout of this support zone accelerated the active minor ABC correction 2 from the end of May.
Tesla can be expected to fall to the next support level 260.00, which is the former resistance from the start of April.
Bitcoin is looking great so far!Once the potential Wave 2 correction is over, we can enter a potential Wave 3 on the daily timeframe, reaching at least 140k before the next "major" correction.

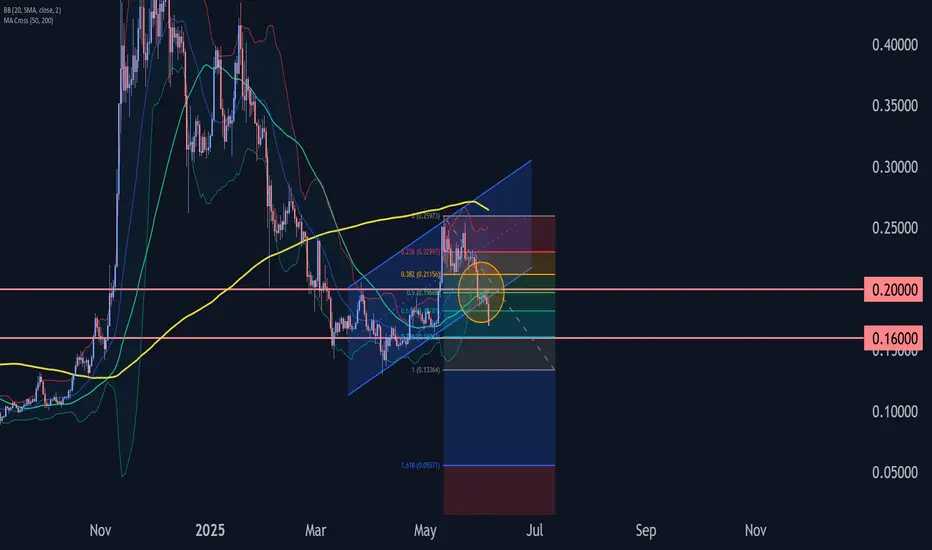
Dogecoin coin Wave Analysis – 5 June 2025
- Dogecoin broke key round support level 0.2000
- Likely to fall to support level 0.1600
Dogecoin cryptocurrency is under bearish pressure after the earlier breakout of the key round support level 0.2000 (former strong resistance from March) coinciding with the support trendline of the daily up channel from March.
The price briefly corrected up to test the broken price level 0.2000 (acting as the resistance after it was broken) – after which it continued to fall in the active impulse wave 3.
Dogecoin cryptocurrency can be expected to fall to the next support level 0.1600, former low of wave (iv) from the start of May.
Upward CorrectedThe mid December bear run has been upward corrected sufficiently now.
The declining lower band indicates a loss of momentum of this corrective movement.
May be we want to see lower prices now. Bears still ruling the market. The January high may be seen as the pivot point.
