Fibonacci
Bearish Setup Forming Near Resistance | Fib + Order Block🔍 Technical Breakdown
Price is currently hovering around 3,371, testing a key resistance zone. This level aligns with a Fibonacci retracement and a marked order block, suggesting a potential reversal area.
Resistance Zone: 3,371.487
Support Levels: 3,361.705 and 3,354.190
Indicators Used: Fibonacci Retracement, Order Block
A red arrow on the chart illustrates a projected bearish move. If price fails to break above the resistance, we may see a retracement toward the lower support levels.
📌 Trade Idea
Watch for bearish confirmation (e.g., rejection candles, volume spikes) near the resistance zone. A short position could be considered with a target near the support levels and a stop above the resistance.

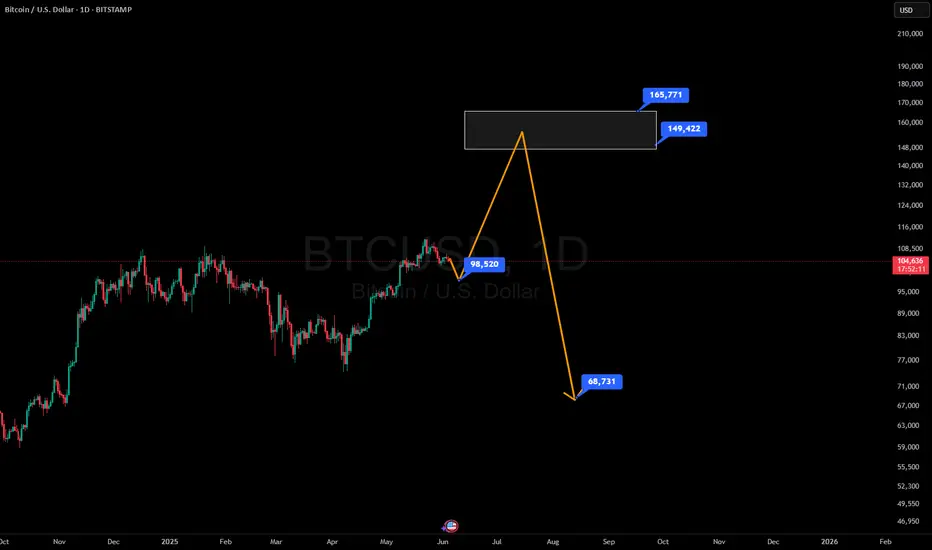
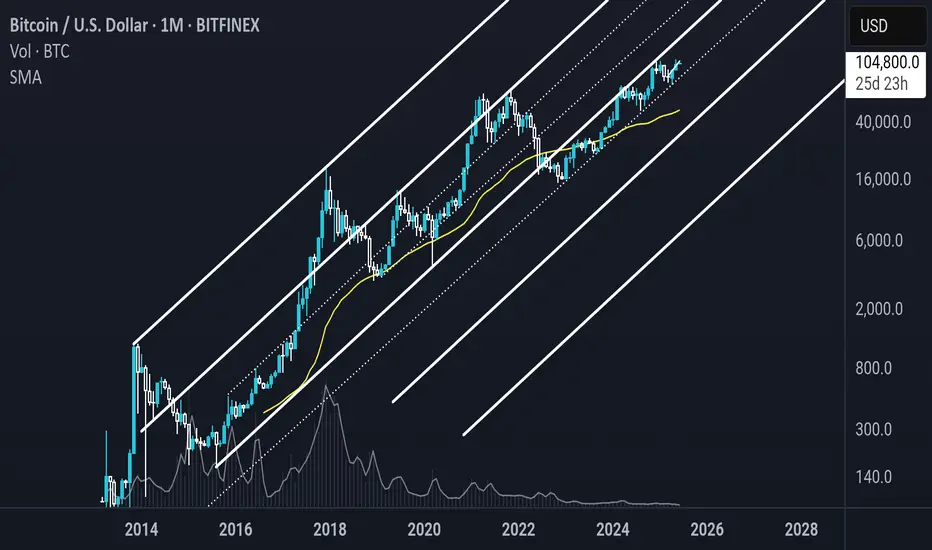
BTC log pitchfork (re-up)the BTC Log scale Pitchfork shows perfect Fib levels being respected. I don't know what it means or how to interpret this, no price target or direction from this, but the levels seem significant so I'm just noticing and playing the levels being held. All I know is buy the yellow the line (SMA40), and I drew the next lower pitchfork levels according to proportions.
Also, last season's ATH is always the next bearmarket season's bottom.
When in doubt, zoom out.
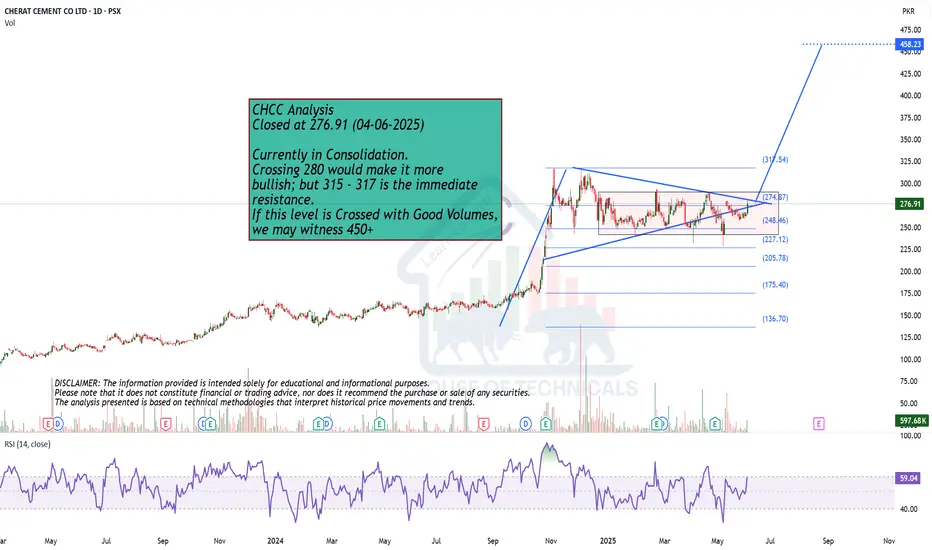
Currently in Consolidation.
Closed at 276.91 (04-06-2025)
Currently in Consolidation.
Crossing 280 would make it more
bullish; but 315 - 317 is the immediate
resistance.
If this level is Crossed with Good Volumes,
we may witness 450+
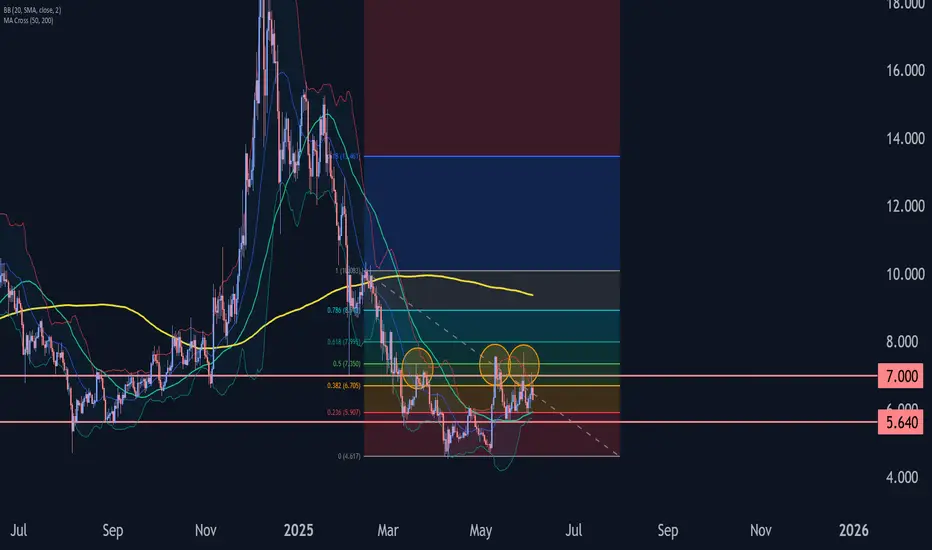
Uniswap coin Wave Analysis – 4 June 2025
- Uniswap coin reversed from resistance level 7.00
- Likely to fall to support level 5.640
Uniswap coin recently reversed down from the pivotal resistance level 7.00 (former strong support from February, which has been reversing the price from March).
The resistance level 7.00 was strengthened by the upper daily Bollinger Band and the 38.2% Fibonacci correction of the downward impulse from February.
Uniswap coin can be expected to fall to the next support level 5.640, which stopped the 2 previous corrections ii and (ii).
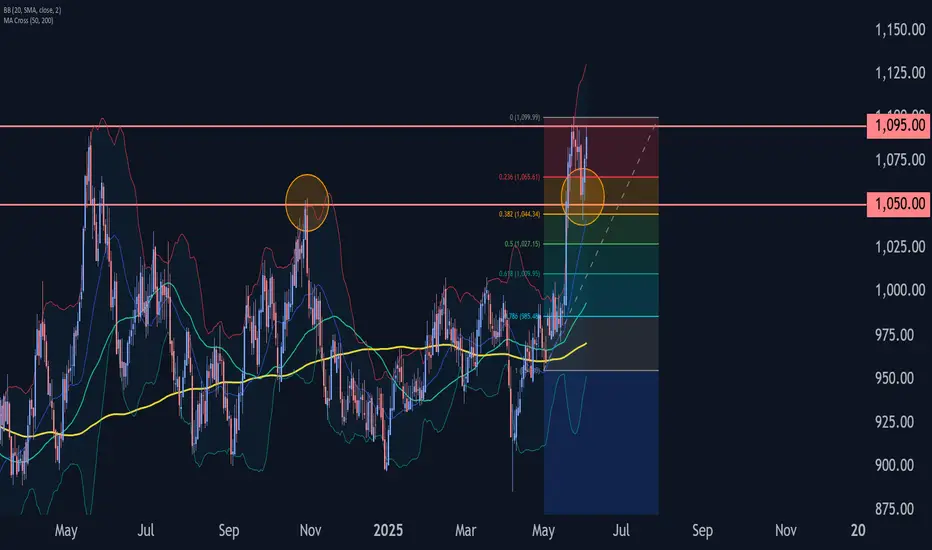
Platinum Wave Analysis – 4 June 2025
- Platinum reversed from support zone
- Likely to rise to resistance level 1100.00
Platinum recently reversed up from the support zone between the support level 1050.00 (former multi-month high from October) and the 38.2% Fibonacci correction of the upward impulse from May.
The upward reversal from this support zone continues the active impulse wave iii of intermediate impulse wave 3 from April.
Platinum can be expected to rise to the next resistance level 1100.00, the breakout of which can lead to further gains toward 1140.00.
TRUMPUSDT – Daily Technical AnalysisTRUMPUSDT – Daily Technical Analysis
The price has reached a key daily support level at $10, showing potential signs of a bullish reversal.
If the support holds, we may see a move toward the resistance area around $14, offering a decent upside opportunity.
In a more bearish scenario, the price could extend its correction to the $9 support zone, which may serve as a stronger foundation for the next upward impulse.
🟢 Key Support Levels: $10 (daily), $9 (secondary support)
🔴 Resistance Zone: $14
Stay tuned for more technical insights and updates.

EUR/USD Coils Below Resistance Ahead of ECB, NFPEuro broke above the April downtrend last month with price surging more than 3.5% off the May low. The advance failed at technical resistance into the start of June at the 1.618% extension of the May advance near 1.1455. The focus is on a reaction off this mark with a breakout of the weekly opening-range to offer some guidance in the days ahead.
The weekly-range is now set just above the objective weekly / monthly open at 1.1347. Subsequent support seen at the 2023 swing high at 1.1276 with near-term bullish invalidation at the 2024 swing high / 61.8% retracement at 1.1214- a break / close below this threshold would be needed to suggest a more significant high is in place / a larger reversal is underway towards key support at 1.1040/74.
A topside breach of the weekly opening range exposes subsequent resistance objectives at the 2025 high-day close (HDC) at 1.1514 and 1.1564/73- a region defined by the 100% extension of the May advance and the yearly swing high. Look for a larger reaction there IF reached with a daily close above needed to mark uptrend resumption / fuel the next major leg of the Euro advance towards 1.17.
Bottom line: A breakout of the April downtrend is now testing the first major resistance hurdle with the weekly / monthly opening-ranges taking shape just below- look for the breakout. From a trading standpoint, losses would need to be limited to 1.1214 IF price is heading higher on this stretch with a close above the yearly high needed to mark resumption of the broader uptrend. ECB on tap tomorrow with NFPs slated for Friday- stay nimble into the weekly close.
-MB

AUD/USD Poised for Breakout ahead of NFPsThe Australian Dollar broke back above the 200-day moving average this week with AUD/USD testing resistance at the 65-handle today. Its decision time for the Aussie as the bulls threaten to breakout of a multi-month range in price.
Aussie is testing resistance today at the 2025 high-close / 61.8% extension of the Friday rally at 6495-6504 with key resistance seen just higher at 63540/50- a region defined by the 61.8% retracement of the September decline and the 100% extension. Note that the upper parallel converges on this threshold into the close of the week and a breach / close above would be needed to fuel the next major leg of the Aussie advance. Initial breakout objectives eyed at the September low at 6622 and the November high-day close (HDC) at 6680.
Initial support rests with monthly open / 200-day moving average at 6432/43 and is backed closely by the May open at 6402. Ultimately, a break / close below the April / August lows at 6348/62 would be needed to suggest a more significant high is in place / a larger correction is underway towards broader bullish invalidation at 6300- look for larger reaction there IF reached.
Bottom line: Aussie is attempting to mark a fresh yearly high-close today but still shy of uptrend resistance just higher. The immediate focus is on a breakout of the weekly opening-range for guidance with the long-bias vulnerable into the upper parallel. From at trading standpoint, losses would need to be limited to 6400 IF price is heading higher on this stretch with a close above the 6550 needed to fuel the next major leg of the April advance.
-MB

BTC/USD 1H Short-Term🔍1. General Context and Short-Term Trend
Short-Term Trend: The last dozen or so candles have shown strong fluctuations — a typical sideways market (consolidation) after a clear upward impulse and a quick drop. The price is currently trading in the range of around $104,900–$106,500.
Recent Strong Move: Clear upward impulse from around $104,900 to around $106,900, followed by a quick correction.
📌2. Supports and Resistances (H1)
Supports:
$105,000–$105,200 — Bottom of local wicks and several demand tests.
$104,900 — Lowest point of the last few hours, clear buyer reaction.
Resistances:
$106,200–$106,400 — Upper area of several candles, strong price rejection.
106,900–107,000 USD – The peak of the last impulse, a place of clear supply.
✅3. Candlestick formations and price action
Pin bar / long wick: Candles with long lower wicks are visible around 105,000 USD, which suggests that buyers are defending support.
Double top? (Double top): Peaks around 106,900 USD (03.06 and 04.06) – a classic signal of a potential change in direction to the lower.
Possible consolidation: The last few hours have been a series of alternating candles, signaling the lack of a clear advantage of bulls or bears.
🧠4. Technical indicators (MACD and RSI)
MACD (lower panel)
The MACD line crossed the signal line from the bottom to the top, then a quick correction and currently the MACD is close to zero – no clear trend, momentum has slowed down.
MACD Histogram: Declining, close to zero, suggesting potential lack of strong trend and possibility of further consolidation.
RSI (middle panel)
RSI value ~44–48 – not overbought or oversold, neutral market state.
No divergence – RSI generally follows price, no strong divergences are visible.
RSI bounced off 30 (tested oversold zone and returned to neutral range).
🧠5. What could be important?
Volatility Squeeze: Low volatility after a sharp move often heralds another impulse.
Potential Fakeout: If support at $104,900 is broken falsely (e.g. quick wick and return), a move up could occur.
No clear trend on the hourly chart, rather sideways market in the short term.
📊Summary and scenarios
Scenario 1 (bullish):
If the $105,000-$104,900 level holds, we can expect a test of $106,200-$106,400 and perhaps another attempt to approach $107,000.
Scenario 2 (bearish):
If the $104,900 support is broken (with a candle closed below this level), the next target is around $104,500 and below.
What to watch out for?
Timing of macro data releases - may increase volatility.
Sudden breakouts from consolidation - no trend = higher risk of sudden, false moves.

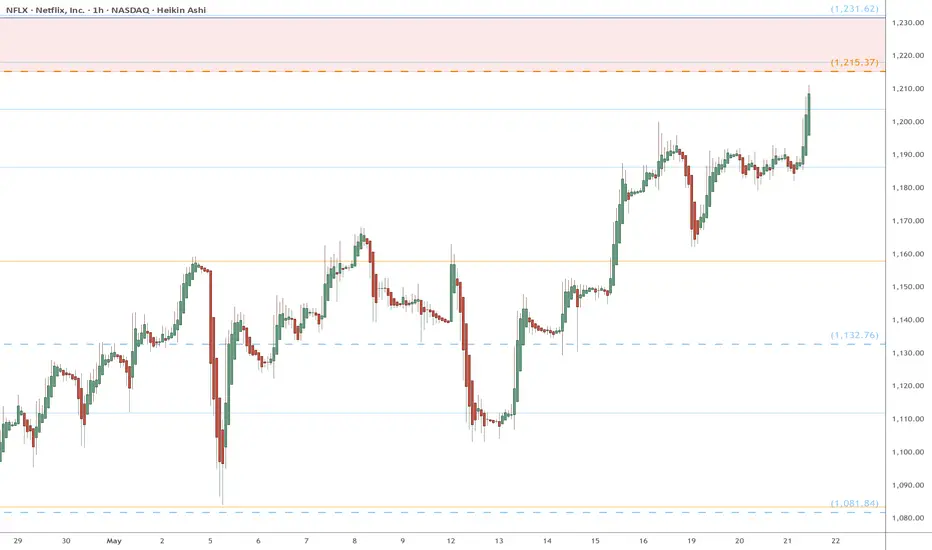
NFLX heads up into $1230: Major Resistance zone may give a DipNFLX has been on a tear but nearing a major resistance.
$1215.37 is a Golden Covid fib forming bottom bound.
$1231.61 is a minor Genesis fib forming the top bound.
It is PROBABLE that we see a dip from there.
It is POSSIBLE to consolidate within the zone.
It is PLAUSIBLE to break-and-retest to go more.
.
Previous Analysis that caught the BOTTOM
==================================================
.
PIUSDT Range Play Within a Potential Descending TriangleAfter reaching a high of $2.9645, PIUSDT has experienced a sharp decline, establishing a base near the $0.38 zone. This base continues to hold, suggesting the formation of a potential descending triangle.
For now, the strategy is to trade the range while the structure matures. A break below $0.38 would likely trigger further downside toward $0.16, where a strong external demand zone aligns with the completion of a possible WXY corrective formation.
On the flip side, a breakout above the upper trendline of the triangle would be a strong bullish signal, potentially igniting a significant rally. Upside targets are already projected on the chart.
As the structure develops, all eyes remain on the key levels that will determine the next major move.

Celestia TIA price analysis#TIA price currently looks “weak,” gradually sliding down and updating lows.
A “ray of hope” may be a repeat of the fractal behavior of the OKX:TIAUSDT price from last year, when, after the third slight update of the low, the price began to rebound upward.
If we take this fractal as a basis, then in the near future, the price of the #Celestia token should rebound to $4, followed by a correction and continued growth to $5.55.
_____________________
Did you like our analysis? Leave a comment, like, and follow to get more

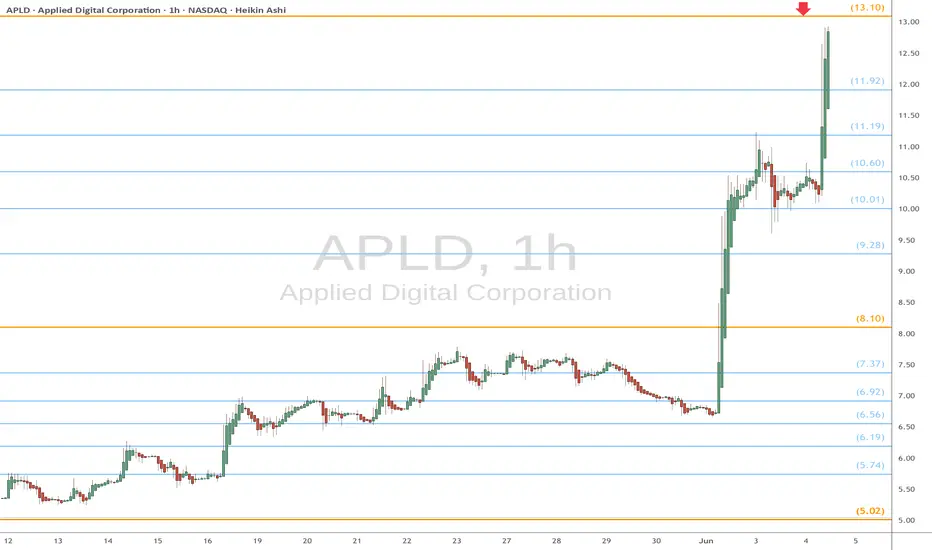
APLD heads up at $13.10: Golden Genesis fib may stop the SurgeAPLD on a massive surge over various company news.
Currently about to hit a Golden Genesis fib at $8.10
Looking for usual Dip-to-Fib or Break-and-Retest to buy.
It is PROBABLE that we "orbit" this fib a few times.
It is POSSIBLE that we get a significant dip from here.
It is PLAUSIBLE that we break and run if bulls are hyper.
.
See "Related Publications" for previous EXACT plots --------------------->>>>>>>
.
ApeCoin (APE) Cup Pattern (1D)After a deviation below demand, BINANCE:APEUSDT formed a clean rounded bottom, reclaimed the zone, briefly consolidated, and it's now attempting to break above resistance.
Key Levels
• $0.79: Current resistance
• ~$0.65: Current support, breaking it might lead to the formation of a handle
• $0.50-$0.60: Main demand zone and logical pullback target in case of a handle
• $1.20: Measured breakout target, and previous swing high
Worth watching it closely for a daily close above $0.79 with good volume to activate the target.
Alternatively, look at the $0.50-$0.60 area for a reversal in case of a rejection here.

Biotechs May Have Broken Their DowntrendBiotechnology stocks have struggled this year along with the broader health-care sector, but some traders may think a bullish turn has begun.
The first pattern on today’s chart of the Nasdaq Biotechnology Index is the series of lower highs since early April. NBI closed above that falling trendline yesterday, which may signal a change of direction.
Second, you have the rally between early April and early May. The index retraced half that advance by mid-May and bounced. That may confirm its direction is now to the upside.
Third, this week’s push above the 50-day simple moving average may suggest the intermediate-term downtrend is over.
Finally, the 8-day exponential moving average (EMA) has crossed above the 21-day EMA. MACD is also rising. Those may be viewed as bullish short-term signals.
Check out TradingView's The Leap competition sponsored by TradeStation.
TradeStation has, for decades, advanced the trading industry, providing access to stocks, options and futures. If you're born to trade, we could be for you. See our Overview for more.
Past performance, whether actual or indicated by historical tests of strategies, is no guarantee of future performance or success. There is a possibility that you may sustain a loss equal to or greater than your entire investment regardless of which asset class you trade (equities, options or futures); therefore, you should not invest or risk money that you cannot afford to lose. Online trading is not suitable for all investors. View the document titled Characteristics and Risks of Standardized Options at www.TradeStation.com . Before trading any asset class, customers must read the relevant risk disclosure statements on www.TradeStation.com . System access and trade placement and execution may be delayed or fail due to market volatility and volume, quote delays, system and software errors, Internet traffic, outages and other factors.
Securities and futures trading is offered to self-directed customers by TradeStation Securities, Inc., a broker-dealer registered with the Securities and Exchange Commission and a futures commission merchant licensed with the Commodity Futures Trading Commission). TradeStation Securities is a member of the Financial Industry Regulatory Authority, the National Futures Association, and a number of exchanges.
TradeStation Securities, Inc. and TradeStation Technologies, Inc. are each wholly owned subsidiaries of TradeStation Group, Inc., both operating, and providing products and services, under the TradeStation brand and trademark. When applying for, or purchasing, accounts, subscriptions, products and services, it is important that you know which company you will be dealing with. Visit www.TradeStation.com for further important information explaining what this means.

HOOD watch $75: Golden Genesis + Local fib zone may cause a DipHOOD has been flying from various company news.
Just hit a Golden Genesis zone at $74.65-75.09
Look for a Dip-to-Fib or Break-n-Retest for entries.
.
See "Related Publications" for previous EXACT plots ------------->>>>
.

MiracleShot ;) My new Strategy Whats Upp guyz ?!
this is my new strategy that I have worked last 3 weeks
in 5m 15m 30m on XAUUSD and BTCUSD , GBPUSD
if you are interested to know more Drop a comment below for more ^_^
@TradeWithMky

GOLD → Consolidation before a strong move...FX:XAUUSD is consolidating after a false breakout of resistance at 3365, awaiting economic data. The metal remains attractive to investors amid the economic crisis.
Gold is supported by the weakening dollar amid increased trade risks. Today, US tariffs on steel and aluminum come into force, and Trump's ultimatum to trading partners expires. Investors are also awaiting news of a possible meeting between Trump and Xi Jinping amid new accusations against China. The focus is on key employment data (ADP) and the ISM services index, which could influence the dollar and expectations for the Fed's actions.
Technically, the market may test the 3323 liquidity zone before continuing its growth.
Resistance levels: 3365, 3391
Support levels: 3345, 3323, 3303
Overall, both the global and local trends are bullish, with the price forming a local correction after a false breakout of resistance. If the bulls hold their ground above 3323-3345 after retesting support, growth may continue in the short to medium term.
Best regards, R. Linda!

Shoulder on Shoulder - Need a dump this Week😥 The past week was complicated, and I don't want to bore you with all the political goings-on, which I hope you're already aware of. I'm a bit short on time right now, but I still wanted to share this perspective with you all.
💁♂️ It is Shoulder on Shoulder H&S everywhere!
💡 My concept of a plan:
🧗 Let's climb the Pinky way down
3289 - Actual Price
3271 - 🏁 S1
3232 - 🚪 Pink Neckline entry
3245 - 🤞 S2 & Head of White reverse H&S
3204 - 👀 Pink Start from Left Shoulder
3184 - 🎯 TP 1 - Fibo 1.272
3163 - 🎯 TP 2 - Fibo 1.414 or 3166
3134 - 🎯 TP 3 - Fibo 1.618 or 3154
3120 - 👀 Head of Yellow reverse H&S
3079 - 🎯 TP 4 - Fibo 2
🗣️ Important: FED Chair Powell speaking June 02 Mon at 1 PM EDT
What are your toughts about this? Please write it in the comments.
-------------------------------------------------------------------------
This is just my personal market idea and not financial advice! 📢 Trading gold and other financial instruments carries risks – only invest what you can afford to lose. Always do your own analysis, use solid risk management, and trade responsibly.
Good luck and safe trading! 🚀📊

Sol, setting!? or will it rise!
In our last Solana ( CRYPTOCAP:SOL ) update, we discussed the potential for a bounce and posed the critical question: would it be a retest or a reclaim? That distinction is now front and center as price action unfolds.
The 141 area remains the level bulls must defend. A clean reaction here, ideally with a supportive pattern, would create favorable conditions for upside continuation. However, if price returns above 169 , the current impulsive structure downward would be invalidated and a recount would be warranted, that could also be the end of the correction.
Zooming out, the bigger question is whether we are in the C wave of a flat correction. If that’s the case, then this impulse Should be the final move before a change in trend. Conversely, an impulse shouldn't be taken for granted nor lightly, I could set the stage for further down side. If a C wave, this pattern could set the stage for a powerful move after it completes.
In simpler terms:
If bulls hold 141 and reclaim momentum, the structure could shift bullish quickly.
If this is a flat, the C wave down is still unfolding, and we may need to endure one more leg lower before a true trend reversal.
Either way, patience is key. Let the chart print clarity.

SUI price analysis If we look at the OKX:SUIUSDT chart globally, you'll see that the April drop stopped at a retest of a strong mirror zone.
And even now, when the CRYPTOCAP:BTC price is trying to correct itself, the #SUI price is very well-supported.
Therefore, globally, any purchase of #SUI while the price is above $2.30 has a chance to turn into a good medium or long-term investment.
📈 On the chart, we have schematically depicted how the #SUIUSDC price may move in the future in 2025 with the final target of $10.8-11.80
_____________________
Did you like our analysis? Leave a comment, like, and follow to get more

AUDCHF → Hunting for liquidity. Fall from resistanceFX:AUDCHF is emerging from local consolidation and entering a distribution phase. Potentially, against the backdrop of a downtrend, the market may be interested in the liquidity zone at 0.5356
Globally, we have a strong downtrend and a countertrend correction that is facing pressure in the 0.545 zone. The decline is resuming, but at some point the market formed an EQH liquidity pool at 0.5356, which is most likely acting as a magnet pulling the price towards it...
Based on the technical situation, we can conclude that if the price continues to form a distribution towards the target, the market is quite capable of stopping the price and returning to the downtrend phase.
Resistance levels: 0.535, 0.5356
Support levels: 0.5327, 0.5314
Thus, a breakout of the resistance level of 0.5356 without the possibility of continuing growth and a return of the price below the resistance level with subsequent price consolidation in the sales zone (below 0.5356) may trigger a resumption of the downward trend.
Best regards, R. Lind
