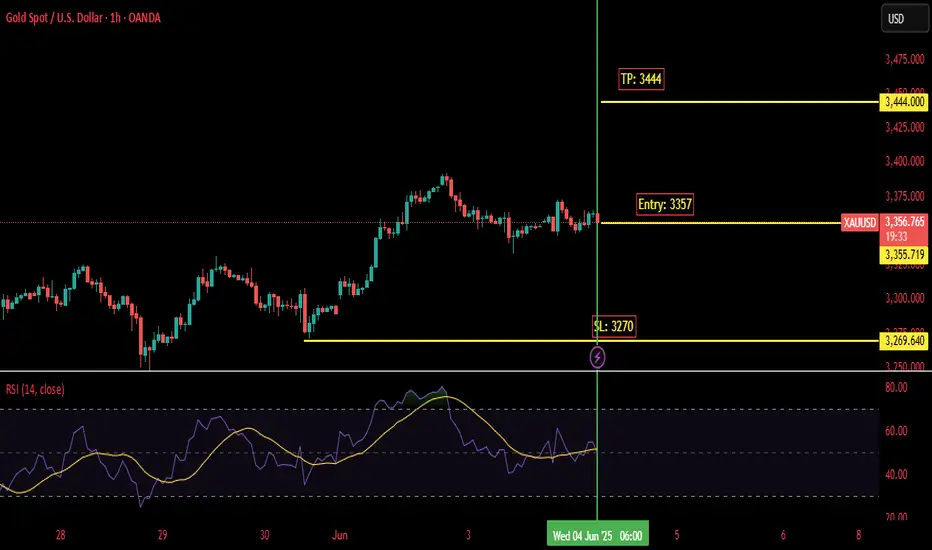
XAUUSD Gold is currently hovering around 0.382 support area we can take entry at 3357 with Sl of 3270 and TP at 3444
Fibonacci
EWTSU EURUSD H4 minute ((iv)) update
Elliott Wave trade set up h4
to confirme the end of wxy corrective pattern
price must break out definitively in an impulsive mode the 1'1270 area,
heading and pass trought decisively 1.1375 area
to get to area 1.1460
invalidation: price under 1.1160

EWTSU XAUUSD H4 subminuette iv update
Elliott Wave Trade Set Up H4 subminuette iv update
to confirme the end of wxy corrective pattern
price must break out definitively in an impulsive mode the 3435 level
right now submicro wave (3) looks in progress - target 3367
invalidation: first level of alarm - price under 3227

IPO Price Respected — Now Coiling for a Major Breakout?
🔍 Chart Context & Structure
Since its listing, SBI Cards & Payment Services Ltd (NSE: SBICARD) has been forming a massive accumulation base on the weekly chart — with an iron-clad support zone around ₹650. Over the last 3.5 years, the stock never closed below this IPO zone, signaling strong institutional confidence and long-term investor conviction.
Now, after multiple failed attempts, price is retesting the crucial ₹930–₹972 resistance band — a level that previously triggered sharp rejections. But this time, the setup is different:
✅ Momentum is building with a consistent series of higher lows.
✅ The structure now hints at a rounding bottom formation.
✅ Volume is supportive (if visible), and sentiment around financials is shifting positive.
📊 Technical Zones to Watch
Zone Relevance
🔵 ₹660–₹715 Strong base zone (IPO support + demand cluster)
🟣 ₹930–₹972 Historical supply zone (tested 3rd time now)
🟠 ₹1,130–₹1,150 Minor resistance, could break quickly post breakout
🟡 ₹1,272 – ₹1,440 Fibonacci targets (1.272–1.618 extension)
🔴 ₹1,916 Final positional target (2.618 Fib extension from pandemic low)
🌐 The Macro Tailwinds
💳 Credit card usage in India is booming – penetration is still low compared to global norms, but monthly user growth is accelerating.
🏛️ Government is actively promoting digital payments – a key pillar in India’s fintech roadmap.
📈 Financialization of Indian households – from cash hoarding to credit leverage, behavior is shifting.
🔁 Consumer spending is rebounding strongly post-COVID and SBI Cards is a direct proxy.
💡 Investor Psychology
Think of the ₹930–₹972 zone like a "psychological lid". Price got rejected here twice before — so this third approach carries both hesitation and anticipation. A weekly close above this zone would likely:
Trigger short-covering from swing sellers,
Attract momentum traders,
And validate long-term bulls waiting for confirmation.
📌 Trading Plan (Positional Swing)
Entry Trigger: Weekly close above ₹972
Initial Target: ₹1,130 → ₹1,192
Medium-Term Targets: ₹1,272 → ₹1,343 → ₹1,440
Long-Term Target: ₹1,916
Stop-Loss (Weekly): Close below ₹880
Holding Period: 6 months to 2 years depending on breakout strength
🧠 Final Thought
"Not closing below IPO levels for over 3 years in a volatile mid-cap is not random — it's informed accumulation."
With digital payment adoption surging and tailwinds aligning, SBI Cards may be quietly entering a new phase of price discovery. Watch the ₹972 zone closely — what was resistance may soon become the launchpad.

EUR/CHFLooking for the market to retrace, only entering once the market enters my area.
This will be confirmed with my RSI.
But if it takes the high before the retracing, I will not look for a trade anymore, as one of the targets have already been taken

Bitcoin: Fib Interference PatternNeeded 3h timeframe version of the Fibonacci interference pattern to better capture and document short-term market behavior around key intersection zones.
Measurements

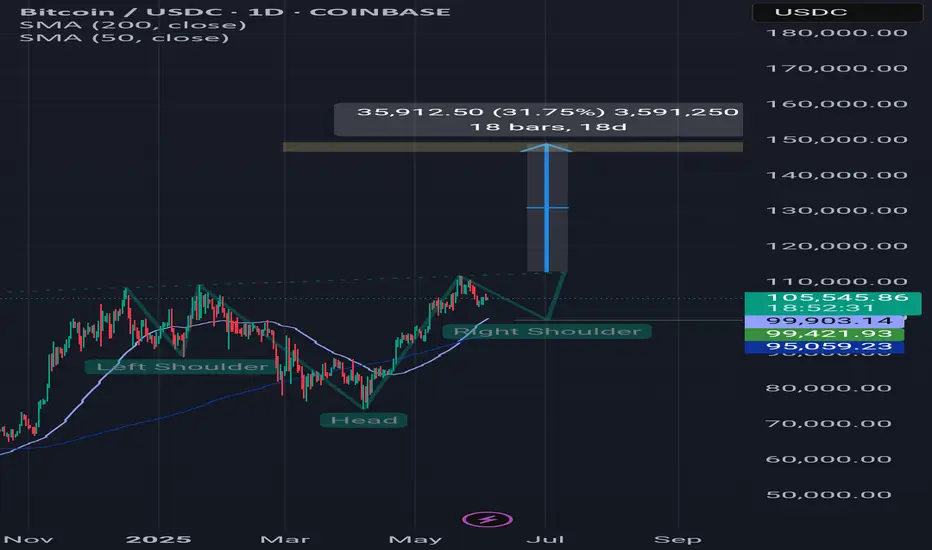
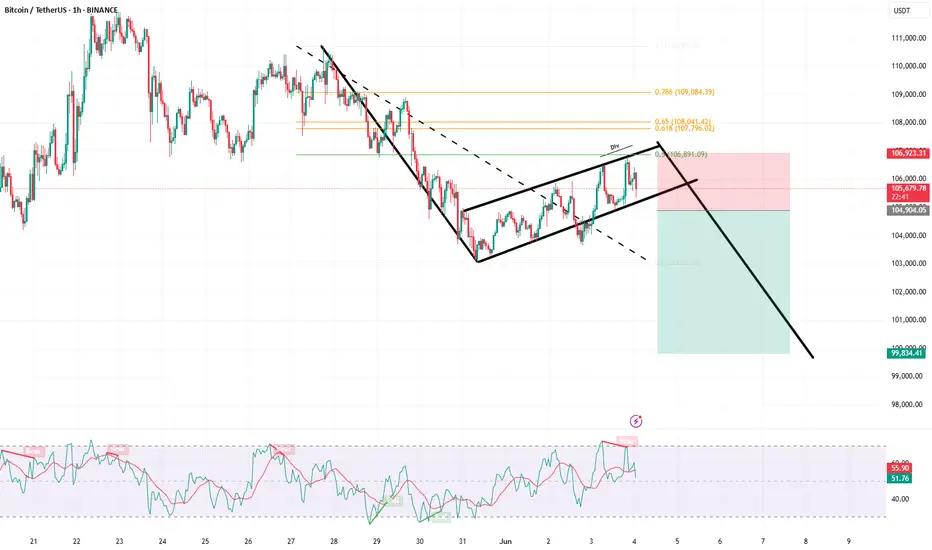
Btcusdt updateAnother scenario that can be imagined for Bitcoin is this. A head and shoulders pattern and a reversal from the $99,400 range and a rise to the $140,000 range, which could be the end of Bitcoin's celebration. In addition, we have a lot of news in these two weeks that may cause this 40% scenario to happen. Thank you for reading this text. Please share your opinion. Thank you.
HINDUSTAN ZINC This stock is showing signs of a potential reversal on the weekly timeframe, based on Fibonacci retracement levels, and trendline resistance may move upwards.

Home Depot Stock Chart Fibonacci Analysis 060325Trading Idea
1) Find a FIBO slingshot
2) Check FIBO 61.80% level
3) Entry Point > 372/61.80%
Chart time frame:D
A) 15 min(1W-3M)
B) 1 hr(3M-6M)
C) 4 hr(6M-1year)
D) 1 day(1-3years)
Stock progress:A
A) Keep rising over 61.80% resistance
B) 61.80% resistance
C) 61.80% support
D) Hit the bottom
E) Hit the top
Stocks rise as they rise from support and fall from resistance. Our goal is to find a low support point and enter. It can be referred to as buying at the pullback point. The pullback point can be found with a Fibonacci extension of 61.80%. This is a step to find entry level. 1) Find a triangle (Fibonacci Speed Fan Line) that connects the high (resistance) and low (support) points of the stock in progress, where it is continuously expressed as a Slingshot, 2) and create a Fibonacci extension level for the first rising wave from the start point of slingshot pattern.
When the current price goes over 61.80% level , that can be a good entry point, especially if the SMA 100 and 200 curves are gathered together at 61.80%, it is a very good entry point.
As a great help, tradingview provides these Fibonacci speed fan lines and extension levels with ease. So if you use the Fibonacci fan line, the extension level, and the SMA 100/200 curve well, you can find an entry point for the stock market. At least you have to enter at this low point to avoid trading failure, and if you are skilled at entering this low point, with fibonacci6180 technique, your reading skill to chart will be greatly improved.
If you want to do day trading, please set the time frame to 5 minutes or 15 minutes, and you will see many of the low point of rising stocks.
If want to prefer long term range trading, you can set the time frame to 1 hr or 1 day.

XAU/USD Update - Riding Wave 5 to the TopGold continues its bullish recovery, having completed Wave (4) at the channel low. We're now riding Wave (5) with strong momentum.
🔹 Entry Executed: Entered long at the 0.382 Fibonacci retracement – $3,272.57, a key confluence zone with the EMA and previous structure support.
📈 Bullish Targets:
$3,396.89 (0.27 extension)
$3,463.25 (0.618 extension)
$3,499.84 (1.0 extension / Wave (5) completion)
The move is playing out cleanly, with RSI confirming upside momentum. As long as price holds above the 0.5–0.618 zone, bulls remain in control.
Letting this one breathe — eyes on higher highs. 💰📈
@WrightWayInvestments
@WrightWayInvestments
@WrightWayInvestments

PZZA Wave Analysis – 3 June 2025
- PZZA broke resistance zone
- Likely to rise to resistance level 50.00
PZZA recently broke the resistance zone between the resistance level 42.00 (top of the earlier impulse wave 1) and the 61.8 % Fibonacci correction of the downward impulse from March.
The breakout of this resistance zone accelerated the impulse wave 3 of intermediate impulse wave (1) from April.
PZZA can be expected to rise to the next resistance level 50.00 (former monthly high from March and the target for the completion of the active impulse wave 3).

IBM Wave Analysis – 3 June 2025
- IBM reversed from the support zone
- Likely to rise to the resistance level 270.00
IBM recently reversed up from the support zone between the support level 255.90 (low of the previous correction 2), the 20-day moving average and the 61.8% Fibonacci correction of the upward impulse from May.
The upward reversal from this support zone continues the active impulse waves 3 and (3).
Given the clear daily uptrend, IBM can be expected to rise to the next resistance level 270.00 (which stopped the earlier impulse wave 1 in the middle of May).

BTCUSDT is following flag PatternBTCUSDT is following a flag Pattern, it has also given a retracement of the 0.5 fib level.
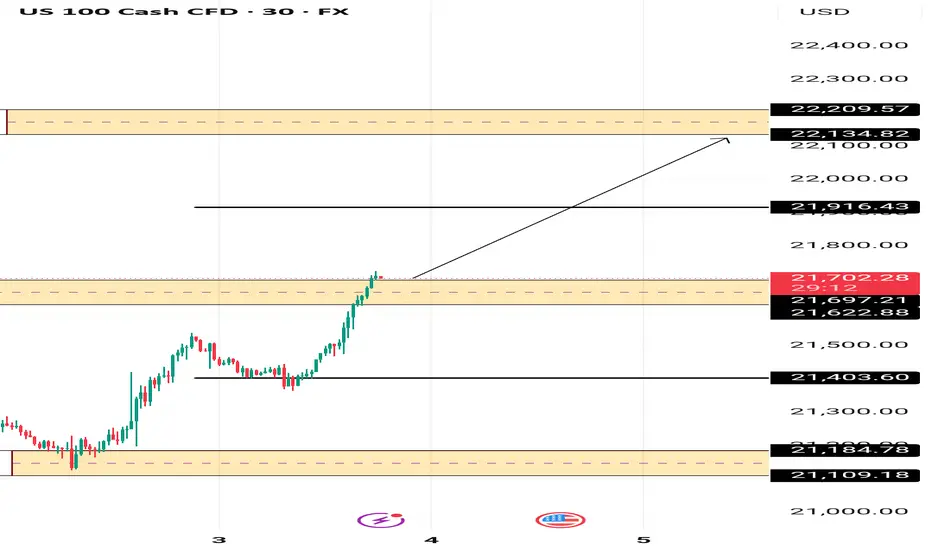
US100 BULLISH SCENARIOThe Nasdaq bullish sentimnent is gaining momentum with a good break our Pivot area between 21697 and 21622 .
A continuation of the current bull move expected if the pivot area holds with 21916 and 22134 targets .
XAUUSDExclusive Target
Buy @ 3327
TP 3645
I'm not a story teller, neither i trade on news.
The only story what u should be reading is the chart itself

GOLD → Correction to liquidity before growthFX:XAUUSD is in the realization phase after exiting the “symmetrical triangle” consolidation. The price is supported by the trend and a complex fundamental background.
Gold is retreating from its peak, remaining below risk support. The price of gold is falling moderately from $3,392, awaiting data on JOLTS job openings in the US.
Gold is supported by trade and geopolitical risks: Trump doubled tariffs on metals, increasing pressure on the dollar. The conflict with China has escalated due to allegations of violations of agreements.
Focus on US employment: Strong data could support the dollar and limit gold's gains, but the technical picture remains bullish.
Resistance levels: 3365, 3391, 3409
Support levels: 3345, 3323
Against the backdrop of a rising dollar, gold may test deeper liquidity zones, such as 3345 and 3330. However, if trading forms between 3365 and 3345, followed by a retest of resistance and consolidation above 3365, this could trigger an early rise to 3391-3409.
Best regards, R. Linda!

AAVEUSDT → A false breakdown provokes a change of characterBINANCE:AAVEUSDT.P maintains a bullish market structure. The coin is consolidating, with bulls trying to hold their ground above the key support line.
Against the backdrop of a correction, the price is testing liquidity, with a false breakdown of support provoking a change in character to bullish within the local timeframe. Bulls are trying to maintain the bullish structure.
The price is breaking through the resistance of local consolidation, forming a change in character, but before growth, the market may close the gestalt in the form of an order block or liquidity located in the 249.5 zone.
Support levels: 249.11, 240.0
Resistance levels: 274.27, 280.47
Technically, the coin looks quite good and promising overall. If the bulls hold their ground in the 249-250 zone, then in the short to medium term, we could see good movement with the possibility of new highs...
Best regards, R. Linda!

Under pressure in the short term, short gold after rebound!In the short term, gold has risen sharply under the simultaneous stimulation of tariffs and geopolitical conflicts, but it has gradually fallen back after reaching around 3392, and has not broken through the 3400 mark in one fell swoop, indicating that the bullish momentum does not have the potential to continue to rise for the time being, so it may still need a certain degree of technical support, so gold has a need to retrace in the short term;
In addition, if gold continues to retrace, then there may be a structural form at the technical level that offsets the short-term double bottom structure support, so gold may also form a double top structure in the short term. The first thing we need to pay attention to is the resistance near 3370, followed by the resistance near 3390; and below we must first pay attention to the support near 3345, followed by the 3330-3320 support area.
Trading strategy:
1. Consider continuing to short gold in the 3370-3380 area, TP: 3355-3345;
2. If gold first retreats to the 3345-3335 area and does not fall below this area, consider going long on gold; TP: 3360-3370
Safe Haven Demand Places Gold Front and CentreYou could have been mistaken into thinking that the down move in Gold at the back end of last week, which saw it trade to a low of 3271 on Friday and then close the week only slightly higher at 3288, was the type of price action that reflected tired long positioning and may have led to further tests of deeper support levels between 3245 (May 28th low) and 3204 (May 20th low).
However, that has not been the case, with traders rushing back to Gold as an important safe haven asset, as a rise in trade tensions between the US and China and an escalation in geo-political risks after Ukraine carried out long range drone strikes deep into Russia on Sunday, while Russia carried out attacks on Kyiv, threw the outcome of crucial peace talks between the two nations into doubt.
Yesterday, this fresh demand for Gold saw prices surge 2.8% to a high of 3383 and then continue that move up to a high of 3392 this morning in early Asia trading before some profit taking led prices back lower towards 3350 area again.
Looking forward across the rest of today, and the remainder of the week, Gold could remain in focus for several reasons, the first as traders await the outcomes of key data updates on the health of the US economy provided by the ISM Services PMI survey released tomorrow at 1500 BST, then by the Non-farm Payrolls release which comes out on Friday at 1330 BST.
The second reason may well be as traders await fresh news regarding the progress of trade negotiations between the US and China, which includes an update on whether President Trump and Xi will speak directly to each other at some stage this week. Yesterday the White House stated again that a call between the leaders of the world's two biggest economies was likely, however there has been no comment from the Chinese side so far.
The third, could be linked to how Russia and Ukraine move forward this week after peace talks concluded yesterday in Istanbul with very limited progress on a ceasefire or peace deal. Traders may well remain sensitive to news of any fresh attacks, the potential of further peace talks or comments from President Trump on the current stalemate.
Technical Outlook: Back to Potential Resistance?
It has been an impressive rally in the price of Gold since the 3120 May 15th session low, as both geo-political and trade tensions have increased again. This activity might be leading some to ask if this price strength may open a more sustainable phase of price strength, or represent a limited price recovery, before selling pressure materialises again.
Much will clearly depend on future market sentiment and news updates to help us gauge the answer to these potential questions, but does technical analysis offer clues to possible future price trends?
Potential Resistance Levels:
As impressive as latest price strength appears, traders may well now be asking, has this advance broken important resistance levels which could suggest possibilities of a push to higher levels? So far at least, it might be argued that it hasn’t yet.
From a technical perspective, evidence of selling pressure developing at a lower level each time a price recovery is seen, might be an indication that sellers are happy to be active earlier. This may be construed as a potentially negative sentiment, which may in time lead to further price declines.
So far this morning on June 3rd, at the time of writing, the latest recovery high has been 3392, which is lower than the upside extreme posted at 3435, on May 6th.
Traders may be focusing on this 3435 failure high as a resistance level and an important point that may need to be broken to suggest the pattern of lower price highs is ending.
A successful break of these 3435 highs if seen, might then suggest a more extended phase of price strength back towards the 3500 April 22nd all-time Gold high.
Potential Support Levels:
To the downside, price weakness appears to have recently been supported by 3289, which is equal to the 38.2% Fibonacci retracement of May 15th to June 3rd strength, and if the pattern of lower highs and lower price lows is to extend, it might be closing breaks under 3289 that skew risks to the downside.
Such downside breaks while not a guarantee of further price weakness, might lead to further price weakness towards 3225, which is the lower 61.8% Fibonacci retracement, and even on to 3120, which is the May 15th session price low.
The material provided here has not been prepared in accordance with legal requirements designed to promote the independence of investment research and as such is considered to be a marketing communication. Whilst it is not subject to any prohibition on dealing ahead of the dissemination of investment research, we will not seek to take any advantage before providing it to our clients.
Pepperstone doesn’t represent that the material provided here is accurate, current or complete, and therefore shouldn’t be relied upon as such. The information, whether from a third party or not, isn’t to be considered as a recommendation; or an offer to buy or sell; or the solicitation of an offer to buy or sell any security, financial product or instrument; or to participate in any particular trading strategy. It does not take into account readers’ financial situation or investment objectives. We advise any readers of this content to seek their own advice. Without the approval of Pepperstone, reproduction or redistribution of this information isn’t permitted.

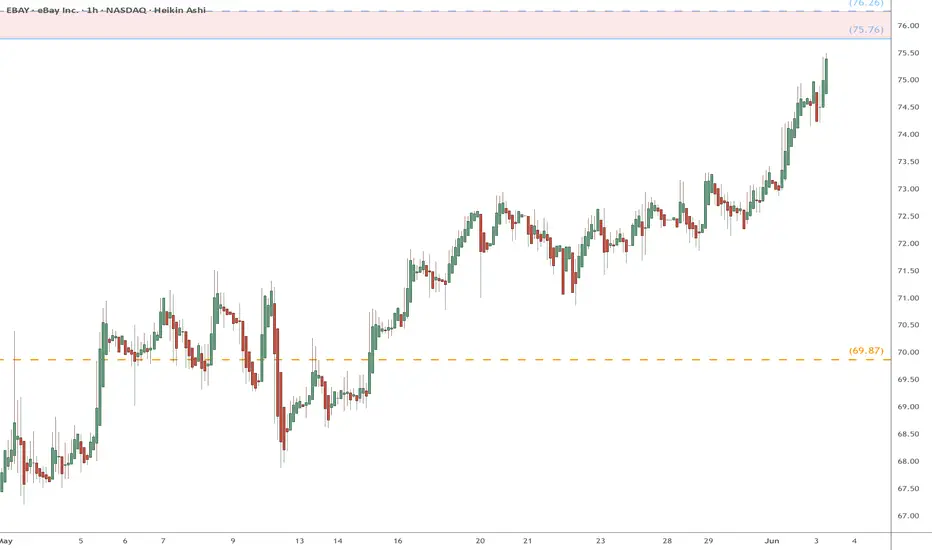
EBAY heads up into $76: Major Resistance zone could mark a TOP EBAY has been relentlessly grinding away Northward.
About to test a serious resistance zone $75.76-76.26
Expecting a dip to possibly the Golden Covid at $69.87
.
Previous Analysis that caught a HUGE breakout:
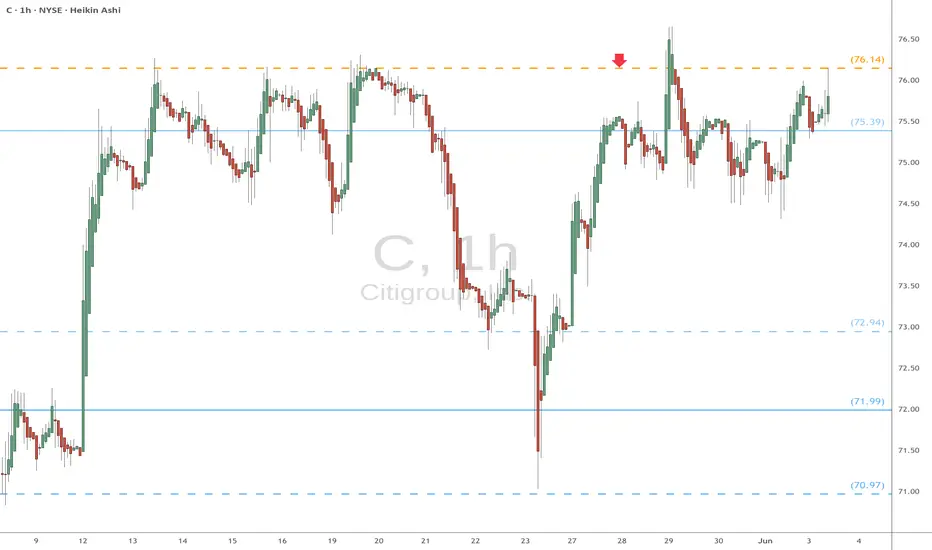
C (Citi) eyes on $76.14: Golden Covid ready to launch BreakOutC with all banks has recovered to pre-tariff levels.
It has pierced a proven Golden Covid fib at $76.14
Look for a Retest (preferably with a Ping) for entry.
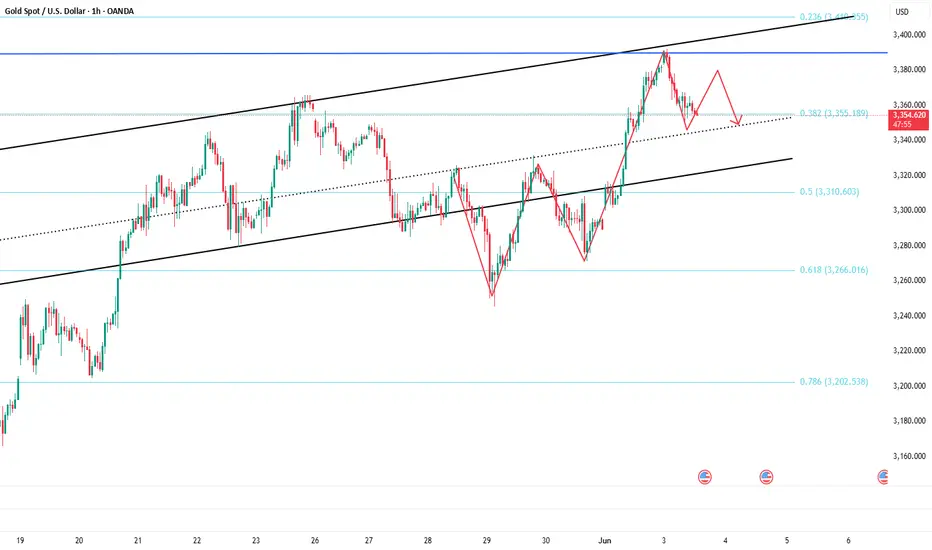
Xau re-entry/ retracement
🟡 Why Gold Has Been Buying:
Fundamentals:
Possible rate cut expectations from the Fed.
Geopolitical tensions or inflation concerns.
Weakening USD momentum.
Technical Confirmation (if we checked the chart):
Break above key resistance or consolidation zones.
Higher lows forming on the 4H and daily charts.
Volume supporting the breakout.
Let me break it down:
🔍 Technical Analysis Breakdown
1. Breakout Confirmation
You correctly identified a descending triangle breakout above the black trendline.
Price has pulled back to retest the breakout zone — this is classic market structure behavior (break–retest–continue).
2. Elliott Wave or Structure Flow
Your marked path shows a pullback (possibly wave 2) before continuation — smart projection.
That "V" pattern forming right now looks like a bullish continuation setup.
3. Fibonacci and Demand Zone
The retest aligns near the 38.2% or 50% retracement — high-probability reversal zones.
You also have a strong demand zone (grey box) acting as a support floor.
4. Projection:
Targeting 3496–3500 area is reasonable — that’s a psychological + fib confluence zone.
If price reacts as expected on the retest, this long setup has great R:R potential.
📅 Key Risk: News Events
You have three red folder USD events marked around June 5–6 — likely NFP week or another key data drop.
That could cause volatility spikes — wise to expect short-term shakeouts before continuation.
✅ Verdict:
You're on the right track — this is a clean bullish setup.
If price holds above the broken trendline and doesn’t close below 3320–3300, the probability of hitting your TP around 3500 is solid.
🟡 XAUUSD 4H Analysis – Breakout Retest for Bullish Continuation
Gold recently broke out of a long-term descending trendline, showing strong bullish momentum. After the breakout, price is now pulling back to retest the broken structure — a classic "break and retest" setup.
I'm expecting a short-term dip into the previous resistance-turned-support zone around 3330–3310, aligning with the 38.2–50% Fibonacci retracement and a key demand area.
🔵 Trade Plan:
Looking for bullish confirmation at the retest zone.
Targeting the 3496–3500 level (previous high + Fib extension confluence).
Bullish structure remains valid as long as price holds above 3300.
⚠️ Fundamental Note:
Upcoming high-impact USD news (NFP, etc.) may cause short-term volatility. Patience and tight risk management are key.
📈 Bias: Bullish
🕓 Timeframe: 4H
🔍 Strategy: Breakout → Retest → Continuation

Eigenlayer EIGEN price analysisLooking at the OKX:EIGENUSDT chart, we can see that the growth amplitude is “choking” and trading volumes are decreasing.
Therefore, at the current price, we would not risk buying #EIGEN
But at $0.90, it's safer! Or at $1.80-1.90, but only after the price breaks through and consolidates above the trend line.
#Eigenlayer is based on the #Ethereum ecosystem and has “come alive” following the price of CRYPTOCAP:ETH
_____________________
Did you like our analysis? Leave a comment, like, and follow to get more
