GBP/USD LONG GBP/USD LONG " break of a resistance area and retest it + 50% fib retracement + 50 ema dynamic support "
Fibonacci

Pepe’s Dog ZeusPepe’s Dog Zeus is a meme coin character in Matt Furies’ Universe. I’m hoping to liquidate the previous lows and start reversing at the short take profit fib 1.168

The return of the ICO. AI Style?Virtuals Genesis Launches is one of the most interesting things I have seen in a long time. The Virgen points system is really well done. Allowing projects to both raise the starting capital they want as well as getting a lot of smaller holders that can be early users/promoters. All the attention Virtuals got previously was from the Prototype Agents setup. That setup is honestly kind of garbage. My goal is to farm points and get small exposure to a lot of AI start-up ideas. Many of these will fail but a lot of them are really trying to build something interesting. Unlike IPO's it allows small investors to back projects early. Typically the range seems to be 0.01 to 566 Virtual. That's roughly 2 cents to $1132.
Found support above 34 EMA around $1.80.
MACD is trending down on the daily chart now.
RSI is heading down.
STOCH RSI is also not showing anything bullish currently.
Though I am holding spot Virtuals, there is a lot of evidence to show price could go down here. There is currently not a lot of great news for bulls.
Disclaimer: The information provided in this post is for educational and informational purposes only. It does not constitute financial advice, investment recommendations, or a solicitation to buy or sell any financial instruments. All investments involve risk, and the past performance of a security, market, or trading strategy does not guarantee future results. I am not a financial advisor. Please conduct your own thorough research and consult with a qualified financial professional before making any investment decisions. You are solely responsible for any investment decisions you make.

Critical Support Test for Bitcoin: 100K Holding or Breaking? Dear Traders,
Bitcoin's previous support level of 106,000.00 has now been broken, turning it into a resistance point.
At this moment, Bitcoin is at a critical stage, and the most important support level is 100,000.00.
In this zone, rather than opening a position, it is wiser to observe carefully.
If the 100,000.00 support level breaks, I will provide you with a downward target.
If Bitcoin holds at this level and finds support, I will share an upward target.
Right now, Bitcoin is choosing its direction. Will the whales push the price up with their purchases, or drive it down with their sales? We have to watch patiently, like a hunter, to see how this unfolds.👀
Each and every one of you is incredibly valuable to me! I am always working hard to bring you the most accurate and insightful analysis.
A huge thank you to everyone who supports my work by leaving likes.🙏

Cookie the AI alpha seeker.Cookie is a very interesting application. Like Coingecko for AI Crypto projects. I am seeing other platforms build their insights into their websites. A change in regulatory environment has allowed AI projects to come out in a way that has not been seen since ICO era. What has changed is it become viable to publicly fund projects again without fear of regulators. As regulatory bodies in the US like the SEC, seen as hostile to crypto last year are now much more friendly. At #382 on CoinGecko this project is still relatively small. People who want to find and buy AI projects definitely want Cookie as a data source.
The chart is beautiful for Long positions. You have very clean trend of higher highs and higher lows. While riding on the moving averages. I am using 8 SMA, 21 EMA, 34 EMA, 50 SMA, and 200 SMA. With a previous price low around 15 cents, the price needs to remain above that level.
MACD is moving up consistently with the price action. I am not seeing anything concerning here. As I am interested in day and week trends not intraday trades.
With a previous high of 78, there is still a lot of room to work with.
Looks like this could be just the start of this move.
Disclaimer: The information provided in this post is for educational and informational purposes only. It does not constitute financial advice, investment recommendations, or a solicitation to buy or sell any financial instruments. All investments involve risk, and the past performance of a security, market, or trading strategy does not guarantee future results. I am not a financial advisor. Please conduct your own thorough research and consult with a qualified financial professional before making any investment decisions. You are solely responsible for any investment decisions you make.

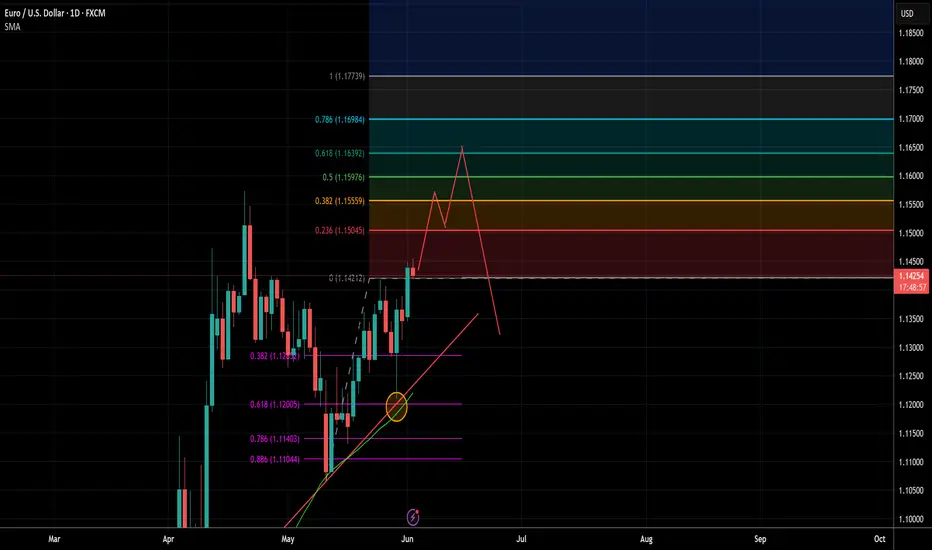
EURUSD - Swing Short Potential OpportunityEURUSD may potentially retest the previous high and trade between fib extension levels 38.2% and then range potentially in that level before pushing higher to the 61.8% extension level retesting and breaking out for a liquidity grab and stop hunt for retails before pushing back down trending back to the mean and retesting previous floor. The 1.1550 & 1.1650 are key historic levels where there has been lots of EURUSD previous action. Expect price to bounce around these areas and trap longs what I think has a high probability of happening per my prediction.
$POPCAT - Chance of Seeing $1 in Q3
Haven’t posted much about Solana coins lately, but they’re starting to show signs of life again.
$POPCAT had a clear entry right at the weekly FVG below 33c. From here, it either retests the Monthly Open or begins a slow grind higher.
It performed exceptionally well last year, so there’s a good chance to offload some around the $1 mark if momentum picks up. BYBIT:POPCATUSDT

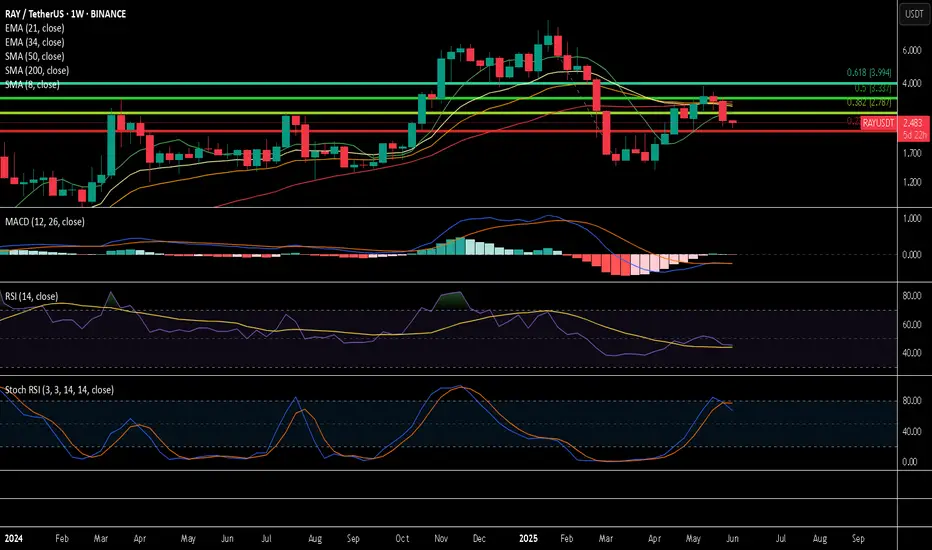
RAY the end or just the start?To first look at Ray we can start with RAYUSDT and move to RAYSOL and RAY BTC.
RAY is not sitting below all of the moving averages. Not an ideal position.
So far MACD cross down does not mean much as the week has not ended yet. Ideally to stay bullish it need to end the week not crossed down.
Stoch RSI cross down
Below 0.015 there is elevated risk that RAYSOL puts in a lower local low.
RAYBTC also not looking great.
With these charts it's pretty hard to make the case why I am long RAY. Let's try some long term fundamentals and see if that is a better picture.
Ray is all about the saying own the shovels. As an exchange the better Solana does the better Ray likely does. It's a widely known DEX it's weaknesses are Solana not getting trade volumes again. Competitors where other DEX are better. Also DEX aggregators have risks the volume does not get sent to Ray.
Disclaimer: The information provided in this post is for educational and informational purposes only. It does not constitute financial advice, investment recommendations, or a solicitation to buy or sell any financial instruments. All investments involve risk, and the past performance of a security, market, or trading strategy does not guarantee future results. I am not a financial advisor. Please conduct your own thorough research and consult with a qualified financial professional before making any investment decisions. You are solely responsible for any investment decisions you make.
AAPL Long HereSetups here for longs
This looks good for an entry at market on open but flat of lower would be preferred

Apple Stock Chart Fibonacci Analysis 060225Trading Idea
1) Find a FIBO slingshot
2) Check FIBO 61.80% level
3) Entry Point > 200/61.80%
Chart time frame:D
A) 15 min(1W-3M)
B) 1 hr(3M-6M)
C) 4 hr(6M-1year)
D) 1 day(1-3years)
Stock progress:A
A) Keep rising over 61.80% resistance
B) 61.80% resistance
C) 61.80% support
D) Hit the bottom
E) Hit the top
Stocks rise as they rise from support and fall from resistance. Our goal is to find a low support point and enter. It can be referred to as buying at the pullback point. The pullback point can be found with a Fibonacci extension of 61.80%. This is a step to find entry level. 1) Find a triangle (Fibonacci Speed Fan Line) that connects the high (resistance) and low (support) points of the stock in progress, where it is continuously expressed as a Slingshot, 2) and create a Fibonacci extension level for the first rising wave from the start point of slingshot pattern.
When the current price goes over 61.80% level , that can be a good entry point, especially if the SMA 100 and 200 curves are gathered together at 61.80%, it is a very good entry point.
As a great help, tradingview provides these Fibonacci speed fan lines and extension levels with ease. So if you use the Fibonacci fan line, the extension level, and the SMA 100/200 curve well, you can find an entry point for the stock market. At least you have to enter at this low point to avoid trading failure, and if you are skilled at entering this low point, with fibonacci6180 technique, your reading skill to chart will be greatly improved.
If you want to do day trading, please set the time frame to 5 minutes or 15 minutes, and you will see many of the low point of rising stocks.
If want to prefer long term range trading, you can set the time frame to 1 hr or 1 day.

Log scale fibonacci levels for Avalanche (AVAX)fibonacci levels on log scale describe levels of confluence indicating market tops and bottoms, as well as other market price characteristics (support/resistance levels)

Gold Long: Wave 5 of 3Over in this video, I updated the Elliott Wave Counts for Gold Long. If I'm not wrong, we have finished wave 4, although the ideal entry is at 3344.
The Stop loss is 3354 if you entered now, and 3328 if you enter at 3344 (watch video for explanation).
The most important price target is 3438 which was the high on 7th May 2025 and 78.6% of wave 1 of a higher degree (watch video for explanation), although it is not the ultimate price target.
Good luck!

Keep gold shorts open and look forward to profits!After breaking through the resistance areas near 3335 and 3355, gold continued to rise to around 3379; although the rise in gold was relatively large, after gold touched above 3370, the bullish momentum weakened and there were signs of high-level stagflation, so gold is still expected to usher in a wave of retracement in the short term.
After the sharp rise in gold, the current relatively obvious support area is located in the 3345-3335 area. If gold cannot effectively break through 3380, then gold is expected to retrace to test the support of the 3345-3335 area again.
As the trading strategy shared in my previous opinion, I have shorted gold in batches in the 3370-3380 area as planned. At present, we still hold short positions. Let us look forward to the expected retracement of gold!
CAPITALCOM:GOLD OANDA:XAUUSD FOREXCOM:XAUUSD TVC:DXY

USO Stock Chart Fibonacci Analysis 060225Trading Idea
1) Find a FIBO slingshot
2) Check FIBO 61.80% level
3) Entry Point > 67.8/61.80%
Chart time frame:B
A) 15 min(1W-3M)
B) 1 hr(3M-6M)
C) 4 hr(6M-1year)
D) 1 day(1-3years)
Stock progress:A
A) Keep rising over 61.80% resistance
B) 61.80% resistance
C) 61.80% support
D) Hit the bottom
E) Hit the top
Stocks rise as they rise from support and fall from resistance. Our goal is to find a low support point and enter. It can be referred to as buying at the pullback point. The pullback point can be found with a Fibonacci extension of 61.80%. This is a step to find entry level. 1) Find a triangle (Fibonacci Speed Fan Line) that connects the high (resistance) and low (support) points of the stock in progress, where it is continuously expressed as a Slingshot, 2) and create a Fibonacci extension level for the first rising wave from the start point of slingshot pattern.
When the current price goes over 61.80% level , that can be a good entry point, especially if the SMA 100 and 200 curves are gathered together at 61.80%, it is a very good entry point.
As a great help, tradingview provides these Fibonacci speed fan lines and extension levels with ease. So if you use the Fibonacci fan line, the extension level, and the SMA 100/200 curve well, you can find an entry point for the stock market. At least you have to enter at this low point to avoid trading failure, and if you are skilled at entering this low point, with fibonacci6180 technique, your reading skill to chart will be greatly improved.
If you want to do day trading, please set the time frame to 5 minutes or 15 minutes, and you will see many of the low point of rising stocks.
If want to prefer long term range trading, you can set the time frame to 1 hr or 1 day.

Bitcoin: Underlying Fib HeatmapReceived a request to add .886 to upward channels and remove a b&w fib layer which concealed another pair of fib channels that also extends from 2020 and makes up spectrum of colors from a research idea.
Result:
Sharing this publicly as it may be of interest to others in the field, and to leverage the interactive features for enhanced tracking and ongoing refinement of the model.

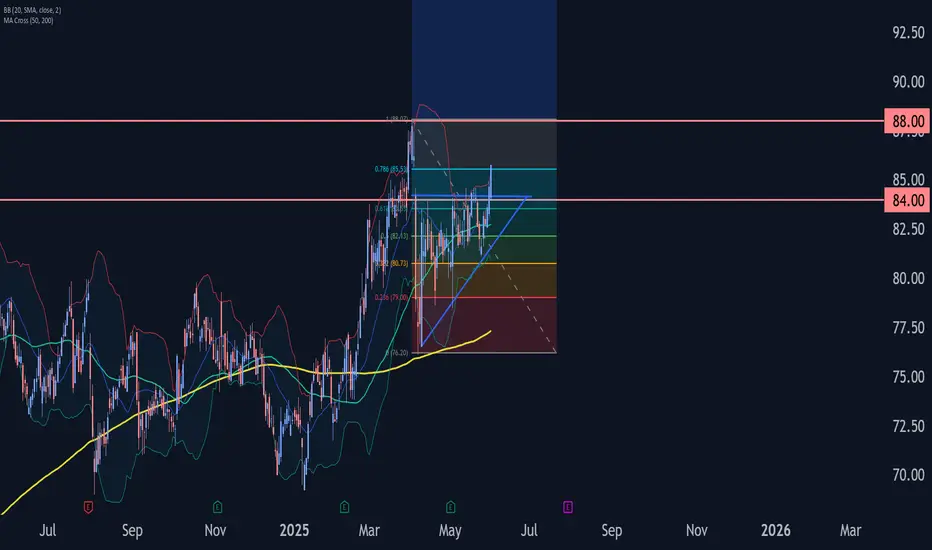
AIG Wave Analysis – 2 June 2025
- AIG broke daily Ascending Triangle
- Likely to rise to resistance level 88.00
AIG recently broke the resistance zone between the resistance level 84.00 and the 61.8% Fibonacci correction of the downward wave (2) from March.
The breakout of this resistance zone coincided with the breakout of the daily Ascending Triangle from the start of April.
Given the clear daily uptrend, AIG can be expected to rise to the next resistance level 88.00 (which stopped the earlier sharp impulse wave (1)).
BSE Ltd – Completion of a 5-Wave ImpulseBSE Ltd appears to have completed a five-wave impulsive advance following a prior flat correction. Wave 5 has reached the 1.618 Fibonacci extension of Wave 1 and touched the upper boundary of a well-defined ascending channel — suggesting a potential short-term top.
If a correction unfolds from here, it may take the form of a zigzag or a flat. Key Fibonacci retracement levels to watch:
Target 1: 2,159 – 0.382 retracement
Target 2: 1,981 – 0.5 retracement
Target 3: 1,803 – 0.618 retracement
The invalidation level for this setup is around 2,736.20 . A sustained move above this would indicate that the uptrend may still be in progress.
Price action in the coming sessions will be key to confirming the next direction.
Disclaimer: This analysis is for educational purposes only and does not constitute investment advice. Please do your own research (DYOR) before making any trading decisions.

ETHUSD short-term🔍1. Technical situation
ETH/USD is in a consolidation phase — the price is moving in a rather narrow range, without a clear upward or downward trend.
📊
The upper limit of this consolidation is the resistance zone of USD 2,664–2,717 (green rectangle on the chart).
The lower limit is the support zone of USD 2,495–2,446 (red rectangle).
2. Potential formation
A potential double bottom formation can be seen on the chart, which is a classic trend reversal formation to an upward one.
The lows occurred around May 25–31 and at the end of May.
Confirmation of the formation would be a breakout of the resistance zone of USD 2,664–2,717.
3. Technical indicators
RSI:
Currently, the RSI has rebounded from zone 40 and is heading up. Exceeding the 50 level may be a signal of buyers' strength and support for the bullish scenario.
On the chart: "Potential rebound signal - watch break above 50"
MACD:
MACD is close to generating a momentum change signal (potential intersection of the MACD and signal lines).
On the chart: "MACD near signal - watch for momentum shift"
4. Scenarios for the coming hours/days
Bullish scenario (up):
✅
If the price breaks above USD 2,717 (exit from consolidation upwards), a dynamic move towards USD 2,800 can be expected.
Support for this scenario will be signals from RSI and MACD.
Bearish scenario (down):
🔻
If the price rejects the resistance zone and returns below USD 2,446, the risk of going down to the next support in the area of USD 2,300 increases.
🧠
Summary
Key Levels:
📌
Support: $2,495-$2,446
Resistance: $2,664-$2,717
Currently, the market is in consolidation with an attempt to break out to the top.
Watch for: Resistance breakout (potential bullish signal) and support reactions (potential bearish).
Pattern: Potential double bottom - needs confirmation.

AZO eyes on $3841: Golden Covid roof, awaiting Trump tariffsTariffs on new cars expected to boost used car upkeep.
AZO is bobbing up against a Golden Covid fib at $3841.58.
Break could be powerful, or reject as a top if tariffs wimper.
=====================================================

NUKK bottomed at $13.26? Golden Genesis fib for the ideal BOTTOMNUKK has been getting nuked all year (lol).
Just bounced off a Golden Genesis fib at $13.26
There is a good chance that was 'the" bottom.

XAUUSD Possible Sell XAUUSD is heading to grab the upper internal liquidity before pulling back down again so a sell opportunity is in place and lower time confirmation is needed for entry . The current daily market structure is still bullish and this idea is counter trend .
Good LUck

GBP/USD Testing Resistance- Battle Lines Drawn into June OpenOne of the cleaner setups into the start of the week / month- Sterling opens the session with a test of confluent resistance into the yearly high-day close (HDC) at 1.3564- looking for a reaction there today with a breach / close above needed to fuel the next leg of the advance towards 1.3671-1.3705.
Initial support rests with the 2019 high at 1.3515 backed closely by the 78.6% retracement / 2024 high at 1.3414/34- note that the median-line converges on this threshold over the next few days and a break / close below would suggest a more significant high was registered last month / a larger reversal is underway.
-MB

Gold at Resistance into June Open- Decision Time for the BullsGold is poised to mark the largest single-day advance in nearly a month with XAU/USD stretching back into resistance at 3355/80- a region defined by the 61.8% retracement of the April decline and the record high-day reversal close. Looking for a reaction off this mark with a close above the median-line needed to fuel a run towards the record high-close at 3431 and the all-time high at 3500.
Weekly / monthly open support rests at 3289 with key support / medium-term bullish invalidation now raised to the 61.8% retracement of the May rally near 3219.
-MB
