GOLD → Correction after distribution. Bullish trendFX:XAUUSD is testing the liquidity zone at 3350 and forming a false breakout of resistance within the uptrend. A correction is possible before growth continues.
The fundamental background is quite controversial in the market. In the current situation, the focus is on relations between Russia and Ukraine, especially after the escalation that took place over the weekend. Everyone is watching the ongoing negotiations in Turkey. In addition, we should not forget about the situation with tariffs, which is still quite tense.
Gold has been rallying since the opening of the session and has reached the order block. A false breakout of resistance is forming, which could trigger a correction to the zone of interest. The dollar is hitting support, which could form a local correction before continuing its movement. This could also affect the price of gold, which remains bullish in the market.
Resistance levels: 3350, 3365, 3409
Support levels: 3303, 3264
The price has broken out of consolidation, with resistance tested and liquidity above 3350 realized. Relative to the current level, a correction is possible with the aim of retesting support before continuing to rise.
Best regards, R. Linda!
Fibonacci

ETHUSDI am taking a long position on ETHUSD on FIB level 0.382-0.5 Retracement Entry Price will be 2520 with a SL of 2470 and TP of 2570

NET eyes on $130: High Support after Earnings bump and retrace NET got a nice boost after last earnings report.
The retrace is now at first support $130.38-130.73
IF that fails then we might drop to $122.34-124.07

Trading opportunities after gold accelerates its rallyTechnical analysis:
Gold has risen sharply and has broken through the resistance areas near 3330 and 3355. In the short term, gold has formed an upward force and has a clear willingness to rise. At present, gold bulls still have the potential to continue to test the 3370-3380 area. As gold rises and breaks through, the 3340-3330 area below has become a strong support in the short term; if gold cannot fall below this support area during the retracement, gold may even continue to rise and try to hit the 3405-3415 area.
Trading strategy:
1. Consider going long on gold after gold retreats to the 3340-3330 support area, TP: 3360-3370;
2. Consider going short on gold in small quantities after gold first touches the 3370-3380 area, TP: 3355-3345.

EAT eyes on $134: Earnings Dump fell into a key support to buy?EAT earnings report was apparently pretty bad.
Fell through several supports but trying to hold.
Watch critical and proven zone at $134.06-134.77

AGCO eyes on $88.47: Golden Genesis fib may End Bounce or PopAGCO earnings bounced to a Golden Genesis at $68.47
That is the highest gravity object for a long ways away.
What happens here will determine medium term trend.
It is PROBABLE that we orbit this a few times.
It is POSSIBLE that a Break-n-Retest runs up.
It is PLAUSIBLE for a rejection to new lows.
================================================

SHAK eyes on $87.87: Key fib may reject but likely Break-n-POPSHAK back to Tariff Relief top previously stopped by this fib.
Semi-Major Covid fib has been the barrier now, at $87.87
If dips, watch Golden Genesis zone below at $85.11-84.81

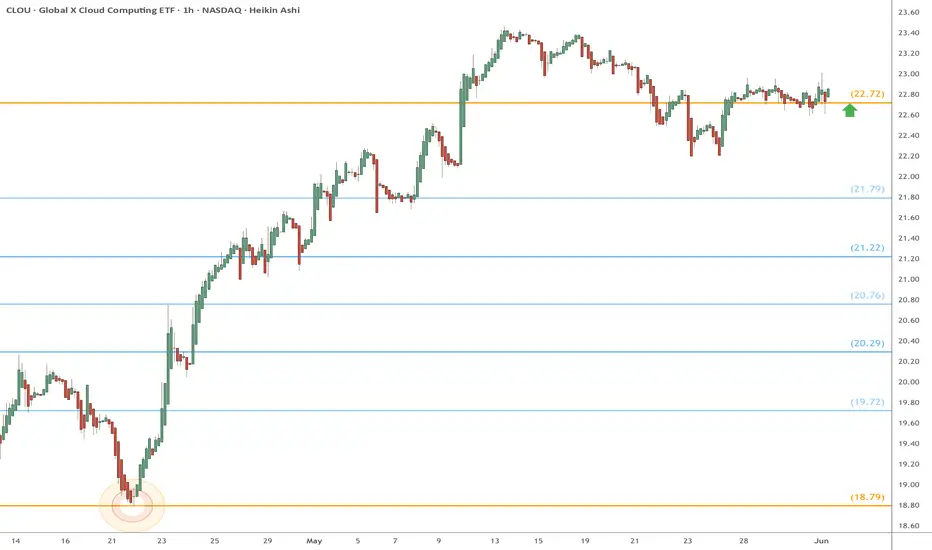
CLOU eyes on $22.72: Golden Genesis fib for high support CLOUCLOU currently orbiting a Golden Genesis fib at $22.72
Its sister golden below at $18.79 was the recent bottom.
Look for a pop from here with tight stop-loss just below.
ARMK eyes on $40.xx: Major Resistance zone for Bulls to BreakARMK has been floating up with the general market.
Currently testing a major resistance zone $39.86-40.47
Looking for a Dip-to-Fib or Break-and-Retest to enter.

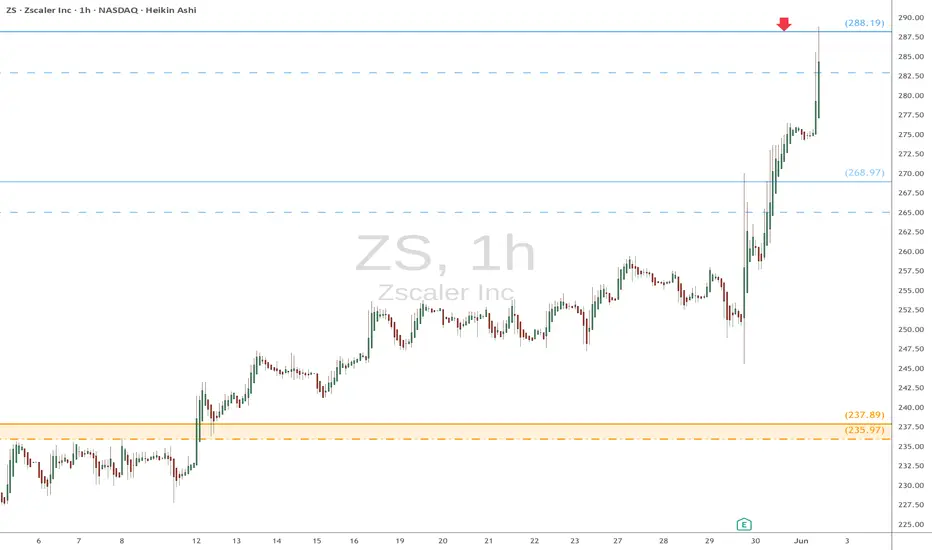
ZS heads up at $288.19: Semi-Major Genesis fib may cause a dip ZS has been flying after the last earning report.
It just hit a semi-major Genesis fib at $288.19
Look for a Dip-to-Fib or Break-n-Retest to enter.
BEARISH UCADUCAD has gone through its retracement phase and Is currently testing an area of Major Support. If we can get a close below and retest of support, we're looking for price to drop to our extension level! #BreakAndRetest #SupportAndResistance

CLF heads up at $7.51: Golden Genesis fib may give a Dip buyCLF shot up strong after Trump increased tariffs on Steel.
It has just hit a Golden Genesis fib that may give us a dip.
Looking for a dip to $7.06 fib or a Break-n-Retest of 7.51

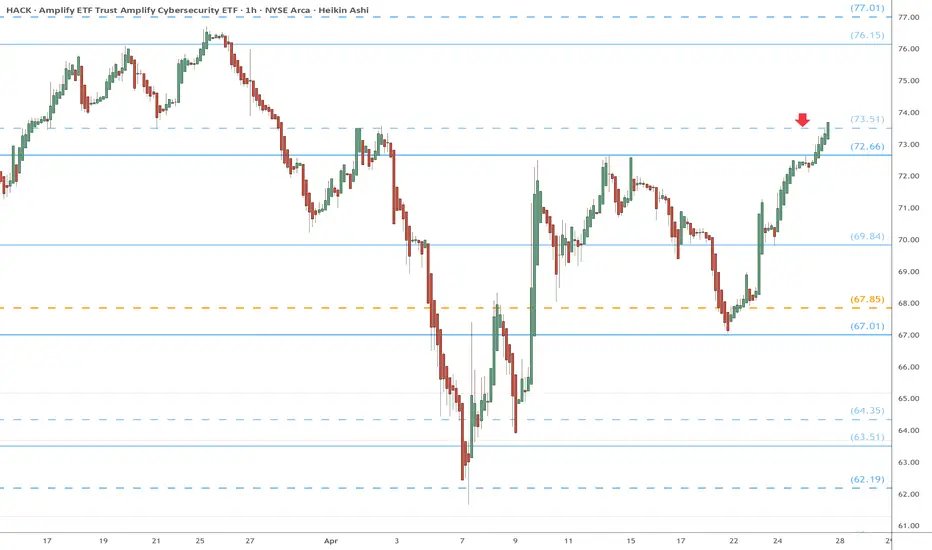
HACK eyes on $73.51: the last barrier to UpTrend resumptionHACK following Genesis and Covid fibs very well.
Just now trying to break the Covid fib at $73.51
But first it may well retest Genesis fib at $72.66
Link Correction complete? CRYPTOCAP:LINK Correction Nearing Completion? Key Levels to Watch
Recap
CRYPTOCAP:LINK continues to retrace and lose levels. Price action looks a bit incomplete on the Elliott wave side, but technicals suggest the retracement may be nearing its end.
The Setup
The cleanest scenario would see price make one more leg down into the 12.42 area. That level offers symmetry and structural balance for a completed correction.
If instead price breaks above 15.008, it opens the door for the correction to be considered complete. Still, confirmation would require a strong reaction from that move—not just a quick wick.
The Outlook
A defense of 12.42 would keep the bullish scenario alive. A break below that level, however, would weaken the outlook and raise the probability of an extended correction or trend continuation lower. Namely an impulsive move down. Right now, we have a potential correction, we need the PA to provide proof of what we have. Wave 4s and 5s at matching degrees as what has printed are need to prove an impulse and an invalidation will prove otherwise.
For now, the focus remains on reactions at these two levels. Watch closely— CRYPTOCAP:LINK could be setting up its next directional move.

#COMI - ACTION IN THE WAY - all market will rising soon or ??!!EGX:COMI is showing a potential triangle pattern.
BB support is at 79.15, making it a good entry point for a long position.
Prices are currently trading below the middle BB line (80.16), which has acted as resistance since the start of the month.
As long as prices stay above 78.60, they are likely to reach 83.20 eventually.
At June market may go to moon , just remember who told you first .
But still be caution more than optimistic or hopeful
At this point market may achieve new historical levels from anther hand EGX30 tray many times to close over 32200 but is failed.
No one is bigger than the market and remember Technical analysis is not an accurate science .
This is not financial advice, just our analysis based on chart data. Please consult your account manager before investing.
Thanks and good luck!

EURUSD → False breakout of resistance. Correction?FX:EURUSD is strengthening amid a decline in the dollar, but the currency pair is encountering strong resistance and forming a false breakout, which could trigger a correction.
EURUSD is testing the resistance range as part of a distribution and forming a false breakout. The market structure is bullish, with the price breaking through local resistance and updating its high. The inability to continue growth and price consolidation below 1.1418 may trigger a correction. The dollar is also hitting support and may form a small correction, which will put pressure on EURUSD
Resistance levels: 1.14246, 1.1418
Support levels: 1.1384, 1.1343
If the currency pair fails to consolidate above 1.14246 during the resistance retest in order to continue its growth, then we can expect price consolidation below this level to open a short position. The correction may reach the specified support zones before continuing its growth.
Best regards, R. Linda!

US100 (NASDAQ100)🎯 Current Bias: Bearish Short-Term
-Price has already formed a lower high and lower low structure.
-Sitting at a key retracement zone after recent drop.
-Smart money concept (CHoCH → BoS) suggests institutional repositioning for shorts.
💡 Trading Opportunities
1. Short Opportunity (Main Bias)
-Entry Zone: Between 0.5 to 0.618 retracement (21,220–21,260)
-Stop Loss: Above 0.382 level / local high (~21,300)
-Target 1: 21,117.5 (marked Fibonacci level)
-Target 2: 21,000 psychological / next POI
Confluence:
-Bearish market structure
-Premium zone tap + Fib retracement zone
-CHoCH and BoS confirming order flow shift
2. Countertrend Long (Aggressive & Lower Probability)
-Entry: If price hits 21,117.5 and forms a bullish CHoCH or internal BoS
-SL: Below 21,050
-Target: Revisit 0.5–0.618 zone or unmitigated supply above
⚠️ Risk Notes
-NFP/major US data could trigger volatility (always check the calendar).
-US100 can whipsaw during macro catalyst moments – avoid overleveraging.

Fib Channel Extending From 2020 To PresentThe Fractal Wave Marker is used in this analysis. It gives a multi-scale perspective of swing highs and lows - how the market moves across different time intervals.
Nested cycles (fractured pattern) reveals important order in phase transitions from small pullbacks to major trends. Basically making it easier to look for systematic patterns.
For example, with this tool we can easier spot a commonality like the identifying consistent angle that connects consecutive tops as well as bottoms by parallel lines that gives an idea of general direction.
If we were to use that channel as a topological expression to examine to what extent the fact of price happening there influenced probability density and what it changed in future price behavior , we would literally integrate it with broader scale fibonacci structures like: adding more ratios after 1 (not just 0 - 1) to illustrated chart above.
The implemented version would look something like this:
Chart-based curve aligning with angle of the channel - validating measurements in use.
Documenting the structural buildup for research purposes.

XAU/USD Buy Setup Explanation (Using Fibonacci Levels)This chart presents a bullish trading setup on gold (XAU/USD) based on a Fibonacci retracement strategy. It suggests a buy opportunity after a pullback.
✅ Fibonacci Levels:
> 0.0% (Top): $3,331 – recent swing high (used as reference)
> 23.6%: $3,312 – minor resistance zone
> 38.2%: $3,297 – initial pullback area
> 50.0%: $3,290 – psychological mid-level
> 61.8% (Golden Ratio): $3,280 – key Fibonacci support
> 78.6%: $3,266 – deeper retracement support
> 100% (Bottom): $3,249 – recent swing low
🟪 Buy Zone (Between 50% and 61.8%):
The marked BUY ZONE is between $3,290 and $3,280, aligning with the Fibonacci golden pocket.
This is a high-probability reversal area, as it combines:
Strong Fibonacci confluence (50%–61.8%)
Prior price reaction zones (structure-based support)
: TP1: $3,320 – aligns with previous structure zone and 23.6% retracement.
: Final Target: $3,350 – a retest of the major resistance and previous high.
📌 Conclusion:
This is a classic Fibonacci retracement long setup:
Wait for a bullish reversal pattern (e.g., pin bar, engulfing) in the buy zone.
As long as the price holds above $3,266, the bullish structure remains valid.
Ideal for swing traders looking to catch a bounce off the golden ratio support.

USDJPY Short: On the Wave 3 Train RideOver in this video, I go through in detail the breakdown of the Elliott Waves and the rationale for counting the waves as I did. In this video, i talk about setting the stop at around 144.10 and the short-term take profit target at around 139.92.
At the end, I remind us of the big picture head-and-shoulders where the longer-term target is around 127.21.
Thank you and Good Luck in your Trading!

$BTC/TETHER Daily Time Frame new ATH incoming?Bitcoin Market Outlook
Bitcoin has stalled after printing new all-time highs, now consolidating within a **supply zone** while forming a **bullish flag pattern**. Price is currently testing the **Fibonacci golden pocket** region (0.618–0.65), a critical level for potential reversal or continuation.
A **\$71M liquidation cluster** is stacked around **\$107,000**, just above current price—making it a key magnet for upward movement.
Bullish Scenario
* If price breaks above the supply zone and clears the \$107K liquidation area, we can expect a push toward **flag resistance**.
* A confirmed breakout from the flag could trigger **continuation to new highs**, supported by low resistance overhead and momentum from short liquidation.
Bearish Scenario
* If price fails to hold the golden pocket and breaks below **\$102,000**, a drop toward **\$99,000** is likely.
* This level is reinforced by **two unfilled Fair Value Gaps (FVGs)**, which may act as magnets for price rebalancing before potential recovery.
Let me know if you notice anything wrong with this, or have some charts of your own!
Thank you for reading.

NQ Power Range Report with FIB Ext - 6/2/2025 SessionCME_MINI:NQM2025
- PR High: 21348.50
- PR Low: 21295.25
- NZ Spread: 119.25
Key scheduled economic events:
09:45 | S&P Global Manufacturing PMI
10:00 | ISM Manufacturing PMI
- ISM Manufacturing Prices
13:00 | Fed Chair Powell Speaks
Holding inside Friday's range
Session Open Stats (As of 12:15 AM 6/2)
- Session Open ATR: 440.37
- Volume: 29K
- Open Int: 267K
- Trend Grade: Neutral
- From BA ATH: -6.2% (Rounded)
Key Levels (Rounded - Think of these as ranges)
- Long: 22096
- Mid: 20383
- Short: 19246
Keep in mind this is not speculation or a prediction. Only a report of the Power Range with Fib extensions for target hunting. Do your DD! You determine your risk tolerance. You are fully capable of making your own decisions.
BA: Back Adjusted
BuZ/BeZ: Bull Zone / Bear Zone
NZ: Neutral Zone

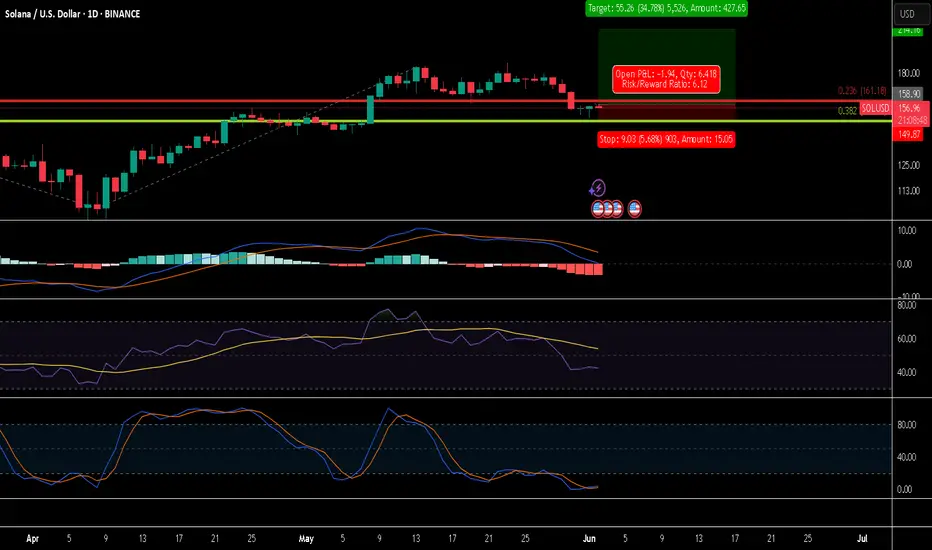
Will Solana continue to grow?I am definitely admittedly late to the party with Solana. Though I was very correct about the ride down to $8 and did not own any Solana for that. I was also wrong about The Return of Solana.
During the ride down from ~$300 to ~$100 I was able to get some Solana. Though most of it is liquid staked Solana now.
As seen in the image I think currently what makes the most sense is this being a pullback of the last rally in Solana.
I think focusing on daily Stoch RSI is more interesting currently then MACD and RSI. Looking to stay above 0.382 FIB above while also seeing Stoch RSI move up. If either of those fail then my current thinking must be reconsidered. As I am looking at typically weekly/daily spot moves the risks are different then people using leverage. Even if I use really small amounts of leverage to get 1.01, 1.10, etc. returns but not 10x leverage as an example.
Pros
Solana is seeing a lot of use
VC investors are likely try and push Solana to their peers, friends, etc.
Drift seems to have more feature as a DEX then most of what I have seen on Ethereum and ETH L2's. Especially spot Pro Orders is really interesting feature that I don't see anywhere else.
Solscan was total garbage previously but it seems better then Etherscan now. Like the kept adding feature and Etherscan did not change much. Look at Analytics and Portfolio tabs.
Raydium is another interesting DEX. Portfolio page has nice UI.
Focus on working products rather then design theory and posturing about ideal world setup.
If retail feels like they missed out on Bitcoin buying Solana seems like a likely path.
Cons
Pump fun was a lot of the network activity
Not seeing enough content on using Solana Apps
Does not have the same decentralization and other crypto principles built into the community that Ethereum has. While short term it's a pro long term if your not careful where your going you can end up where you don't want to be.
Not financial advice. DYOR.