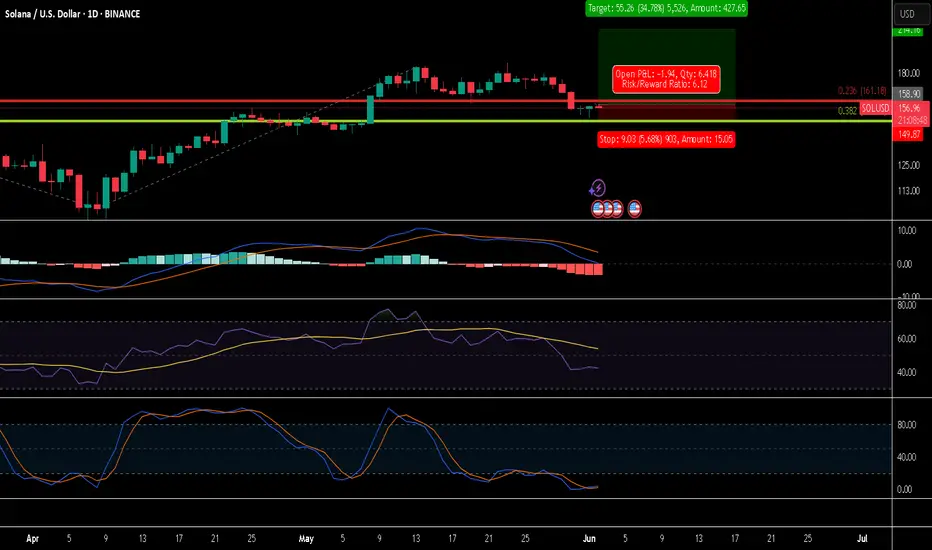
Will Solana continue to grow?I am definitely admittedly late to the party with Solana. Though I was very correct about the ride down to $8 and did not own any Solana for that. I was also wrong about The Return of Solana.
During the ride down from ~$300 to ~$100 I was able to get some Solana. Though most of it is liquid staked Solana now.
As seen in the image I think currently what makes the most sense is this being a pullback of the last rally in Solana.
I think focusing on daily Stoch RSI is more interesting currently then MACD and RSI. Looking to stay above 0.382 FIB above while also seeing Stoch RSI move up. If either of those fail then my current thinking must be reconsidered. As I am looking at typically weekly/daily spot moves the risks are different then people using leverage. Even if I use really small amounts of leverage to get 1.01, 1.10, etc. returns but not 10x leverage as an example.
Pros
Solana is seeing a lot of use
VC investors are likely try and push Solana to their peers, friends, etc.
Drift seems to have more feature as a DEX then most of what I have seen on Ethereum and ETH L2's. Especially spot Pro Orders is really interesting feature that I don't see anywhere else.
Solscan was total garbage previously but it seems better then Etherscan now. Like the kept adding feature and Etherscan did not change much. Look at Analytics and Portfolio tabs.
Raydium is another interesting DEX. Portfolio page has nice UI.
Focus on working products rather then design theory and posturing about ideal world setup.
If retail feels like they missed out on Bitcoin buying Solana seems like a likely path.
Cons
Pump fun was a lot of the network activity
Not seeing enough content on using Solana Apps
Does not have the same decentralization and other crypto principles built into the community that Ethereum has. While short term it's a pro long term if your not careful where your going you can end up where you don't want to be.
Not financial advice. DYOR.
Fibonacci
TSLA – Something Big Is Brewing🚀Tesla just keeps pushing. Now trading around $346, it's not just riding market momentum — it's building it. And with the robotaxi launch in Austin coming June 12, the narrative might be shifting from “just EVs” to mobility revolution.📍 Levels I’m Watching
Possible entries:
• $335–$325 – Looks like it’s consolidating here
• $315–$290 – Clean retest zone if we dip
• $265 – Would love a deeper pullback but not counting on it
Targets?
• $370 – Short-term test
• $395 – Momentum breakout zone
• $420+ – If the hype around robotaxis takes hold
⚠️ Disclaimer: This isn’t financial advice. Just sharing how I see things. Do your own research and trade safe.
💬 If this helped, drop a like and follow. I post trades that actually make sense not just moonshots.
Let’s grow smart. 📈🧠

BAJAJ ELECTRIC technical analysis Stock Overview: Bajaj Electricals Ltd. (BAJAJ ELECT.LTD) on the NSE exchange, current price: 686.70 INR. The company is a leading Indian manufacturer and marketer of electrical appliances, lighting, and fans, along with engineering and project services.
Key Levels:
Support Level: 488.70 INR
Swing Level: 589.05 INR
Possible Upside Levels: 1,227.30 INR 1,427.70 INR 1,683.00 INR
Technical Indicators:
- RSI (Relative Strength Index): The RSI is currently at 40.55, indicating neutral momentum. The stock is neither overbought nor oversold, suggesting a consolidation phase.
- Volume: Volume trends are crucial for assessing price movement strength. While the image does not explicitly show volume data, monitoring volume spikes can help confirm breakout or reversal signals.
Sector and Market Context:
Bajaj Electricals Ltd. operates within the consumer goods sector, focusing on electrical appliances and engineering services. The sector has shown resilience due to urbanization, rising disposable incomes, and government-led infrastructure initiatives. The broader market has been bullish, recovering strongly post-pandemic, driven by economic fundamentals and investor confidence. Bajaj Electricals Ltd. benefits from these trends due to its diversified product portfolio and strong brand presence.
Latest News and Developments:
- Market News: Bajaj Electricals Ltd. has announced a strategic partnership with a global firm to enhance product offerings and expand market reach.
- Analyst Ratings: Analysts have provided mixed ratings, with some recommending a hold due to market conditions, while others see long-term growth potential.
- Quarterly Results: The company reported strong revenue and net profit growth, attributed to robust consumer goods sales and successful engineering projects.
- Dividends: Bajaj Electricals Ltd. has declared a dividend payout of ₹3.00 per share (150%), reinforcing its commitment to shareholder value.
Analysis Summary:
Bajaj Electricals Ltd. exhibits solid sector performance, supported by favorable market trends and strategic initiatives. The identified key levels provide a framework for potential price movements. The RSI suggests neutral momentum, indicating a consolidation phase. Investors should consider the company’s strong quarterly results and strategic partnerships as positive indicators for future growth. However, market conditions and volume trends should be monitored for informed decision-making.

Hedera Stock Chart Fibonacci Analysis 060125
Trading Idea
1) Find a FIBO slingshot
2) Check FIBO 61.80% level
3) Entry Point > 0.167/61.80%
Chart time frame:B
A) 15 min(1W-3M)
B) 1 hr(3M-6M)
C) 4 hr(6M-1year)
D) 1 day(1-3years)
Stock progress:A
A) Keep rising over 61.80% resistance
B) 61.80% resistance
C) 61.80% support
D) Hit the bottom
E) Hit the top

Cardano Stock Chart Fibonacci Analysis 060125Trading Idea
1) Find a FIBO slingshot
2) Check FIBO 61.80% level
3) Entry Point > 0.67/61.80%
Chart time frame:B
A) 15 min(1W-3M)
B) 1 hr(3M-6M)
C) 4 hr(6M-1year)
D) 1 day(1-3years)
Stock progress:A
A) Keep rising over 61.80% resistance
B) 61.80% resistance
C) 61.80% support
D) Hit the bottom
E) Hit the top
Stocks rise as they rise from support and fall from resistance. Our goal is to find a low support point and enter. It can be referred to as buying at the pullback point. The pullback point can be found with a Fibonacci extension of 61.80%. This is a step to find entry level. 1) Find a triangle (Fibonacci Speed Fan Line) that connects the high (resistance) and low (support) points of the stock in progress, where it is continuously expressed as a Slingshot, 2) and create a Fibonacci extension level for the first rising wave from the start point of slingshot pattern.
When the current price goes over 61.80% level , that can be a good entry point, especially if the SMA 100 and 200 curves are gathered together at 61.80%, it is a very good entry point.
As a great help, tradingview provides these Fibonacci speed fan lines and extension levels with ease. So if you use the Fibonacci fan line, the extension level, and the SMA 100/200 curve well, you can find an entry point for the stock market. At least you have to enter at this low point to avoid trading failure, and if you are skilled at entering this low point, with fibonacci6180 technique, your reading skill to chart will be greatly improved.
If you want to do day trading, please set the time frame to 5 minutes or 15 minutes, and you will see many of the low point of rising stocks.
If want to prefer long term range trading, you can set the time frame to 1 hr or 1 day.

Doge Coin Stock Chart Fibonacci Analysis 060125Trading Idea
1) Find a FIBO slingshot
2) Check FIBO 61.80% level
3) Entry Point > 0.19/61.80%
Chart time frame:B
A) 15 min(1W-3M)
B) 1 hr(3M-6M)
C) 4 hr(6M-1year)
D) 1 day(1-3years)
Stock progress:A
A) Keep rising over 61.80% resistance
B) 61.80% resistance
C) 61.80% support
D) Hit the bottom
E) Hit the top
Stocks rise as they rise from support and fall from resistance. Our goal is to find a low support point and enter. It can be referred to as buying at the pullback point. The pullback point can be found with a Fibonacci extension of 61.80%. This is a step to find entry level. 1) Find a triangle (Fibonacci Speed Fan Line) that connects the high (resistance) and low (support) points of the stock in progress, where it is continuously expressed as a Slingshot, 2) and create a Fibonacci extension level for the first rising wave from the start point of slingshot pattern.
When the current price goes over 61.80% level , that can be a good entry point, especially if the SMA 100 and 200 curves are gathered together at 61.80%, it is a very good entry point.
As a great help, tradingview provides these Fibonacci speed fan lines and extension levels with ease. So if you use the Fibonacci fan line, the extension level, and the SMA 100/200 curve well, you can find an entry point for the stock market. At least you have to enter at this low point to avoid trading failure, and if you are skilled at entering this low point, with fibonacci6180 technique, your reading skill to chart will be greatly improved.
If you want to do day trading, please set the time frame to 5 minutes or 15 minutes, and you will see many of the low point of rising stocks.
If want to prefer long term range trading, you can set the time frame to 1 hr or 1 day.

Can Eth make a return? I think it can.Don't bother looking at BINANCE:ETHUSD if your not going to compare ETH to BTC also.
So as you can see we now need to break above 0.02623. ETH must make sense from a risk reward perspective compared to BTC. Up till now that's not really been the case.
ETH is the only asset other then Bitcoin many people have heard of. Many people are think how I know about Fart Coin $BINANCE:FARTCOINUSDT.P. It took many people 16 years to figure out Bitcoin and some still have not figured it out yet. If you live close to the sun it's hot. I mean you notice all the changes in the crypto industry. Most people aren't living in a place that they get crypto news. Though it's being added more and more to TV and Movies. Many movie/TV references make no sense. With ETH being 9 years old some people might have noticed now.
Though it's definitely unclear how far ETH/BTC could go back up and also ETH/USD to new highs. We could look at some current pros and cons.
Pros:
Ethereum allows users to trade, save, borrow, etc.. without needing a centralized platform. Though people will tell you Bitcoin can be trading peer to peer. Smart contracts definitely sounds better the meeting in a dark alley. I am being harsh but mostly because I wish Bitcoin did not have so much large holder and centralized party risks.
With the right setup you can basically live on ETH/EVM ecosystem.
Content creators cover usage better then anything I have seen from other Blockchains. Having 100 videos about a savings and lending platform token and no videos about how to use it is not a good sign.
Launch pads could see a massive growth now that there is less risk to starting a legitimate Crypto project. There seems to be less regulatory risk for how you get funding. With the focus shifting to did your product/company fail vs was it fraud. This has a huge impact to on chain funding to people desperately trying to build their ideas out.
Platforms like Infinex allow users use L2 ecosystem without needing to understand navigating it.
RWA the most logical place for RWA projects is on Ethereum. If you want to fractionalize a house Ethereum offers security for a large asset that other places just aren't there yet.
The first on chain stock could be "Coin" the Coinbase stock they have show interest in doing so previously. That would also be the first S&P 500 asset on chain. That would likely happen on Ethereum L2 Base.
Staking makes ETH an interesting cash flowing assets for investors.
Fee less transactions probably is not very far away. Where the application creator pays your 1 cent fee to use there app on an L2.
Cons
Ethereum is still not generating enough fees. Having fees mostly going to L2's has made it not deflationary.
Cross chain is still too clunky
Community is really great at having a niche vibe but need to be relatable to a large audience.
Messaging and direction can be very unclear.
Bitcoin focused on "never changing", Solana focused "fast and cheap", Ethereum is likely about being robust chain where transactions can't be stopped. Though there is a lot of voices and not a lot of coordination. There is a fine line between decentralized and wondering lost.
This is not financial advice. These are my personal opinions and observations. Do your own research before making any investment decisions.

PLTR eyes on $133.37: Golden Genesis fib that could mark a TOP PLTR with a ferocious recovery from tariff tantrums.
Bounce into All Time High has hit a Golden Genesis fib.
It is in tight confluence with a Golden Covid for strength.
$133.27 is the exact Golden Genesis fib.
$129.74 is a Golden Covid fib reinforcing.
$121.86 is the first strong support below.
Previous alert given at sister Golden Below:
=================================================
.

Ripple Stock Chart Fibonacci Analysis 060125Trading Idea
1) Find a FIBO slingshot
2) Check FIBO 61.80% level
3) Entry Point > 2.1/61.80%
Chart time frame:B
A) 15 min(1W-3M)
B) 1 hr(3M-6M)
C) 4 hr(6M-1year)
D) 1 day(1-3years)
Stock progress:A
A) Keep rising over 61.80% resistance
B) 61.80% resistance
C) 61.80% support
D) Hit the bottom
E) Hit the top
Stocks rise as they rise from support and fall from resistance. Our goal is to find a low support point and enter. It can be referred to as buying at the pullback point. The pullback point can be found with a Fibonacci extension of 61.80%. This is a step to find entry level. 1) Find a triangle (Fibonacci Speed Fan Line) that connects the high (resistance) and low (support) points of the stock in progress, where it is continuously expressed as a Slingshot, 2) and create a Fibonacci extension level for the first rising wave from the start point of slingshot pattern.
When the current price goes over 61.80% level , that can be a good entry point, especially if the SMA 100 and 200 curves are gathered together at 61.80%, it is a very good entry point.
As a great help, tradingview provides these Fibonacci speed fan lines and extension levels with ease. So if you use the Fibonacci fan line, the extension level, and the SMA 100/200 curve well, you can find an entry point for the stock market. At least you have to enter at this low point to avoid trading failure, and if you are skilled at entering this low point, with fibonacci6180 technique, your reading skill to chart will be greatly improved.
If you want to do day trading, please set the time frame to 5 minutes or 15 minutes, and you will see many of the low point of rising stocks.
If want to prefer long term range trading, you can set the time frame to 1 hr or 1 day.

HPE watch $15.13-15.25: Resistance zone could End bounce or RunHPE got a bump from news about Elliott buying.
Trapped under a key resistance at $151.3-15.15.
Look for rejection or Break-n-Retest to continue.

Solana Stock Chart Fibonacci Analysis 060125Trading Idea
1) Find a FIBO slingshot
2) Check FIBO 61.80% level
3) Entry Point > 153/61.80%
Chart time frame:B
A) 15 min(1W-3M)
B) 1 hr(3M-6M)
C) 4 hr(6M-1year)
D) 1 day(1-3years)
Stock progress:A
A) Keep rising over 61.80% resistance
B) 61.80% resistance
C) 61.80% support
D) Hit the bottom
E) Hit the top
Stocks rise as they rise from support and fall from resistance. Our goal is to find a low support point and enter. It can be referred to as buying at the pullback point. The pullback point can be found with a Fibonacci extension of 61.80%. This is a step to find entry level. 1) Find a triangle (Fibonacci Speed Fan Line) that connects the high (resistance) and low (support) points of the stock in progress, where it is continuously expressed as a Slingshot, 2) and create a Fibonacci extension level for the first rising wave from the start point of slingshot pattern.
When the current price goes over 61.80% level , that can be a good entry point, especially if the SMA 100 and 200 curves are gathered together at 61.80%, it is a very good entry point.
As a great help, tradingview provides these Fibonacci speed fan lines and extension levels with ease. So if you use the Fibonacci fan line, the extension level, and the SMA 100/200 curve well, you can find an entry point for the stock market. At least you have to enter at this low point to avoid trading failure, and if you are skilled at entering this low point, with fibonacci6180 technique, your reading skill to chart will be greatly improved.
If you want to do day trading, please set the time frame to 5 minutes or 15 minutes, and you will see many of the low point of rising stocks.
If want to prefer long term range trading, you can set the time frame to 1 hr or 1 day.

WDC eyes on $36.84 then 39.xx: look for Break and PopWDC trying to recover tariff dump with market.
Currently testing a recently proven fib at $36.84
Look for Break and pop to resistance at $39.00/39
Or we might get a dip to support below $34.17/81

$UNI - $10 from here?Hi guys! 👋🏻
🔔I'll be trying this setup for Uniswap
🔔 We have bounced from the strong support at $4.80, which we retested in April 25 and May 7 forming a pattern impersonating a double bottom
🔔 With the current chart pattern and levels, I'll be expecting a jump with a target on $10.
🔔 Might drop to $5.70 before another move upwards.
✊🏻 Good luck with your trades! ✊🏻
If you like the idea hit the 👍🏻 button, follow me for more ideas.

JOBY eyes on $7.70: Golden Genesis Fib will determine trendJOBY coming back strong with a pre-market pump.
It has spiked into a Golden Genesis Fib at $7.70.
Look for a Dip-to-Fib or Break-n-Retest for buys.

BTCUSD BUY IDEA-EASY CONFLUENCE PLAY??After reaching an all-time high (ATH) last week, Bitcoin is currently positioned at a pivotal $105,484 at the .23 level according to the Fibonacci trend. It has retraced to previous highs around $105,000 to $106,000. Recently, it bounced off the support level of approximately $102,740 on the 4-hour and daily charts and seems to be forming higher lows. I believe we could see a confluence play that aligns with the previous price action that led to the ATH.

TEM eyes on $58: Double Golden fibs and obviously STRONG zone TEM has fallen to a Double Golden fib zone.
$58.10 is a Golden ratio of Top down wave.
$58.38 is a Golden Genesis fib (bottom up).
Key level here and a Do-or-Die for bulls.
=====================================
Previous Analysis that caught a bottom nicely
========================================
.

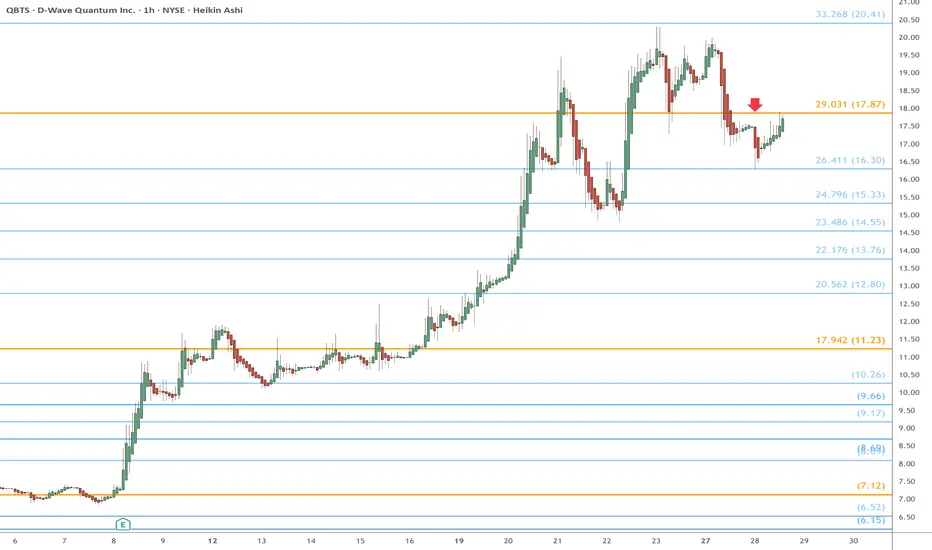
QBTS eyes on $17.86: Golden Genesis fib a "lower high" of top?QBTS and all quantums have been on the rampage.
This one is currently testing a Golden Genesis fib.
Rejection here could mark a "lower high" of the top.
Break-and-Retest would start the next leg of uptrend.
.
Previous Analysis that caught the Break Out:
=================================================
.
Bitcoin Stock Chart Fibonacci Analysis 060125Trading Idea
1) Find a FIBO slingshot
2) Check FIBO 61.80% level
3) Entry Point > 105,270/61.80%
Chart time frame:B
A) 15 min(1W-3M)
B) 1 hr(3M-6M)
C) 4 hr(6M-1year)
D) 1 day(1-3years)
Stock progress:A
A) Keep rising over 61.80% resistance
B) 61.80% resistance
C) 61.80% support
D) Hit the bottom
E) Hit the top
Stocks rise as they rise from support and fall from resistance. Our goal is to find a low support point and enter. It can be referred to as buying at the pullback point. The pullback point can be found with a Fibonacci extension of 61.80%. This is a step to find entry level. 1) Find a triangle (Fibonacci Speed Fan Line) that connects the high (resistance) and low (support) points of the stock in progress, where it is continuously expressed as a Slingshot, 2) and create a Fibonacci extension level for the first rising wave from the start point of slingshot pattern.
When the current price goes over 61.80% level , that can be a good entry point, especially if the SMA 100 and 200 curves are gathered together at 61.80%, it is a very good entry point.
As a great help, tradingview provides these Fibonacci speed fan lines and extension levels with ease. So if you use the Fibonacci fan line, the extension level, and the SMA 100/200 curve well, you can find an entry point for the stock market. At least you have to enter at this low point to avoid trading failure, and if you are skilled at entering this low point, with fibonacci6180 technique, your reading skill to chart will be greatly improved.
If you want to do day trading, please set the time frame to 5 minutes or 15 minutes, and you will see many of the low point of rising stocks.
If want to prefer long term range trading, you can set the time frame to 1 hr or 1 day.

XAU/USD LONG XAU/USD LONG " taped into 4h support area and break and retest major 1h support
with 50% fib retracement

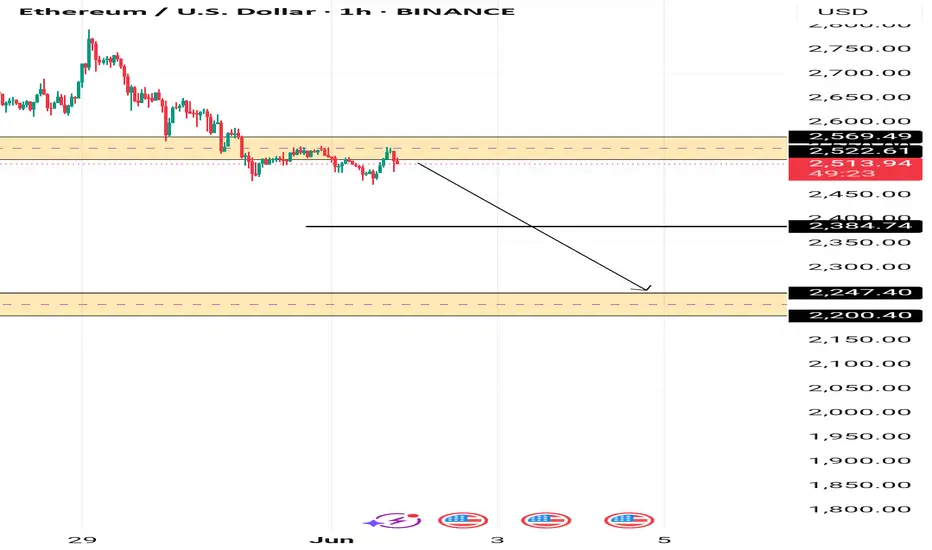
ETHERUEM PIVOT AREAETHEREUM is currently under our pivot area between 2522.21 and 2569.69. with bears in control for the moment.
If the price fails to break above this area we could see 2384 and 2247 as next targets
MKR 1W🔍1. Overall Trend:
In the long term, we can see that MKR was in a downtrend, as evidenced by the falling trendline (orange dashed line).
The last candles show that the price has broken this downtrend line - this could indicate a potential trend reversal or at least an attempted upside correction.
📊Support and resistance levels (horizontal chart):
Strong support (red) and resistance (green) levels are marked:
✅ Resistances:
~3,770 USDT – local top, very strong resistance.
~3,079 USDT – previous support, now acting as resistance.
~2,002 USDT – current growth barrier, price is currently struggling with this level.
🔻 Supports:
~1,574 USDT – current local support.
~1,248 USDT – next support, previously tested.
~800 USDT and ~400 USDT – historical accumulation zones, deep support levels.
Oscillators (bottom of the chart):
Stochastic RSI – currently in the upper zone, which may suggest that the market is approaching overbought. Possible correction.
RSI (classic) – oscillates around 50, i.e. neutral, but with a slight upward slope. There is no overbought signal yet.
🧠 Conclusions:
➕ Bullish signals (pro-growth):
Break of the downtrend line (may be the first signal of a trend change).
Formation of a higher low.
Oscillators are not yet in the extreme zone.
➖ Bearish signals (pro-fall):
The price has not yet managed to break the resistance at 2,002 USDT.
Stochastic RSI indicator close to the overbought zone - possible short correction.
📌 Scenarios:
1. Upside scenario:
If the price breaks through the 2,002 USDT level and stays above it, the next target will be the 3,079 USDT level.
Confirmation will be the rising RSI and staying above the trend line.
2. Downside scenario:
If the price fails to break through the 2,002 USDT level and falls below the 1,574 USDT level, a possible test of the 1,248 USDT level or even lower (800 USDT).

Amaraja batteries Here is the text from the image:
This stock is showing signs of a potential reversal on the weekly timeframe, based on Fibonacci retracement levels, and 200 ema may move upwards.

Strategy & Education: Trading with Fibonacci and Order Blocks🔍 Trading Strategy Based on Fibonacci Levels and Order Blocks
This chart showcases three consecutive sell trades I executed on the BTCUSDT pair, each resulting in a profitable outcome. The purpose of this explanation is to demonstrate how Fibonacci retracement levels can be combined with Order Block zones to identify high-probability trade setups.
🧩 The Foundation: Understanding Price Retracement Behavior
The ABC, abc, and (a)(b)(c) structures marked on the chart are not Elliott Waves. Instead, these labels are used to represent simple retracement movements in the market. The focus here is not wave theory, but recognizing how price reacts and pulls back after a move, and how we can benefit from these reactions.
📌 Trade 1: Primary Fibo-OB Confluence
I drew a Fibonacci retracement from the A wave to the B wave.
The price then retraced to the C area, landing between the 0.618 and 0.786 Fibonacci levels, where an Order Block (OB) was also present.
This overlap created a strong technical and structural resistance zone.
I entered the first sell trade from this confluence.
📌 Trade 2: Internal Retracement and OB Alignment
Inside the first corrective move, a smaller abc pattern formed.
I applied Fibonacci again from small a to small b.
The c leg reached the same key Fibonacci zone (0.618–0.786) and overlapped with a second OB.
This confluence offered a second sell entry.
📌 Trade 3: Micro Structure – Same Logic Reapplied
I repeated the exact same logic one more time on a micro (a)(b)(c) structure.
Fibonacci from (a) to (b), price touched 0.618–0.786, coinciding again with an OB.
This became the third and final sell position.
🧠 The Logic Behind the Strategy:
Price doesn’t move in straight lines—it flows in waves. During pullbacks, if Fibonacci levels align with Order Block zones, the market tends to react strongly. My focus here was to identify these areas of confluence in advance and enter trades at high-probability turning points.
