1. "What do you think — is DXY ready to fly or fall?"DXY 4H Analysis – Decision Time for the Dollar?
After completing a falling wedge with a clean 5-wave Elliott structure, the U.S. Dollar Index is approaching a key demand zone.
Will buyers step in to push price toward the bullish target near 106 📈?
Or will we see another rejection from the supply zone and a deeper drop to 94? 📉
Wave A or Wave B?
Market structure shows signs of reversal, but confirmation is still pending a break of resistance or further rejection.
👉 What do you think — bounce or breakdown?
Comment your view below ⬇️
Let’s see who’s riding the next big wave 🌊
#DXY #USD #ElliottWave #SupplyAndDemand #GreenFireForex #ForexAnalysis #WaveTheory
Fibonacci

Link Analysis (12H)Chainlink (LINK) Technical Outlook – Elliott Wave Perspective
After applying Elliott Wave Theory, the chart appears to speak for itself — the downward corrective phase seems to have concluded.
Zooming into lower timeframes, there are several bullish signs suggesting that LINK is primed for an upward move.
Key Technical Reasons Supporting Upside Potential:
Bullish Flag Formation: A clear flag pattern has formed in lower time frames, and LINK is currently testing its resistance level.
Elliott Wave Count: Based on wave structure, Wave 3 appears to be nearing completion. Should we see a short-term pullback, it would likely be Wave 4, offering a strong buy opportunity around the support zone of the flag.
Fib Confluence: The potential retracement aligns perfectly with the 50% Fibonacci level — a typical target area for Wave 4 corrections.
Two Possible Scenarios:
Immediate Breakout: With support from Bitcoin’s continued momentum, LINK could extend its current Wave 3 and break out from the flag without any significant pullback.
Healthy Correction: Alternatively, LINK could retrace to the 50% Fib level before initiating the final leg of Wave 5 — providing a textbook buying opportunity.
Target:
In both scenarios, the upside target remains the same: $18.00 to $18.40 range.
— Thanks for reading.

XAUUSD- JUNE 2, 2025 ONWARDS(FIBO + TRENDLINEI'm not sure if this will happen, but chances are. Gold this past days respects trendline and fibo levels. Let's just wait and see.

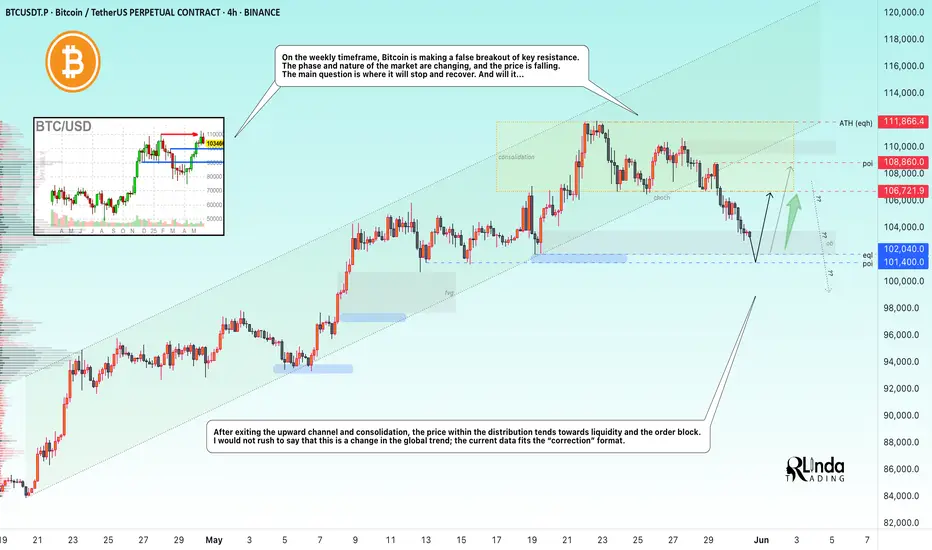
BITCOIN → Correction or trend reversal? Why is 101K important?BINANCE:BTCUSDT.P is exiting the upward channel after a false breakout of the key resistance level of 110K (previous ATH). Liquidation?
Quite an interesting situation with James Wynn. As they say, money loves silence, especially when it comes to a highly manipulated market... A week after the whale's actions, Trump decided to play the market again by creating emotional swings: he announced tariffs on the EU, canceled them, then made claims against China and is now ready to reintroduce tariffs on the EU. Things didn't end well with James... Liquidation before the rally?
On the weekly timeframe, Bitcoin is making a false breakout of the key resistance level of 110K. The phase and nature of the market are changing, the price is falling, breaking the structural support of 106500. The main question is where the stop and recovery will be. And will there be one...
After exiting consolidation and the upward channel, the price within the distribution is moving towards liquidity and the order block. I would not rush to say that this is a change in the global trend; the current data fits the “correction” format.
Support levels: 102000, 101400
Resistance levels: 106700, 108800
102-100K is a fairly important zone for the market; a breakout in this area could open the way to a (local) bottom. Bulls may not be able to hold the market, in which case a global sell-off could form. Therefore, I believe that retesting the 102000 level will end with a liquidity grab and a correction along the trend, during which the price may test the 106K - 108K level, which will determine the future of the market: consolidation, growth, or decline...
Best regards, R. Linda!
WiproThis stock is showing signs of a potential reversal on the weekly timeframe, based on Fibonacci retracement levels and 200( ema+ dma) dynamic support may move upwards.

BITCOIN READY TO EXPLODE – OR REJECT? Key Levels You Can’t Ignoby @TradeWithMky – where altcoins speak louder than Bitcoin!
📊 Weekly BTC/USDT Outlook – The chart says it all:
We just tapped ATH resistance and printed a red candle at a critical level.
Is this a bullish retest or a dead-cat bounce before major correction?
🟢 Key Buy Levels:
First Entry: $104,510 ✅
Second Entry: $103,702
Third Entry: $98,385
Fourth Entry: $93,529 & $89,137
🛑 Stop Loss: $78,516
🔍 Support Zone: Still strong.
📈 Fibo Targets:
0.618 → $112,180
1.0 → $135,441
1.618 → $172,928 (next blow-off top?)
💥 Expect major volatility in the coming weeks.
If this setup plays out, we might witness a legendary breakout. Stay sharp!
—
🔁 Like & Repost if you caught this move early!
💬 Drop your thoughts below – bull trap or launchpad?
#Bitcoin #BTCUSDT #CryptoAnalysis #Altseason #TradeWithMky #PricePrediction #CryptoBreakout #TechnicalAnalysis #FibLevels

EURUSD 4H ELLIOTT WAVE COUNT – DOWNSIDE TARGET CONFIRMED!Good Morning, Traders,
I’m sharing my wave analysis for EURUSD with you. After completing its first five waves, it formed the A-B wave and is now expected to move into the C wave.
The target level for the C wave is currently 1.11838.
I meticulously prepare these analyses for you, and I sincerely appreciate your support through likes. Every like from you is my biggest motivation to continue sharing my analyses.
I’m truly grateful for each of you—love to all my followers

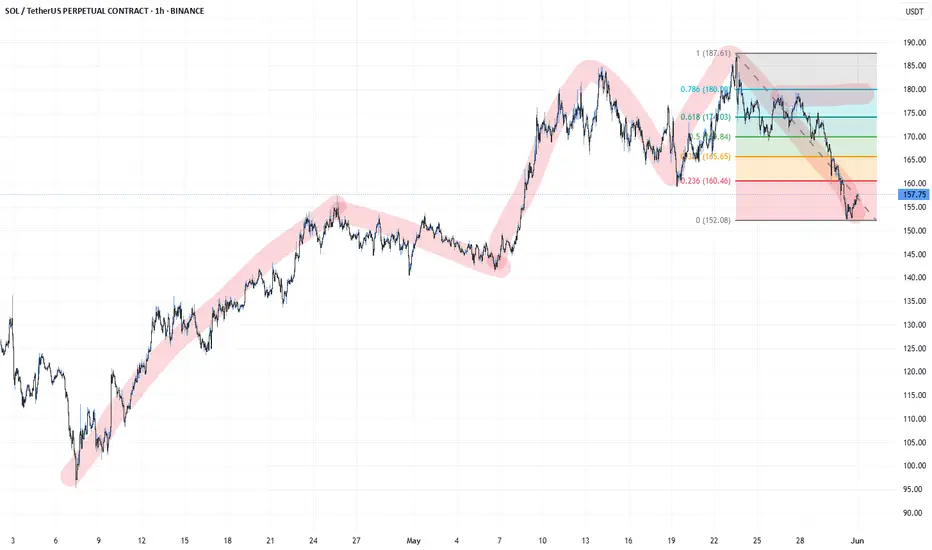
SOL - BOS ExpectationThe rising structure of the market signals deterioration. We will try to catch a short transaction both above fibo 50 and in the region corresponding to the liquidity zone.
SPX500 (S&P 500 Index) – Smart Money + Fibonacci Liquidity Sweep📅 Chart Timestamp: May 31, 2025 – 4H Timeframe
📈 Current Price: 5,902.26
📊 Volume (Recent Candle): 64.95K
🧠 Technical Breakdown
🔺 Premium Zone Rejection
Price has sharply rejected the 5,995–6,050 area — a key premium supply zone aligned with the Fibonacci 1.0–1.236 extension.
This rejection occurred after a weak internal high was formed, showing signs of exhaustion and liquidity grab behavior.
📉 Market Structure
Multiple Break of Structure (BOS) and Change of Character (CHoCH) confirm a short-term bearish market structure.
Price has begun forming lower highs and is now in a distribution phase.
📏 Key Fibonacci & Smart Money Levels
0.786 Fib Retracement (5,804) → Recently tested; acted as a short-term support but broken.
Equilibrium Zone (5,443.75) → Critical price magnet. Price is projected to gravitate toward this zone as part of a liquidity sweep and reaccumulation.
Discount Zone (below 5,300) → Stronger support if equilibrium fails. Could serve as a long-term buying opportunity.
🌀 Expected Price Path (Yellow Projection)
Short-term downside continuation into 5,560–5,440.
Likely to form a double-bottom or mitigation structure at equilibrium.
Reversal potential targeting 6,200–6,300 (1.236–1.382 extension) before next macro correction.
📈 Probability Framework
Scenario Description Probability Rationale
📉 Pullback to Equilibrium Price revisits 5,443.75 75% Confluence of Smart Money FVGs + Fib levels + BOS indicates liquidity resting below
🔁 Reaccumulation at EQ Reversal from 5,440–5,500 65% Price often reacts to equilibrium in a bullish uptrend continuation
📈 Rally to 6,200+ Price takes out weak highs and extends 50% Depends on macro sentiment improving + liquidity expansion
🧨 Break below EQ into Discount Price collapses toward 5,300 30% Only if macro deterioration accelerates (Fed surprise, global contagion)
🧠 Macro Risk & Fundamental Context (as of May 31, 2025)
🏦 Federal Reserve
Market is pricing in no rate cut in June, but increased odds (65–70%) of a cut in July.
Sticky inflation + slowing job growth creates an uncertain macro narrative.
💵 Liquidity & Risk Sentiment
Bond market volatility (MOVE Index) remains elevated → signaling stress in interest rate pricing.
VIX is stable near 12–14 range → complacency risk if volatility spikes.
Global liquidity has tightened in EMs due to dollar strength, though US equities remain buoyed by AI & tech.
📉 Earnings + Breadth
Earnings season was mixed; top-heavy performance (few stocks driving index).
Weak market breadth suggests a correction is healthy or overdue.
⚠️ Risk Factors to Monitor
Surprise Fed policy pivot (hawkish).
Geopolitical escalations (Middle East, Taiwan).
Sudden rise in VIX or credit spreads.
Bearish divergence between index and market breadth indicators.

Kaspa - game over?Weekly TF
Chart inverted
Looking at this chart - what would you do here? Kaspa has been unable to exceed the $0.19 - 0.20 high. And has broken below 2 x key trend lines.
I seem to be missing some historical data on this chart but if we use the lowest price point and use a fibbonahi retracement tool, the 0.5 puts is roughly $0.010 - 0.012. Equal to a 80-90% drop.
If KAS sees continuation to the downside I believe this is where price could head next 📉
This coin had a good run for c.700 days, followed by 200 days of flat p.a. /consolidation - it makes sense that there would be a significant correction.

SagilityThis stock is showing signs of a potential reversal on the weekly timeframe, based on Fibonacci retracement levels, and may move upwards.

BTC/USD 4h Char ReviewHello everyone, I invite you to review the current situation on BTC taking into account the 4-hour interval. We can see how the price is maintained just below the upward trend line, while a downward trend channel may be forming locally.
Here you can see how the price decline is maintained in a strong support zone from $ 105,000 to $ 103,150, however, if the support zone is broken, the price may quickly fall to the support area at $ 100,700
Looking the other way, you can see that when the trend reverses, we first have resistance at $ 106,560, the next is at $ 108,590, and then you can see very strong resistance at the level of the last ATH in the area of $ 112,000.
On the MACD indicator and the RSI indicator, you can see how we are maintaining in the lower part of the range, which indicates that the price bounce is still taking place to continue the growth.

SPY (S&P 500 ETF) – Fibonacci Reversal + Bullish Continuation SeThis chart highlights a potential retracement zone before a major continuation leg to the upside, based on Fibonacci levels and price structure.
📊 Technical Breakdown
Current Price: $589.39
Recent High: $595.54 (Fibonacci 1.0)
Key Fibonacci Levels:
0.618 → $562.28 (First retracement target)
0.5 → $555.57
0.382 → $547.38
Critical Support: $552.15 (confluence with historical demand & fib zone)
Projected Target (1.382 Fib Extension): $629.02
🧠 Probabilistic Interpretation
🔻 Short-term pullback toward $552.15 = 60% probability based on multiple rejections from 0.886/1.0 Fib zones.
🔼 Continuation to $629.02 = 70% probability if price finds support at golden ratio (0.618) or 0.5 zone.
🧠 Structure favors smart money re-accumulation after engineered liquidity grab.
🌐 Macro Context (as of May 31, 2025)
Fed Watch: Market pricing in 70% chance of no rate cut in June. July data will be crucial.
VIX: Suppressed, but starting to rise—indicative of market hedging short-term volatility.
Earnings season: Mixed signals—AI sector outperforms while cyclicals lag.
🚨 Trade Plan for Professionals
Watch for price action near $555–552.
Enter long upon bullish engulfing or SMC confirmation at demand zone.
First TP: $595.50
Final TP: $628.80–$629.02
SL: Below $541.72 (Fib 0.382)
🧠 Final Note
This chart reflects a classic Fibonacci retracement & extension structure that institutional traders often monitor. Aligns with DSS and WaverVanir’s discretionary outlook.
#SPY #SMP500 #FibLevels #SmartMoney #LiquiditySweep #WaverVanir #TechnicalAnalysis #FibonacciTrading #TradingView

BTC Correction - 50%After completing the impulse and falling out of the channel, Bitcoin most likely went into a correction

BTCUSD UPDATE 31- 5 - 25This chart shows a technical analysis of the BTC/USDT (Bitcoin/US Dollar Tether) pair on the 4-hour timeframe using Binance data. Here's a detailed breakdown of the key elements:
Current Price:
BTC is trading at $103,439.50, down 0.53% on the 4-hour chart.
Highlighted Zones (Yellow Boxes):
These are likely support and resistance zones:
1. Resistance zone near $112,000 – This is the recent high and potential sell zone.
2. Support zone around $101,000–102,000 – This could act as the first level of buying interest.
3. Stronger support zone between $97,000–99,000 – Key demand area if the price drops further.
4. Mid-range zone around $104,000–105,000 – Previous consolidation area which could act as a minor resistance/support flip.
Blue Zigzag Line:
This illustrates a potential head and shoulders pattern, followed by a projected price movement:
A possible bounce from the $101,000 area back toward $105,000.
If that fails, a bearish continuation toward the lower support zone near $97,000.
Implications:
Short-term Bearish Bias: The overall pattern suggests potential further downside unless BTC holds the current support area.
Reversal Potential: A successful bounce at current levels could lead to a relief rally.
Key Levels to Watch:
Break below ~$101,000 could open the way to ~$97,000.
Break above ~$105,000–106,000 may indicate a shift back to bullish momentum.
Would you like a deeper technical analysis or recommendations based on this setup (e.g., risk/reward, entry/exit ideas)?

Pullback time?As it seems, the pullback might be here. I'm looking at one interesting level, if the price doesn't drop to that level, it's super bullish. GAP and Ma 200 area 300-310 ish

GOLD📌 Current Bias:
Short-term Bias: Bearish retracement in progress.
Medium-term Bias: Still bullish, unless price breaks below the 0.5–0.618 zone and forms a CHoCH with continuation.
✅ Trading Opportunities:
1. Bullish Continuation
-Entry: Between 3,260–3,270 (demand + 0.382 zone)
-Confirmation: I-CHoCH or bullish BOS on lower timeframes (e.g., 1H)
-Target: 3,338–3,350 (supply), then HH zone
2. Bearish Rejection
-Entry: If price retests 3,338–3,340 and forms a bearish CHoCH again
-Target: 3,250 (imbalance) and 3,200 (0.618 Fib)

BTC Outlook📌 Current Bias:
Short-term: Bearish, as we are in a downtrend with recent BOS and CHoCH to the downside.
Potential Reversal Area: Around the 0.786 Fib retracement and lower demand zone, especially if price forms bullish structure (like an I-CHoCH or BoS to the upside).
✅ Trading Opportunities:
1. Conservative Long Setup:
-Wait for a bullish CHoCH or I-BoS within the demand zone.
-Target the 0.5 or 0.382 Fibonacci retracement or imbalance zones above.
2. Continuation Short Setup:
-Look for rejection from 0.5 or 0.618 levels with bearish CHoCH.
-Enter short targeting the previous low around 103,000.

Draw on liquidity on altsSimple analysis really, we measure previous range and identify areas below premium that will attract price

Link Update (4H) Correction Has StartedIn my previous analysis, I presented two different perspectives on LINK.
On lower timeframes, LINK completed its 5-wave impulsive structure, but in doing so, it invalidated the macro reversed Head and Shoulders pattern—rendering it no longer valid.
Currently, LINK has entered a classic A-B-C corrective phase, signaling temporary market weakness. If the price drops below the key S&R zone (highlighted in pink), I expect a swift move down towards the $13.45 level.
This target coincides with a well-defined demand zone, adding further confluence to the short thesis.
📉 Outlook: Favorable for short positions upon confirmation of breakdown.
— Thanks for reading.

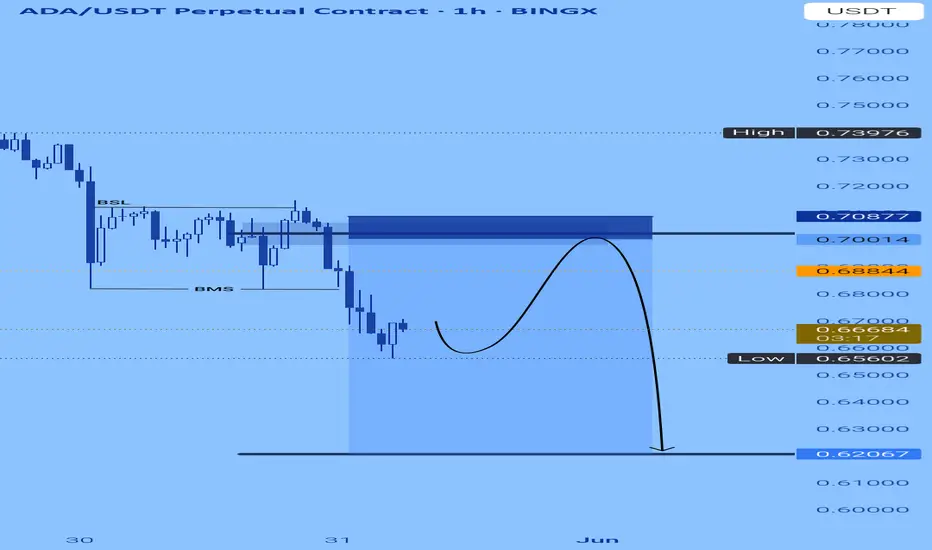
Ada might just be forward to short Intermediate BSL taken and price structure broken further to the down; Ada might be better looking to fill the FVg after the displacement to the downside for a bearish continuation.
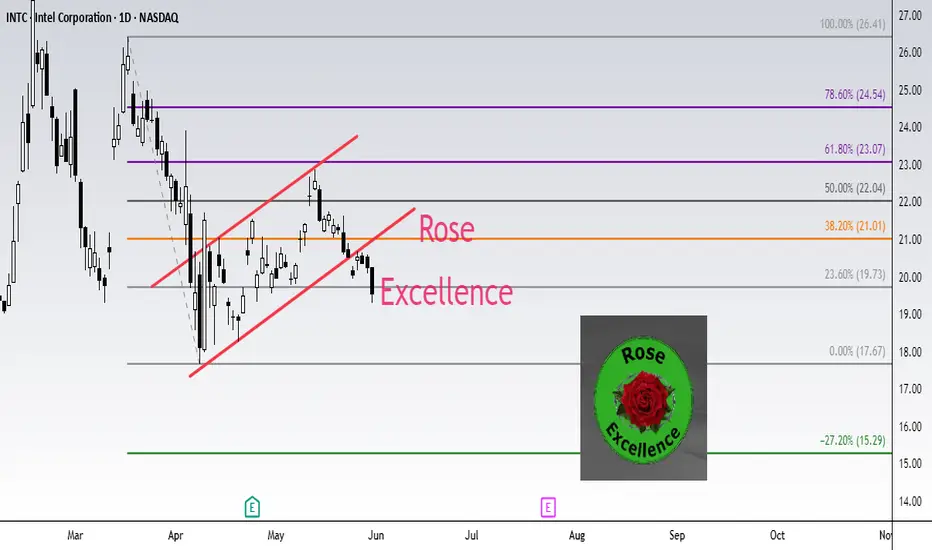
INTEL INTC Short setup target 15.29Fibonacci technical analysis : Intel Corporation NASDAQ:INTC has already found resistance at the Fib level 61.8% (23.07) of my Down Fib. The May 30th Daily candle has closed below retracement Fib level 23.6% (19.73), confirming a sell signal. A Bear Flag pattern has also formed. My Down Fib guides me to look for NASDAQ:INTC to eventually go down to hit first target at Fib level -27.2% (15.29).
NASDAQ:INTC – Target 1 at -27.2% (15.29), Target 2 at -61.8% (12.26) and Target 3 at -78.6 (10.79)
Stop loss slightly above the 50.0% retracement Fib level (22.04).
Enjoy the trading process and take time to smell the roses🌹
S&P 500 Futures Stock Chart Fibonacci Analysis 053025Trading Idea
1) Find a FIBO slingshot
2) Check FIBO 61.80% level
3) Entry Point > 5929/61.80%
Chart time frame:A
A) 15 min(1W-3M)
B) 1 hr(3M-6M)
C) 4 hr(6M-1year)
D) 1 day(1-3years)
Stock progress: B
A) Keep rising over 61.80% resistance
B) 61.80% resistance
C) 61.80% support
D) Hit the bottom
E) Hit the top
Stocks rise as they rise from support and fall from resistance. Our goal is to find a low support point and enter. It can be referred to as buying at the pullback point. The pullback point can be found with a Fibonacci extension of 61.80%. This is a step to find entry level. 1) Find a triangle (Fibonacci Speed Fan Line) that connects the high (resistance) and low (support) points of the stock in progress, where it is continuously expressed as a Slingshot, 2) and create a Fibonacci extension level for the first rising wave from the start point of slingshot pattern.
When the current price goes over 61.80% level , that can be a good entry point, especially if the SMA 100 and 200 curves are gathered together at 61.80%, it is a very good entry point.
As a great help, tradingview provides these Fibonacci speed fan lines and extension levels with ease. So if you use the Fibonacci fan line, the extension level, and the SMA 100/200 curve well, you can find an entry point for the stock market. At least you have to enter at this low point to avoid trading failure, and if you are skilled at entering this low point, with fibonacci6180 technique, your reading skill to chart will be greatly improved.
If you want to do day trading, please set the time frame to 5 minutes or 15 minutes, and you will see many of the low point of rising stocks.
If want to prefer long term range trading, you can set the time frame to 1 hr or 1 day.
