Sol searching, for an entry. If you find this information inspiring/helpful, please consider a boost and follow! Any questions or comments, please leave a comment!
The Elliottician’s Paradox: 12-12 or Zigzag? Bias Is the Key
Ever stare at a chart and ask, “Is that a 12-12 or a classic zigzag?” Yeah… welcome to the paradox we Elliotticians live in. Pattern recognition’s a blessing and a curse because context is everything, but confidence can get you wrecked.
This one’s got me on the edge.
What’s Happening Here
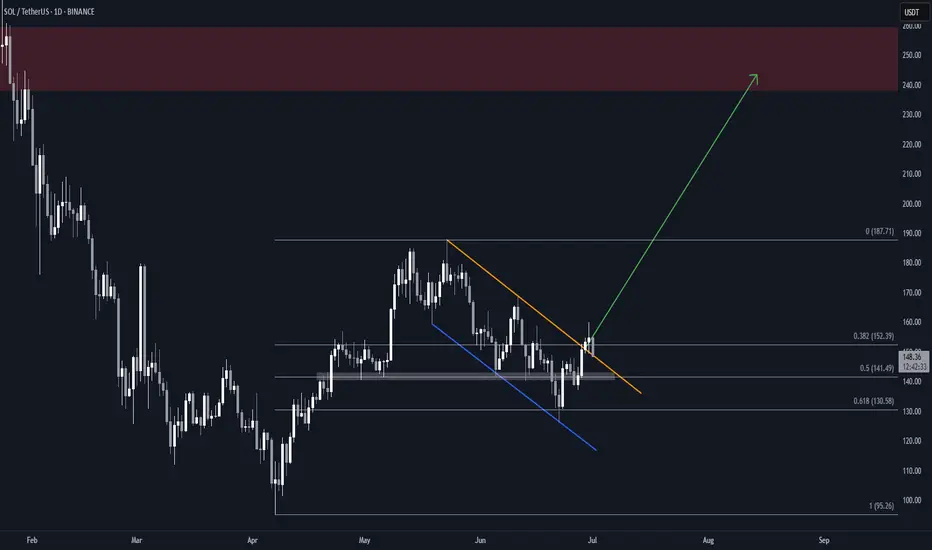
We’re currently watching a move that could be either:
- A corrective zigzag (5-3-5), or
- A 1-2, 1-2 setup, gearing up for a blastoff
That’s the core dilemma — two valid options, both technically legal. So what tips the scales? Bias.
The Line in the Sand: 152
Here’s what I’m watching for:
Key Level: 152
- That’s the bull/bear line for me.
- A strong impulsive reclaim above 152 flips the script. I’d reconsider the bearish view if price surges with intent.
- But if we return to 152 in a sluggish, corrective way? I’ll be eyeing continuation lower, aligned with a more traditional zigzag structure.
Elliott View
This is where the paradox plays out:
If we’re looking at a 1-2, 1-2 setup, expect:
- A powerful Wave 3 soon (should not be shy)
If it’s a Zigzag ABC:
- Then we should expect a corrective internal retracement and continuation to the down side, at minimum past the origin of the initial move.
The chart will speak loudest. But structure and strength of this next leg will confirm the story.
Final Thoughts
Trading isn’t about being right. It’s about managing scenarios — and this one’s a classic fork-in-the-road moment. I’ve got a plan for both directions.
152 is my trigger. Stay below it and fade the rally. Break above it impulsively, and I’ll flip my bias with it.
The Elliottician’s paradox isn’t a trap — it’s an invitation to stay sharp.
Your Turn
How are you reading this structure? Do you favor the zigzag or the 1-2 setup? Drop a comment and let me know.
Trade safe, trade clarity!
Fibonacci


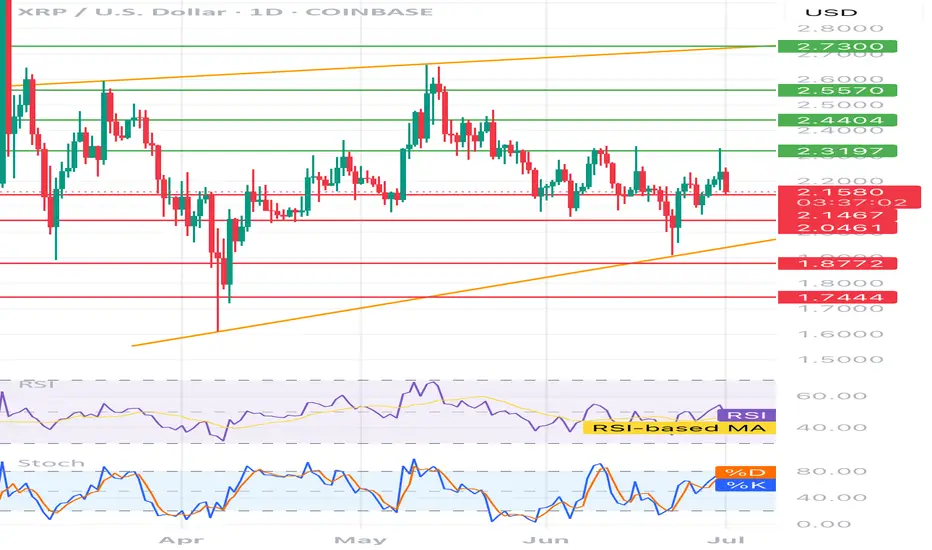
XRP/USD – Technical Analysis (1D)📊 XRP/USD – Technical Analysis (1D)
Current Price:
• Buy: 2.1554 USD
• Sell: 2.1553 USD
⸻
🧭 Trend & Structure
• Price is moving within a rising channel (orange lines).
• It’s currently trading closer to the lower trendline, suggesting potential support.
Resistance Levels (green lines):
• 2.3197
• 2.4404
• 2.5570
• 2.7300 (channel top)
Support Levels (red lines):
• 2.1467
• 2.0461
• 1.8772
• 1.7444 (key support)
⸻
📈 Indicators
RSI (Relative Strength Index)
• Hovering around the 50 level → neutral momentum.
• No strong divergence observed – RSI is moving with price.
Stochastic Oscillator
• %K has crossed %D upward → short-term bullish signal.
• Nearing the overbought zone (above 80) → a pullback could occur soon.
⸻
📌 Interpretation
• Price is testing the 2.15–2.16 zone, which has acted as both support and resistance in the past.
• A break above 2.32 could open the door toward 2.44 and 2.55 USD.
• A drop below 2.04 USD could lead to retesting 1.87 or even 1.74 USD.
• Overall trend: neutral to bullish, supported by the rising channel.
🎯 Trading Ideas
• Long Entry: Break and close above 2.32 USD with volume → targets: 2.44 / 2.55
• Short Entry: Breakdown below 2.04 USD → targets: 1.87 / 1.74
Algorand ALGO price analysis#Algo price is being held back from a deep dive, as far as it is appropriate to say that about altcoins right now.
The price decline on reduced volumes is similar to the previous two times on the OKX:ALGOUSDT chart.
🙂 A risky purchase from $0.15, if they hold the price there, it will be very cool.
📈 And if not, then “buckets” for buying in the $0.10-0.11 range, if you believe in the prospects of the #Algorand project
👊 And keep your fingers crossed, because there is a hypothetical chance that the price of #ALGO will rise to the $1.35-1.41 range by the end of this year, but everyone will have to be very lucky)
____________________
Did you like our analysis? Leave a comment, like, and follow to get more

The Big Beautiful RXTWith the bill passing and TA indicators popping up. I see these long term channels starting to break and the entire price action start to flip to the other side.
Watch the break and retest, especially if we see a spike in volume soon.
Really hard to lose long term with this one.

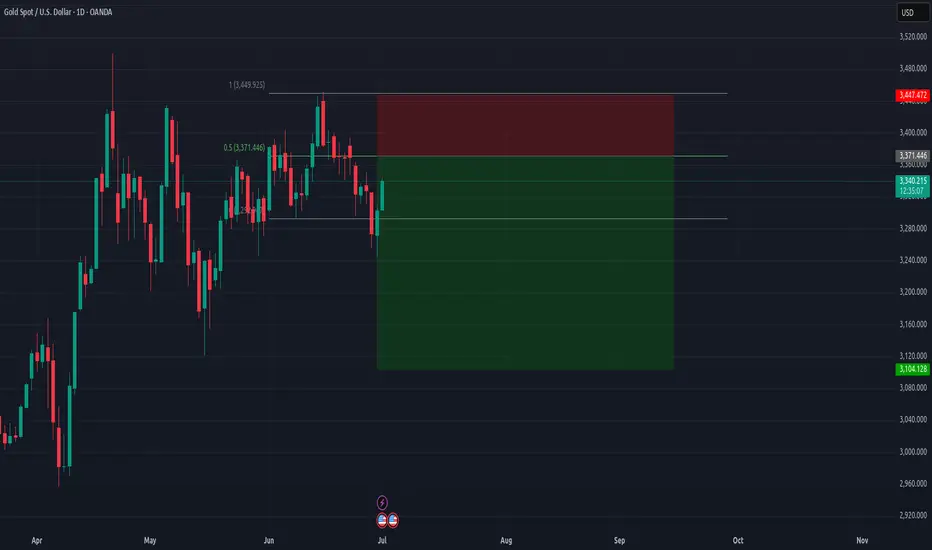
Gold Rebound Underway – Support Zone Holds Strong! - Short termGold( OANDA:XAUUSD ), as I anticipated in the previous idea , has attacked the Support zone($3,281-$3,243) and Support lines .
From an Elliott Wave theory perspective , it appears that Gold has completed 5 sub-waves of the main wave C .
Also, we can see the Regular Divergence(RD+) between Consecutive Valleys.
I expect Gold to rise to at least $3,307 in the coming hours.
Second Target: $3,321
Note: Stop Loss (SL) = $3,240
Gold Analyze (XAUUSD), 1-hour time frame.
Be sure to follow the updated ideas.
Do not forget to put a Stop loss for your positions (For every position you want to open).
Please follow your strategy; this is just my idea, and I will gladly see your ideas in this post.
Please do not forget the ✅ ' like ' ✅ button 🙏😊 & Share it with your friends; thanks, and Trade safe.

AUDCHF: Bullish Flag from PRZ — Rally to 0.54444?AUDCHF ( OANDA:AUDCHF ) bounced from the Potential Reversal Zone (PRZ) , which aligns with the Yearly Support(1) and the 50% Fibonacci level of the previous bullish impulse.
From a Classic Technical Analysis perspective , AUDCHF appears to be breaking out of a Bullish Flag Pattern , which may suggest the continuation of the previous uptrend .
This bullish reaction also confirms the importance of the Support zone(0.51166 CHF-0.49773 CHF) , where buyers stepped in aggressively.
In terms of Elliott Wave theory , it seems that AUDCHF has completed the bearish waves and we should wait for the bullish waves .
I expect AUDCHF to continue rising after a successful breakout from the flag’s upper boundary . If momentum sustains, the target could be around 0.54444 CHF .
Note: Stop Loss (SL) = 0.51972 CHF
Australian Dollar/ Swiss Franc Analyze (4-hour time frame).
Be sure to follow the updated ideas.
Do not forget to put a Stop loss for your positions (For every position you want to open).
Please follow your strategy; this is just my idea, and I will gladly see your ideas in this post.
Please do not forget the ✅ ' like ' ✅ button 🙏😊 & Share it with your friends; thanks, and Trade safe.

NETSOL Long term targetsLong term targets for NETSOL once it breaks out the triangle are listed in chart. You can take it either as Fib 1.618 or the price arrow top as your targets.

EURUSD – A Potentially Busy Day Ahead For TradersThis morning, EURUSD recorded a near 4 year high at 1.1807, the beneficiary of improving risk sentiment, uncertainty about the ECB’s next interest rate move, and concerns about what President Trump’s tax cut bill, that is progressing through the Senate currently, could mean for the sustainability of the US debt burden moving forward.
Now, with the FX quarter end rebalancing completed yesterday, it is possible to look forward to the upcoming scheduled events for today that could influence where EURUSD moves next.
First up, at 1000 BST this morning, traders receive the latest preliminary inflation (HICP) update for the Eurozone. The outcome of this release could provide further insight into whether the current market expectation for one more ECB rate cut in 2025 is possible, or if they may be on hold for the foreseeable future.
Next up, starting at 1430 BST is a panel discussion attended by ECB President Lagarde, Fed Chairman Powell, BoE Governor Bailey and BoJ Governor Ueda at the ECB’s Central Bank Forum in Portugal. The topic, “adapting to change: macroeconomic shifts and policy responses”. The comments of these central bank heads on inflation, interest rates, tariffs and economic growth could be important for the direction of all the major G7 FX pairs.
Then, at 1500 BST the ISM Manufacturing PMI survey is due for release. While US manufacturing activity is still expected to languish in contraction territory, below 50, traders will be focused on whether there has been any improvement in the headline print, and what the prices paid component could indicate for the direction of US inflation across the remainder of 2025.
These events, when taken with real time updates from President Trump and members of this administration on his tax bill, trade deals and flexibility of the July 9th tariff deadline, sets today up as a potentially volatile period for EURUSD trading.
Technical Update: Assessing the Recent Trend
From a technical perspective, a positive pattern of higher highs and higher lows remains in the EURUSD price and as the chart below shows, Tuesday has seen another new recovery high posted at 1.1807.
While much will continue to depend on market sentiment and price trends, it might be argued that the posting of this new price high for the current upside move, suggests a further phase of strength is still possible.
However, what are the levels traders may now be watching to gauge where the next directional price risks might lay over coming sessions?
Potential Support Levels:
Since posting the June 19th session low at 1.1446, EURUSD has rallied by over 3.00% (1.1446 to 1.1807) and while this doesn’t mean price weakness is necessarily on the cards, traders might become concerned a price correction is due after such a strong advance.
As the chart above shows, the 38.2% Fibonacci retracement of latest price strength, currently stands at 1.1668. This can mark a potential first support focus, after the recent move higher.
Closing breaks under 1.1668, while not a guarantee of further price declines, may then lead to a deeper phase of weakness towards 1.1583, which is equal to the 61.8% retracement level.
Potential Resistance Levels:
As a result of latest strength, EURUSD has traded to levels last seen in mid-September 2021 and to gauge the next potential resistance levels, we switch to the longer term weekly chart shown below.
If further price strength still emerges from current levels, traders may now be focused on 1.1909, the August 2021 failure high, as the next possible resistance level.
The material provided here has not been prepared accordance with legal requirements designed to promote the independence of investment research and as such is considered to be a marketing communication. Whilst it is not subject to any prohibition on dealing ahead of the dissemination of investment research, we will not seek to take any advantage before providing it to our clients.
Pepperstone doesn’t represent that the material provided here is accurate, current or complete, and therefore shouldn’t be relied upon as such. The information, whether from a third party or not, isn’t to be considered as a recommendation; or an offer to buy or sell; or the solicitation of an offer to buy or sell any security, financial product or instrument; or to participate in any particular trading strategy. It does not take into account readers’ financial situation or investment objectives. We advise any readers of this content to seek their own advice. Without the approval of Pepperstone, reproduction or redistribution of this information isn’t permitted.

ELLIOTT WAVE XAUUSD H4 update
EW Trade Set Up H4
monitoring the end of subminuette wave ii
subminuette wave ii is going to end in a double zigzag.
Waiting for an accumulation in the price range 3250/3315 before subminuette iii starts.
daily key levels (area)
3315
3275 POC
3250

ALBERT DAVIDAlbert David Ltd. is a pharmaceutical company engaged in the manufacturing and marketing of formulations, bulk drugs, and healthcare solutions. It serves domestic and export markets with products across therapeutic areas such as gastroenterology, gynecology, and general medicine. The stock is currently trading at INR 881.55, showing signs of upward momentum following a period of consolidation.
Key Levels
Support Levels: INR 758.00, INR 970.50, INR 1,141.30
Swing Level: INR 881.55
Possible Upside: INR 1,545.65, INR 1,758.55, INR 2,027.70
Technical Indicators
RSI (Relative Strength Index): Currently at 46.17, suggesting neutral momentum. A break above the mid-50s range would confirm growing strength.
Volume: At 21.34K, the rising volume alongside recent price uptick signals early signs of accumulation and potential trend development.
Sector and Market Outlook
Albert David operates in India’s formulation-driven pharmaceutical sector, which is buoyed by:
Consistent domestic demand for generics and branded formulations
Increased R&D investments for differentiated dosage forms and APIs
Evolving export strategy amid global interest in Indian pharma suppliers
Challenges include pricing caps by regulators, raw material import reliance (especially for APIs), and generic competition from larger incumbents.
Latest Developments
Manufacturing Upgrade: Recent investments in facility modernization to meet evolving GMP standards
Product Portfolio Expansion: Strengthening presence in anti-infectives and critical care segments
Earnings Performance: Sequential growth in operating margins with a focus on efficiency and therapeutic diversification
Dividend Update
Albert David Ltd. has maintained a consistent payout strategy, most recently declaring a dividend of ₹5.00 per share, reflecting stable fundamentals and shareholder alignment.
Analysis Summary
Albert David Ltd. is exhibiting a technically constructive setup within the broader pharma space. While momentum remains neutral, increasing volume and structural stability support a positive outlook. With improving fundamentals and rising investor participation, the stock may be entering a base-building phase with scope for medium-term trend development as sector sentiment strengthens.

LOTCHEM is bullishLOTCHEM has completed its retracement and already formed HL, now it's moving to form new High.

SOL/USDT Scalping Setup – 1H Reversal from Demand with FibonacciMarket Context:
Solana has pulled back into a key short-term demand zone after a sharp rejection from recent highs. Price action is now showing signs of local exhaustion, with confluence from lower timeframe support and bullish structure attempting to form. The setup anticipates a bounce targeting the mid-Fibonacci zone.
Setup Idea:
Price tapped into a local support shelf around 148.80, where previous demand initiated the last impulsive leg up. With momentum indicators stretched and RSI divergence building, this offers a high-probability scalp opportunity.
Targeting the 0.5–0.618 Fibonacci retracement zone as first resistance, with confirmation needed for further continuation.
Trade Plan:
Entry: Around 148.80–149.00
Stop Loss: Below 148.30 (beneath local swing low and structure break)
Target: 154.50–155.90 (Fibonacci 0.5 to 0.618 zone)
Risk/Reward: Approx. 2.5R
Notes:
This is a reactive setup — price must hold the current level or print a higher low. If sellers regain control below 148.30, the trade is invalidated. Watch closely for volume shift and 1H candle confirmation before adding size.
Mid-Fibonacci level (154.57) is a logical area to de-risk or take partial profits.

#XAUUSD(GOLD)): 29/06/2025 Last Analysis Going Great!Gold has been moving nicely since our last analysis, which we posted. Currently, 750+ pips have been generated, and we expect further price drops. There are still two targets in place, as per our previous analysis. We anticipate a steady decline in the price. We recommend all of you to follow strict risk management. This is not a guaranteed analysis or view, but rather an overview/educational chart analysis.
If you want to support us, you can do the following:
- Like
- Comment
- Share
Team Setupsfx_

EURJPY - Looking To Sell Pullbacks In The Short TermM15 - Strong bearish move.
Lower lows on the moving averages of the MACD.
No opposite signs.
Currently it looks like a pullback is happening.
Expecting bearish continuation until the two Fibonacci resistance zones hold.
If you enjoy this idea, don’t forget to LIKE 👍, FOLLOW ✅, SHARE 🙌, and COMMENT ✍! Drop your thoughts and charts below to keep the discussion going. Your support helps keep this content free and reach more people! 🚀
--------------------------------------------------------------------------------------------------------------------

Solana (SOL) Flag & Pole Breakout (1D)BINANCE:SOLUSDT broke out of a textbook falling wedge two days ago, and is now retesting the former resistance as support.
Key Technicals
• Falling channel with clean structure and multiple touches
• Resistance trendline broken
• Price now retesting the breakout zone (~$148)
• Overhead supply zone at $238–$260
• Measured Target: $240, within supply
Why This Setup Matters
• Clear breakout followed by a retest, which can often precede the next leg up if support holds
• Falling channel retracement aligns with 0.618 Fib, a common reversal area
What to Watch
• Daily close above the previous resistance trendline
• Push above the local $160 high for full confirmation
GOLD → Retest of the resistance range. Correction?FX:XAUUSD is recovering amid expectations of lower interest rates in the US, and the falling dollar is also supporting the price of the metal.
The dollar remains under pressure due to political uncertainty in the US, budget concerns, and trade risks. However, strong stock market growth and possible tariff measures against Japan and the EU are also affecting the market, adding volatility to gold
Powell will speak at the ECB forum, and markets are waiting for him to hint at a rate cut. Currently, the probability of a cut in July is estimated at 20%, and in September at 77%. A dovish tone will support gold, while a hawkish tone will increase pressure.
Technically, since the opening of the session, gold has exhausted its daily range (ATR), and there is a fairly high probability that after strong growth, the price may be stopped in the 3347-3350 zone.
Resistance levels: 3347, 3350
Support levels: 3312, 3295
If gold cannot continue to rise after breaking through 3347 and the price returns to the resistance zone, then in this case, we can consider a correction to 0.5-0.7 Fibonacci before a possible continuation of growth.
Best regards, R. Linda!

NVIDIA to $228If Nvidia were truly done for, why is it impossible to find their latest 5000 series GPUs?
Even if someone wanted to buy one, they simply can't.
The reason lies in Nvidia's commitment to fulfilling the soaring demand from AI data centers, which has left them unable to produce enough H100 and H200 models.
This situation also allows Nvidia to increase their profit margins significantly, capitalizing on the disparity between demand and the media frenzy surrounding them.
DeepSeek serves as a prime example of how out of touch mainstream media can be.
All DeepSeek did was replicate Chat GPT.
Training models requires substantial computing power. The panic surrounding Nvidia and other semiconductor companies is quite amusing; the demand for computing power is skyrocketing!
The gap between the reality of the AI mega-trend and the narrow focus of mainstream media is staggering! It's astonishingly out of touch! Just as out of touch as Cramer was when he declared META was done at $100, or when he thought Chat GPT would obliterate Google at $88.
Stock prices fluctuate between being overvalued and undervalued. While we have metrics like EGF and PE ratios to assess valuation, indicating that Nvidia is currently inexpensive, this doesn't guarantee it won't drop further. However, it is generally wiser to buy stocks when they are cheap rather than when they are costly.
The greater the deviation from the high then the greater the BUYING OPPORTUNITY being presented for the very best leading companies.
The key takeaway is that the deeper Nvidia falls during its corrections, the more advantageous it could be.
Those who are experiencing anxiety during these declines may find themselves selling at a loss, or for a marginal profit possibly around previous highs, while the stock has the potential to rise to $228 and beyond.
The potential for growth is significant; the $228 Fibonacci extension may not represent the peak. Attempting to predict a top for Nvidia could be misguided. Once it reaches $228, Nvidia might maintain a valuation similar to its current $130 level.

GOLD LONG TERMGold made a good push from 3250 and back up over 1000 pips.
Additionally, a break above 3340 failed, making a lower low below, opening up opportunity for further drops.
Also a perfect equal lows at 3250. Let's see if price sets up retracement sells from 3360-70 zone.
Critical Channel Watch Begins on the 1-Hour Chart of USDJPY.Hey everyone,
📉 My Latest USDJPY Analysis:
USDJPY is currently moving within a downtrend. If the price breaks below the lower boundary of the parallel channel, our first target level will be 142.910. The most crucial factor here is the downward breakout of that channel—don’t overlook it.
Also, keep a close eye on key economic data releases on the fundamental side, as they could significantly influence your strategy.
I meticulously prepare these analyses for you, and I sincerely appreciate your support through likes. Every like from you is my biggest motivation to continue sharing my analyses.
I’m truly grateful for each of you—love to all my followers💙💙💙

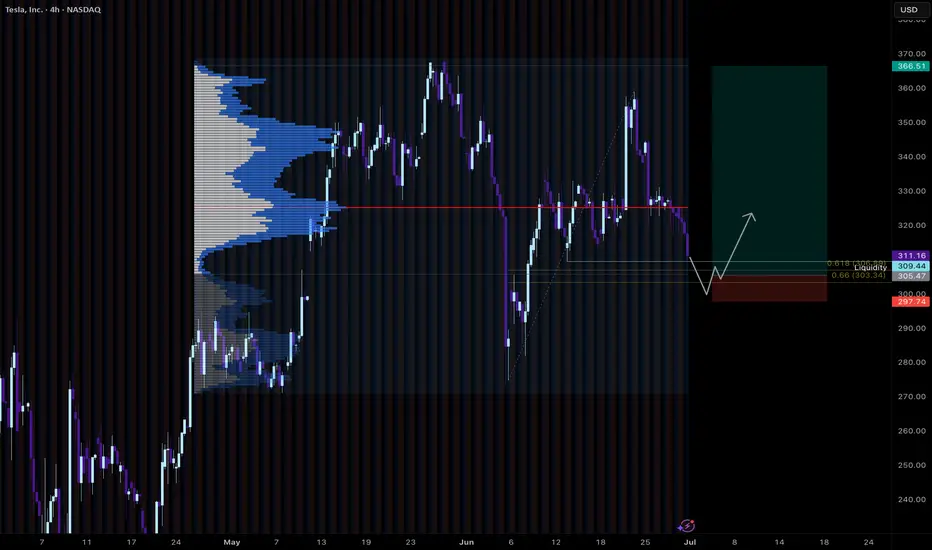
Tesla LongCurrently hanging around at the Golden pocket of the uptrend.
Would be interested in a long if we got a retrace to the whole move golden pocket, which sits on the current range VAL. Would also sweep liquidity from the recent lows.
Would need to see a good reaction to take the trade.
GOLD → Recovery and retest of resistance. DowntrendFX:XAUUSD has been recovering since the start of the session thanks to a weak dollar, but further growth is uncertain. However, the price is still below the key range and important levels.
At the beginning of the week, gold rebounded from monthly lows amid a weakening US dollar, which remains under pressure due to trade disputes with Japan, uncertainty surrounding the budget, and expectations of a Fed rate cut in September.
However, the technical picture for gold remains bearish, and further dynamics will depend on new statements from Fed officials, labor market data, and Jerome Powell's speech on Tuesday.
Technically, after breaking through the global range support, the price is forming a correction and testing 3294. Before a possible rise to 3320 or to the 0.7 Fibonacci zone, a correction to 3271 may form, which will determine the further development of the situation.
Support levels: 3271, 3255, 3245
Resistance levels: 3294, 3320, 3347
A retest of 3295 (0.5) Fibonacci is forming. There is a possibility of a false breakout with a possible correction. If, during the correction, buyers keep the price above 3271 and return to retest 3294, we will have a chance to attempt growth to 3320 - 3347
Best regards, R. Linda!

NQ Power Range Report with FIB Ext - 7/1/2025 SessionCME_MINI:NQU2025
- PR High: 22886.75
- PR Low: 22852.50
- NZ Spread: 76.75
Key scheduled economic events:
09:30 | Fed Chair Powell Speaks
09:45 | S&P Global Manufacturing PMI
10:00 | ISM Manufacturing PMI
- ISM Manufacturing Services
- JOLTs Job Openings
Holding in ATH range
Session Open Stats (As of 12:45 AM 7/1)
- Session Open ATR: 329.32
- Volume: 21K
- Open Int: 269K
- Trend Grade: Neutral
- From BA ATH: -0.1% (Rounded)
Key Levels (Rounded - Think of these as ranges)
- Long: 23239
- Mid: 21525
- Short: 20383
Keep in mind this is not speculation or a prediction. Only a report of the Power Range with Fib extensions for target hunting. Do your DD! You determine your risk tolerance. You are fully capable of making your own decisions.
BA: Back Adjusted
BuZ/BeZ: Bull Zone / Bear Zone
NZ: Neutral Zone
