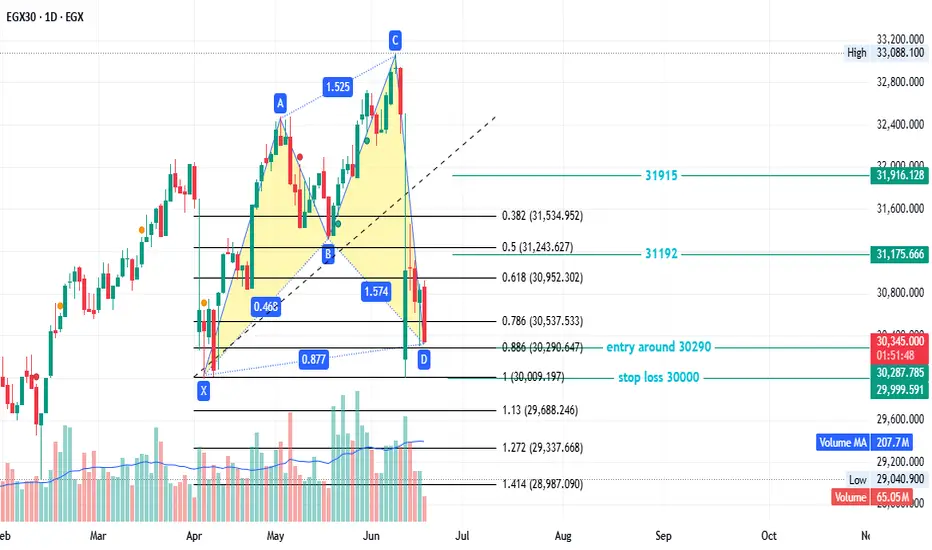
EGX30 - good newsEGX30 created a bullish pattern
entry around 30290
stop loss 30000
first target 31192
secund target 31915
This is not investment advice—only my analysis based on chart data. Consult your account manager before investing. Good luck!
Fibonacci
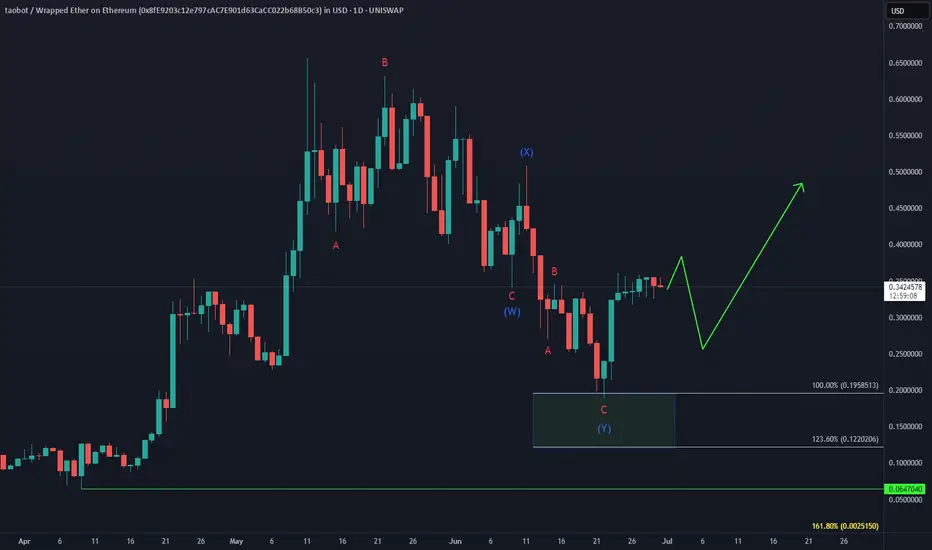
TAOBOT Bullish ReversalWill UNISWAP:TAOBOTWETH_8FE920.USD outperform BINANCE:TAOUSD ?
After the failed early June bounce, price completed a double correction into the $0.195–$0.12 equal legs zone, triggering a sharp 90% reaction higher.
As long as $0.19 holds, the setup favors continuation to the upside, with a break above the May peak in focus.
FARTCOIN Bullish Reversal in Progress
CRYPTO:FARTCOINUSD 3-swing correction from the May peak appears complete, even though price didn’t quite tag the $0.75 entry zone.
Now, the spotlight’s on the bulls — can they deliver an impulsive rally off the lows to invalidate a potential double correction next month?

KAITO gears up for liftoff!CRYPTO:KAITOUSD
The correction from the May peak has wrapped up within wave (2), and price is now pivoting from the June low at $1.22. Holding above that level keeps the bullish roadmap intact—with eyes firmly on the $2.96 target to unlock fresh all-time highs.

Bitcoin BTC price analysis BTC.D and events calendar for JulyToday is the last day of the month and the last day of the second quarter, so there may be some volatility in the markets between 🐂 VS 🐻
💰 The CRYPTOCAP:BTC chart shows an interesting picture — the price has reached the upper limit of the consolidation channel, and now:
1️⃣ The scenario with an upward breakout is quite clear: a breakout from the channel upward and consolidation above $108-110k= a move to $125k during July.
2️⃣ A correction to $99k will mean that buyers have taken control of the OKX:BTCUSDT price, preventing it from updating its lows. This will be a clear signal to buy, because further growth is inevitable.
3️⃣ A deep correction to $91,660 (filling the GAP that formed on the CME BTC chart) or slightly lower. This is the last “unclosed” GAP, which, according to TA rules, should be filled for a full-fledged growth trend to begin.
So which scenario is closer to your heart, which one do you believe in?
Or write your version of events in the comments.
Interesting observations to think about:
◆ Over the past two weeks, the inflow of funds to #BTCETF has exceeded $5 billion, but the price of #BTCUSD on CEX exchanges has not been able to “break out” upward. Is this just ETF "property of numbers", or are spot #Bitcoin sales that strong?
◆ The BTC.D indicator has reached a critical level of 66%, and it will be interesting to see whether it will give altcoins some breathing room next month.
(If there are a lot of likes and comments under the idea, we will additionally describe our thoughts on BTC.D and USDT.D.)
◆ SP 500, by the way, has updated its highs, and the last few months on the stock market are very similar to the beginning and middle of the COVID-19 pandemic in 2020.
◆ And in principle, July promises to be very eventful:
👉 By July 9, Trump is expected to make a statement regarding the tariff wars with the rest of the world, which he has put on hold.
👉 July 18 marks the beginning of Mercury retrograde, which “influences” people's behavior and ‘superstitions’ and forces them to be “more cautious” when making trading decisions (and trading bots don't care about emotions and beliefs)
👉 And on July 30, there will be a FOMC meeting, where Mr. Powell may announce a rate cut, as the US is in a recession, which is time to acknowledge.
If we have forgotten anything, please add it in the comments!

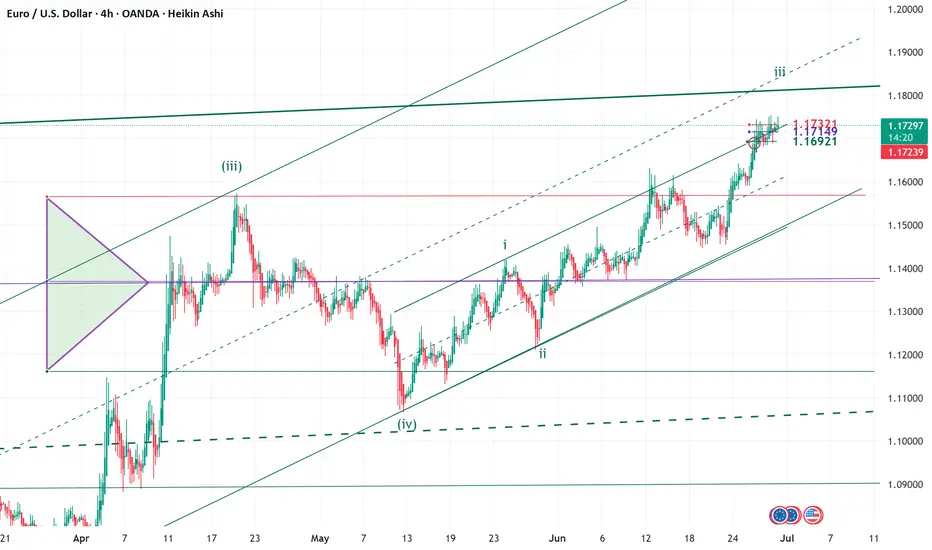
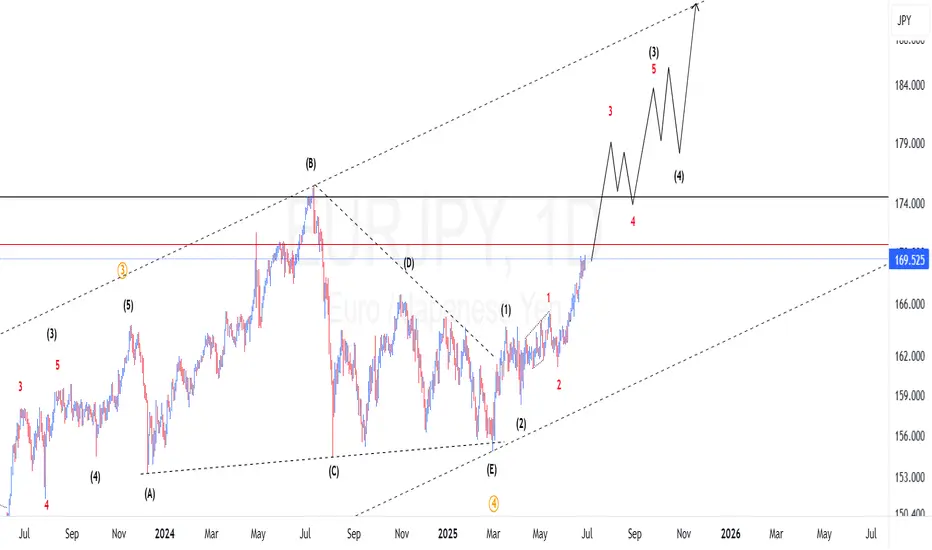
ELLIOTT WAVE EURUSD H4 update
EW Trade Set Up H4
minuette W4 ended, w5 running
with the decisive break of the 1.1570 level, wave 4 can be declared finished and wave 5 is underway in motive way. Not clear yet the type of motive wave impulsive or diagonal.
daily key levels (area)
1.1732
1.1715 POC
1.1690
XAUUSD AnalysisAs from the above analysed chart I can see possible reversal from the zone 3297-3310 .
So, we can dilligently hope to find our setup from the zone .
Please follow me to find out my setup .

NQ Power Range Report with FIB Ext - 6/30/2025 SessionCME_MINI:NQU2025
- PR High: 22842.50
- PR Low: 22751.50
- NZ Spread: 202.75
Key scheduled economic events:
09:45 | Chicago PMI
Weekend volatility taking auction into new ATHs
Session Open Stats (As of 12:45 AM 6/30)
- Session Open ATR: 345.85
- Volume: 33K
- Open Int: 261K
- Trend Grade: Neutral
- From BA ATH: +0.1% (Rounded)
Key Levels (Rounded - Think of these as ranges)
- Long: 23239
- Mid: 21525
- Short: 20383
Keep in mind this is not speculation or a prediction. Only a report of the Power Range with Fib extensions for target hunting. Do your DD! You determine your risk tolerance. You are fully capable of making your own decisions.
BA: Back Adjusted
BuZ/BeZ: Bull Zone / Bear Zone
NZ: Neutral Zone

$BTC Bullish Engulfing Weekly CloseCRYPTOCAP:BTC closes the Week with a Big Bullish Engulfing candle back within the POI.
Should retest ATH soon.

NZDJPY Technical + Fundamental Short Alignment = Short SetupToday, I want to review the NZDJPY ( OANDA:NZDJPY ) pair short position from a fundamental and technical perspective . It seems to be in a good zone for a short position.
Do you agree with me?
----------------------------------------
First, let's look at the fundamentals of NZDJPY.
New Zealand (RBNZ):
The Reserve Bank of New Zealand cut the OCR by 25bps in May and hinted at further easing if inflation continues to cool. Recent CPI data has shown clear disinflation trends, increasing the likelihood of more rate cuts in the second half of 2025. Consumer confidence is also declining, and retail sales have been weaker than expected.
Japan (BoJ):
The Bank of Japan is under growing pressure to tighten monetary policy. Inflation remains above 2%, and market expectations for a rate hike later this year are building. Any shift from ultra-loose policy supports JPY strength, especially against weaker yielders like NZD.
Macro Summary:
Diverging monetary policies: RBNZ easing, BoJ possibly tightening.
NZD weakened by soft data, JPY strengthened by policy expectations.
Risk sentiment is currently neutral-to-negative, favoring safe-haven JPY.
Conclusion:
Short NZDJPY is fundamentally justified. The pair aligns with macro forces: NZD is pressured by rate cuts and weak growth, while JPY is poised to strengthen with upcoming policy shifts.
----------------------------------------
Now let's take a look at the NZDJPY chart on the 4-hour time frame .
NZDJPY is currently trading near the Potential Reversal Zone(PRZ) .
In terms of classic technical analysis , it appears that NZDJPY has successfully formed a Rising Wedge Pattern .
Also, we can see the Regular Divergence(RD-) between Consecutive Peaks.
Based on the above explanation , I expect NZDJPY to drop to at least 87.159 JPY if the lower line of the Rising Wedge Pattern and the Support zone(86.50 JPY-87.00 JPY) are broken, the second target could be 86.043 JPY .
Note: Stop Loss(SL): 88.378 JPY
Please respect each other's ideas and express them politely if you agree or disagree.
New Zealand Dollar/ Japanese Yen Analyze (NZDJPY), 4-hour time frame.
Be sure to follow the updated ideas.
Do not forget to put a Stop loss for your positions (For every position you want to open).
Please follow your strategy and updates; this is just my Idea, and I will gladly see your ideas in this post.
Please do not forget the ✅' like '✅ button 🙏😊 & Share it with your friends; thanks, and Trade safe.

$SOL Bullish Engulfing On WeeklyCRYPTOCAP:SOL closes the week with a Bullish Engulfing candle.
50WMA at $170 next target to smash.

GBPUSD ANALYSIS After seeing that the previous candle closed really bullish on the week we could expect that momentum to continue since the daily and the 4hr structure are not showing any signs of reversal

BNB/USDT 1D🕵️♂️ General context
• Steam: BNB/USDT
• Price: 649.52 USDT
• Time: 1D (daily interval)
• Currently, the reflection is underway after the inheritance, but the technical situation remains uncertain.
⸻
📈 Trend and market structure
• You can see a previous strong drop (visible long red candles).
• Currently, reflection is underway to the level of technical resistance (approx. 650–672 USDT).
• A medium -term inheritance trend is still in force - marked with an orange interrupted line of decreasing (inheritance) trend.
⸻
📊 Technical levels
🔹 Opora (green levels):
1. 651.01 USDT - the first tested resistance (current price right next to it).
2. 672.68 USDT - another resistance, above SMA (2), historically strong level of sales.
3. 700.81 USDT - strong psychological and technical level, tested in the past.
🔻 Support (red levels):
1. 636.40 USDT - short -term support (price maintaining just above this level).
2. 625.65 USDT - key support - if it is broken, a possible test of lower levels.
3. 607.62 and 595.27 USDT - subsequent support, where purchases appeared earlier (Long Knoty).
⸻
📉 Technical indicators
🔵 MacD
• Histogram comes out of red - a potential signal of Momentum change to upward.
• The MacD line begins to turn up to the signal line - possible Bullly Crossover soon (buy signal).
🟣 RSI
• RSI oscillates around line 40-50-it is a neutral zone with a slight tilt down, but RSI-Based has a possible reflection.
• Lack of purchase or sale - suggests that traffic can go both ways.
⸻
🔃 Medium walking (SMAS)
• The price is tested by several medium (green, red, blue line):
• SMA (1) and SMA (5) are similar and flat - no clear short -term trend.
• SMA (2) acts as a strong resistance at 672 USDT.
• Need to break out over 672.68 to recognize that the trend can turn around.
⸻
✅ Applications - technical scenarios
🔼 Bullish (upward) scenario:
• Crossing the level 651–672 USDT and closing the daily candle above.
• Confirmation by RSI> 50 and MacD crossover.
• Target: 700–710 USDT.
🔽 Bearish (inheritance) scenario:
• Price rejection with current resistance and descent below 636 → 625 USDT.
• If 625 falls, a possible drop in around 607/595 USDT.
• RSI may then fall into the sale zone.
⸻
🧠 Neutral / swing strategy
• Currently, the market in potential consolidation between 625 and 672 USDT.
• You can consider:
• Buying at the lower consolidation limit (625–636) with a stop-loss below 620.
• Short or Take Profit at the upper limit (670+) until it breaks out.

PGY - Watching for a Pullback to Previous High or 20EMAWhy This Setup Has My Attention:
Strong uptrend , but currently looks overextended
Approaching the 1.618 fib level — often a profit-taking zone
Heavy green volume recently on the daily chart = demand still present
I’m looking for a pullback to $20.60, which aligns with the previous high and the 0.382 fib retracement — a healthy spot for price to reload if bulls are still in control.
Plan:
Entry Zone: $20.60 area or bounce off the 20EMA
Stop: Below the most recent swing low at time of entry
Profit: Wherever 1.618 fib is, using the high and low of the wave down.
If $21+ breaks and holds: I’ll look for a retest entry on strength

#btc #btcusd #elliottwave long buy setup wave 5/3 30Jun25This count is based on my assumptions so anything can happen not a trading or financial advice just for educational purposes only kindly do your own ta thanks trade with care good luck.

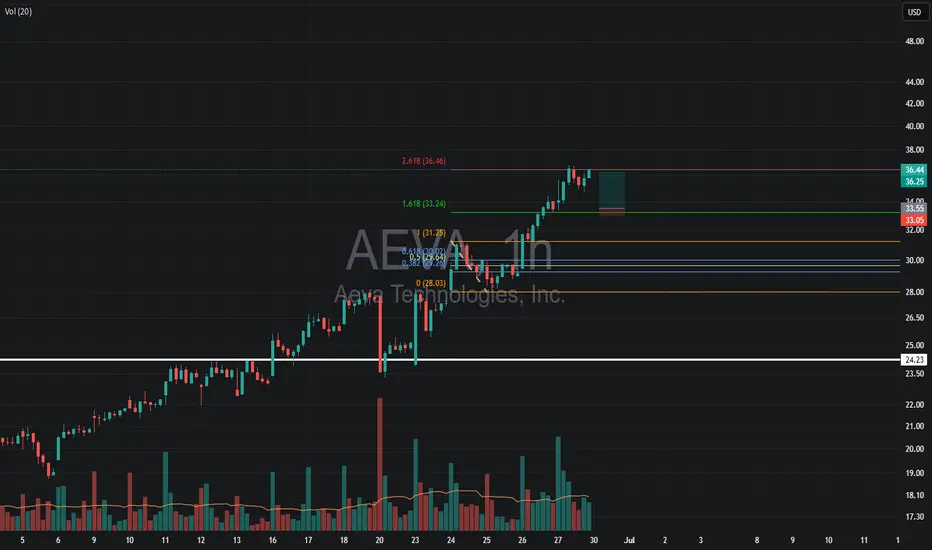
AEVA – Planning a Pullback Entry in a Strong UptrendWhy I Like This Setup:
Powerful daily uptrend — momentum clearly to the upside
Buyers stepping in on every dip — strong demand showing up consistently
Game Plan:
Entry Zone: Watching the 1.618 fib level for a pullback and bounce
Stop: Just below that 1.618 fib — clean invalidation point
Target: Previous high, but with this strength, I’ll likely use a trailing stop once price moves in my favor
Letting the trend do the heavy lifting on this one
Trading the Impulse Rally Retracement — Price and Time Symmetry The Stop Loss Triangle is back!
This time with BITSTAMP:BTCUSD coming off its recent impulse rally. For those of you that aren’t familiar with my strategy — let me start from the beginning…
This concept involves positioning against the opposing decline in price and time as a precursor to our theoretical projection. If the underlying enters our predetermined faded cross-section, the stop loss is triggered to prevent sideways consolidation and the erosion of contract premiums or leverage decay.
This inherently ‘sclene’ triangle is constructed by drawing a straight trend line through the bottoming reversal candle and the furthest projection in price and time symmetry (78.6%) of the retracement. Once connected, draw a vertically positioned straight line from the highest or lowest point in the previously identified retracement to the bottom reversal candle area once again. To create a ‘right triangle’, now turn 90 degrees towards the final point, which is determined by the nearest projection in price and time symmetry (38.2%). This allows time after the imposed price and time date, yet not enough for premium or leverage decay to become significant.
In its entirety, this forms the stop loss triangle.
I encourage my followers to identify and explore the system on their own. As always, feel free to ask me anything related to it. We’ll follow along and you’ll be amazed at the precision of Fibonacci symmetry.
CHEERS

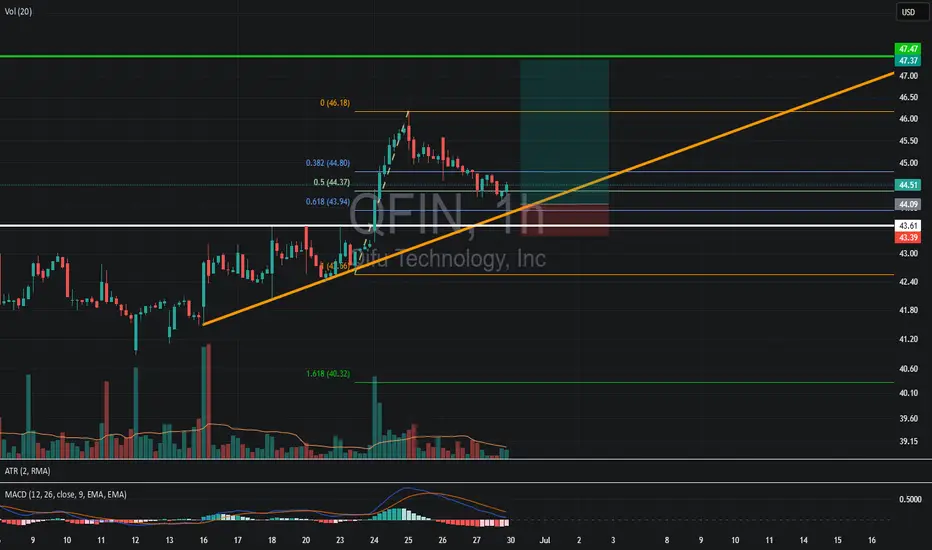
QFIN – Eyeing a Pullback Entry Near $44 Trendline SupportWhy This Caught My Eye:
Consistent green volume > red — demand remains strong
June 24: Big green candle on high volume
Last 3-day pullback = low volume → likely healthy retrace
0.618 fib lines up with the uptrend support — strong confluence
My Plan:
Entry Zone: Around $44 after a bounce off the trendline
Stop: Below the trendline and the prior resistance (now support)
Target: 1.618 fib extension (measured from expected entry point)
Clean price action + volume story makes this one worth watching.
UTI on WatchWatching for a Breakout Above 52-Week High – $36.65
Why I'm Watching:
Strong weekly uptrend
Heavy green volume on Friday = buying interest
MACD curling up – possible momentum shift
Bear Flag? Maybe… But
The current flag has lasted 13 days with no breakdown attempt — that hesitation leans more like consolidation than weakness. I’m leaning bullish unless we lose key support.
Plan:
Entry Trigger: Break and close above $36.65 (1.618 fib extension + retest of 52wk high)
Stop: Below the previous 52-week high (potential support level)
Sharing my thought process — not financial advice. What’s your read on this setup?

EURJPY bullish continuation Price is still on uptrend on 3rd wave wave. What we should expect is small pullbacks and continuation up.
GBPAUD Elliot waves Short IdeaPrice made a leading diagonal to the downside which completed potentially wave 1. At it is currently pulling back up for wave 2 which unfolds as a zigzag ABC. If this count is correct we should expect price to find resistance on the golden zone which is in line with the upper trendline of the channel. So we should be looking to short GBPAUD at either upper trendline of the channel or somewhere between 50% and 61.8% fib retracement.

NZDUSD Elliotwave Update: Is wave 2 complete?We have seen from our previous count price made a leading diagonal and have pulled back down with 3 waves. The question is whether the correction is complete and we have already resumed the bullish momentum. Us long us we are not taking the previous high then we should expect price to pullback down to complete wave 2 at 38.2 fib. If we are correct then we should expect price to drop in the coming days.

XAUUSD Elliot wave update: Is wave 4 still in play?From our previous count we were anticipating a drop for 4th wave completion. We can see now we have been dropping as anticipated. Given the current wave structure I am expecting a double 3 (wxy) to complete this 4th wave. If we are correct then we should expect price to continue down from current position before pulling back up and fall one more time. To take advantage of the move if not caught at the top, one should find areas where price will find resistance to short the market.
