ADA ELLIOT WAVE COUNTADA ELLIOT WAVE COUNT. Correct me if I’m wrong. I think a $1.50-$2 ADA this cycle is possible. Not unreasonable.
Fibonacci

AUD/USD Coils Below Critical ResistanceThe June range is preserved heading into the close of the month with a massive outside-weekly reversal taking Aussie back into key resistance on Friday. Note that momentum is approaching the 60-level for the first time this year and a break higher alongside a breach above 6550 could fuel a substantial rally here- watch the weekly close.
Initial support rests with the February high-week close (HWC) at 6357 and is backed closely by 6290/6315- a region defined by the yearly low-week close (LWC) and the 38.2% retracement of the yearly range. Note that the median-line converges on this level over the next few weeks and we’ll reserve this threshold as our bullish invalidation level- a break / weekly close below would threaten downtrend resumption toward the next major technical consideration at 6162/79.
A topside breach / close above this key pivot zone is needed to fuel the next leg of the advance with key resistance seen at the 2019 lows near 6670. Ultimately a break above the upper parallel (blue) would be needed to suggest a more significant trend reversal is underway with subsequent resistance objectives eyed at the 2024 HWC / yearly open near 6795-6810 and 6900.
Bottom line: An outside-weekly reversal has covered the entire monthly range with the Australian Dollar now testing critical resistance for an eighth-consecutive week. From a trading standpoint, losses should be limited to the 52-week moving average IF price is heading higher on this stretch with a close above 6550 needed to fuel the next move.
-MB

HTL is at the best level for taking a position.HTL is at the best level for taking a position.
It has already taken the Fib retracement, and is taking support from a trendline

Gold is near the 0.618 levelGold is near that 0.618 level, going to watch it closely from here. We might not get an entry until Sunday at 6pm NY time when market open.
Key Level to watch 3249, 3194
We need SPY / ES to come down for gold to gain momentum.

BTC Looking for a Wave 2 Reset Before the Real MoveBITSTAMP:BTCUSD looks like it just wrapped a clean ABC correction and kicked off a fresh 5-wave impulse. We’ve probably topped out on wave 1 heading into the weekend, Stoch RSI is flashing overbought, price is hitting resistance just under 108.3K, and we’re also seeing some bullish divergence creeping in.
I’m expecting a pullback from here, ideally into that 0.5–0.618 retrace zone (103.2K–104.4K). That would line up well with the mid-channel and EMA support. From there, we could be set up for a proper wave 3 breakout (as long as we don't get any more surprise tariffs or wars).
Fed still leaning dovish into Q4, even with some Q3 inflation and tariff noise. Rate cut odds ramp into Sept/Dec, so bigger picture looks constructive. In my eyes, the longer the FED holds off on these cuts, the longer this cycle extends.
Key zones I’m watching:
Support: 105.3K > 103.2K > 100.8K
Resistance: 108.3K > 112K > 114.5K+
If we dip and hold structure, I’ll be watching for confirmation to load into wave 3.

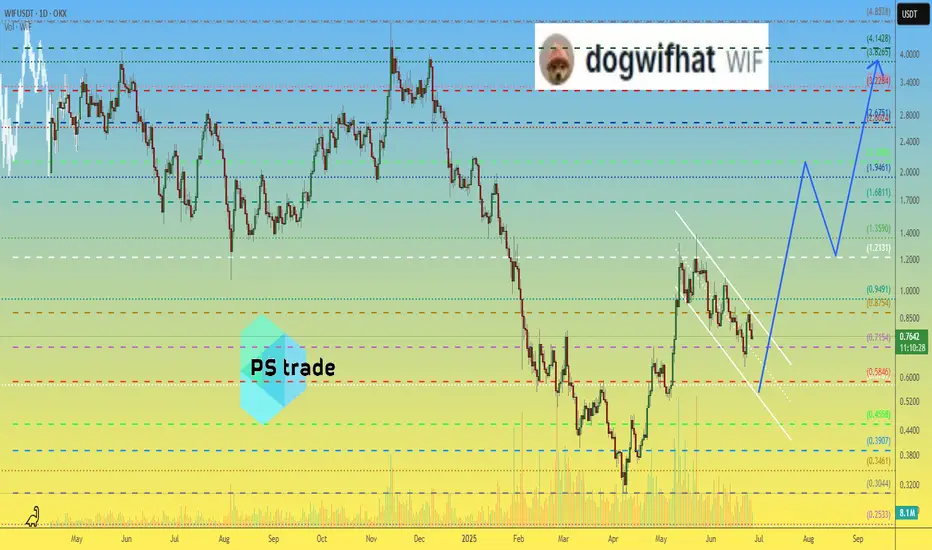
dogwifhat WIF price analysis🤪 "They" are trying to breathe "new life" into #WIF . And if they manage to keep the price of OKX:WIFUSDT above $0.55, this plan will have a chance of success.
So what do we have:
◆ #WIF holders need to keep their fingers crossed that everything will work out and there will soon be growth, and with it a chance to get out of a prolonged "draw fall"
◆ Traders need to wait for confirmation that the price of #WIFUSD is holding steady above $0,55.
And no large trading leverage, because this is a fairly volatile meme coin, even x5 leverage, which allows for a -19% error, or x3, which forgives a “miss” of -32% from the entry point, can liquidate your deposit when trading volatile assets.
⁉️ Do you believe that the price of #dogwifhat can still return to the $4 range with a corresponding project capitalization of $4 billion?
_____________________
Did you like our analysis? Leave a comment, like, and follow to get more
GOLD → Local bearish trend. Retest of support.FX:XAUUSD is technically looking a little weak. Support is being retested amid de-escalation of geopolitical conflicts in the Middle East. Interest in the metal is waning.
On Friday, gold remains under pressure ahead of data on the core PCE index, a key inflation indicator for the Fed. If inflation turns out to be higher than expected, this could strengthen expectations of a rate cut as early as July, supporting gold. The probability of a July cut is currently estimated at 21%, and 75% for September. Amid dollar volatility caused by rumors of a possible Fed chair replacement and trade negotiations with the EU and China, traders remain cautious, awaiting clarity on inflation and monetary policy
Technically, before falling, gold may form a correction to 3320 (liquidity capture).
Resistance levels: 3320, 3336, 3347
Support levels: 3293, 3271
If the fundamental background remains unchanged and gold continues to decline towards support at 3293 and break through this level, the breakout could lead to a fall to 3271. However, I do not rule out the possibility that after a sharp decline, a correction to 3320 could form before the fall.
Best regards, R. Linda!

USDCHF → Hunting for liquidity before the fallFX:USDCHF , against the backdrop of the falling dollar and the exit from consolidation, is forming another ‘bos’, which only confirms the market sentiment.
The fall of the dollar only increases pressure on the currency pair. The price has broken out of consolidation and is trading below the key level. USDCHF has broken through a fairly strong support level, which only confirms the bearish market structure. A correction is forming ahead of a possible decline (liquidity capture).
Resistance levels: 0.803, 0.8042
Support levels: 0.798, 0.79
Fundamentally and technically, the currency pair looks weak. The decline may continue after the liquidity capture phase and a retest of resistance. A false breakout of resistance will be a strong signal.
Best regards, R. Linda!

Gold's Decline Not Over (Yet)#Gold is in a declining pattern that appears incomplete. Here are 2 models we are following closely.
1. A decline in wave (iii) of ((c)) - targeting $3,120
2. A decline in wave iii of (ii) - targeting $3,220-3,240
Both models imply the current decline is not over.
FLAT PATTERN
The flat pattern subdivides as a 3-3-5 ((a))-((b))-((c)) pattern. The decline appears to be in the latter stages of this pattern, wave ((c)).
This wave needs to unfold as a motive 5-wave pattern...it appears we are in the 3rd wave decline so a couple of more trends lower. The flat targets $3,120.
LEADING DIAGONAL
The leading diagonal is a motive pattern labeled i-ii-iii-iv-v. The leading diagonal pattern is already complete and now a partial retracement lower of the diagonal is underway. This partial retracement likely carries to $3,220-$3,240.
Under both scenarios, once they are complete, a strong rally is likely to follow. However, the downtrends need more price and time to develop so the rallies are on hold for the moment.

XAUUSD long on market priceHere is the technical analysis for XAUUSD (gold).
Top down analysis show upward momentum:
Also on daily is bounced close to daily support-
On chart in the beginning it's visible that on 4H price has bounce from 4H support.
Market price: 3320
SL: 3280
TP1: 3360
TP2: 3400
Tp3: 3440

XAU/USD – Bullish Reversal in Motion? Watch the Breakout ZoneGold just gave us a critical reaction off a key confluence zone — and bulls might finally be waking up. Here's the breakdown:
🔹 Falling Wedge Breakout:
Price respected the wedge support beautifully around the 0.382-0.5 Fib retracement and has now closed above the upper descending trendline. The falling wedge is a bullish reversal pattern, and we may be witnessing the early stages of a trend shift.
🔹 EMAs Realignment Pending:
Price is now testing the 20 and 50 EMAs — a clean break and close above them would likely trigger algorithmic momentum back into bullish continuation, especially if we see a flip of the 0.382 Fib at $3,324 as support.
🔹 Upside Targets:
* TP1: $3,372 (0.236 Fib)
* TP2: $3,450 (previous structure high)
* TP3: $3,539 (full range expansion)
🔹 Invalidation Below:
A break back inside the wedge and below $3,285 would invalidate the bullish bias and likely open the path to deeper correction toward $3,251 or even $3,217.
📌 Key Insight:
The best trades aren’t about prediction — they’re about preparation. This setup is all about reacting to price as it confirms. Let the market tell you when it’s ready to move, then strike with confidence and precision.
💡 Watching for bullish retest + volume confirmation before entering long.

S&P500 and Nasdaq Short: Wave 5 <= Wave 3Based on the Elliott Wave rule that wave 3 is not the shortest wave, I gave a projection on where the peak of both S&P500 and Nasdaq could be. Based on these peaks, the stop is set above and the take profit target is where wave 4 was.

MOIL - Potential for 500 target with Crown pattern in makingMOIL has confirmation for Bullish crown formation .
It has closed above 20 & 50 EMA on day time frame.
Moreover MACD is signal line has turned positive.
With all this it has potential for following targets;
360 / 400 / 450 / 500
SL: 315

API3USDT in Extended WXY Decline Key Breakout Levels in FocusAPI3USDT continues its corrective descent, unfolding into a potential WXY pattern, with price action currently extending toward the completion of leg Y. Attention is now on the Immediate Resistance Level (IRL) and the Main Support Zone highlighted on the chart.
Price is expected to remain range bound within these levels. A breakout will define the next major move, a break below support could complete the corrective structure into the Potential Reversal Zone (PRZ), while a break above the IRL may trigger a strong bullish leg toward the setup’s main upside target.
Share your thoughts on API3 in the comments!

NQ Power Range Report with FIB Ext - 6/27/2025 SessionCME_MINI:NQU2025
- PR High: 22713.50
- PR Low: 22669.25
- NZ Spread: 98.75
Key scheduled economic events:
08:30 | Core PCE Price Index (YoY|MoM)
Session Open Stats (As of 12:35 AM 6/27)
- Session Open ATR: 348.99
- Volume: 21K
- Open Int: 260K
- Trend Grade: Neutral
- From BA ATH: -1.7% (Rounded)
Key Levels (Rounded - Think of these as ranges)
- Long: 23239
- Mid: 21525
- Short: 20383
Keep in mind this is not speculation or a prediction. Only a report of the Power Range with Fib extensions for target hunting. Do your DD! You determine your risk tolerance. You are fully capable of making your own decisions.
BA: Back Adjusted
BuZ/BeZ: Bull Zone / Bear Zone
NZ: Neutral Zone
Keep in mind this is not speculation or a prediction. Only a report of the Power Range with Fib extensions for target hunting. Do your DD! You determine your risk tolerance. You are fully capable of making your own decisions.
BA: Back Adjusted
BuZ/BeZ: Bull Zone / Bear Zone
NZ: Neutral Zone

Bitcoin Top is In! Bear considerationsPrice has been carving out an unclear correction off the high. The recent structure has many squinting. Is it done or the calm before another wave of selling?
I am weighing two bearish scenarios here. One is more aggressive than the other. But both start with the same idea. No new high before another low.
Let’s start at the top.
The initial move down off the recent high could count as an impulse. Whether that is a wave 1 or a wave A is still up for judgment. Either way, that first leg sets a bearish tone at the larger degree.
Here’s where it gets interesting. The correction since then shows traits of a flat. A running one at the moment.
This opens the door to two active bearish projections:
A wave C collapse, implying a completed A B C correction and a downside resolution.
A wave 3 drop, for a possible top if this is an impulsive sequence.
That is the fork in the road. And it all hinges on the next move.
Right now, the smallest degree impulse off the low is doing some heavy lifting.
If that pivot holds and we only get an internal retracement like a micro wave 2, the door is still open for upside continuation.
But if that impulse gets invalidated, I would expect bears to press. First for a break below 100k, then toward the 95k area.
Here is how to think about it:
Hold the small impulse → Potential upside
Break the impulse base → Wave C or 3 likely underway
Context still leans bearish. Lower highs are still in play. But we are hunting a specific structure to confirm it.

Palladium Wave Analysis – 26 June 2025
- Palladium broke resistance level 1100.00
- Likely to rise to resistance level 1200.00
Palladium recently broke the resistance zone between the resistance level 1100.00, resistance trendline of the daily up channel from April and the 61.8% Fibonacci correction of the downtrend from October.
The breakout of this resistance zone accelerated the active minor impulse wave 3 of the intermediate impulse wave (C) from April.
Palladium can be expected to rise to the next resistance level 1200.00, target price for the completion of the active impulse wave 3.

Silver Wave Analysis – 26 June 2025- Silver reversed from key support level 35.50
- Likely to rise to resistance level 37.20
Silver recently reversed up from the key support level 35.50 (which stopped the previous minor correction iv at the start of June, as can be seen from the daily Silver chart below).
The support zone near the support level 35.50 was strengthened by the 20-day moving average and by the 38.2% Fibonacci correction of the sharp upward impulse from May.
Silver can be expected to rise to the next resistance level 37.20, which stopped the previous sharp impulse wave 3.

SOL/USD🔹 Trend direction
Current short-term trend: down
Price below key moving averages:
SMA50 (green) ≈ 154.84
SMA200 (blue) ≈ 168.79
Price ≈ 142.49 – below both, confirming weakness.
🔹 Supports and resistances (key levels)
✅ Supports:
142.00–143.50 – current level where price is struggling (multiple price reactions).
131.00 – strong support, last low (June 18).
119.00 / 116.00 / 113.00 – next supports from previous consolidations.
95.61 – deep support if market breaks down.
❌ Resistances:
148.00–150.00 – local resistance, coinciding with the red SMA (short-term resistance).
154.84 – resistance (SMA50).
162.00 – resistance (SMA200).
183.00 – main resistance from the May peak.
218.55 – very strong resistance from March.
🔹 Technical indicators
📉 MACD:
MACD line < signal, negative histogram → bearish signal.
No signs of bullish strength.
📉 RSI:
RSI ≈ 41.31 – close to the oversold zone, but not there yet (below 30).
RSI trend also downward.
🔹 Formations and trend lines
Broken support line after the April-May bullish structure (white trend line).
The previous bearish trend line (yellow) was broken in April, but the momentum did not hold.
A lower high and lower low may be forming now – a classic bearish structure.
🔹 Potential scenarios
🔻 Bearish:
Breakout of 142 → test of 131 → possible drop to 119/116.
Staying below SMA50 and MACD still negative = high chance of continuing declines.
🔼 Bullish:
Recovery of 148–150 needed → only then a chance to test 154 and SMA50.
RSI close to oversold = possible local technical bounce, but not reversing the trend.
📌 Conclusions / Summary
General trend: Bearish (down).
Sentiment: Negative, no confirmed signals of strength.
If level 142 breaks - next test will be at 131.
A strong breakout above 150-154 is needed to talk about a change in structure.

USDCAD Wave Analysis – 26 June 2025
- USDCAD reversed from the resistance zone
- Likely to fall to support level 1.3545
USDCAD currency pair recently reversed down from the resistance zone between the resistance level 1.3770 (former support from the start of May), upper daily Bollinger Band and the 50% Fibonacci correction of the downward impulse from last October.
This resistance zone was further strengthened by the resistance trendline from the start of February.
USDCAD currency pair can be expected to fall to the next support level 1.3545, which reversed the price in the middle of June.

USDT.D is primed to fallI'd say USDT.D going to fall to at least 2.85%. That's the golden pocket of the previous uptrend.

Ethereum ETH price analysis💰 The price of CRYPTOCAP:ETH tested the strength of the bottom support and failed to consolidate above it.
This means that there will be another correction wave
🔥 Considering that #ETHETF is steadily "bying" every day, it would be a good idea for us/you to buy OKX:ETHUSDT in the range of $1850-1975 for investment portfolio before further growth.
👌 And you can also place a “bucket” with a pending order to buy #Ethereum at $1700, and maybe they will even "draw fall" the price at the moment to break all stops.
_____________________
Did you like our analysis? Leave a comment, like, and follow to get more

EUR/USD | Bullish SMC SETUP EUR/USD | 15min | Bullish SMC Setup 🚀💶
Price swept Asian session lows into a higher timeframe demand zone, followed by a strong bullish BOS (Break of Structure). We’re now anticipating a pullback into the FVG (Fair Value Gap) + LQC (liquidated candle) and demand zone for potential continuation to the upside.
The entry idea is based on:
🔹 Liquidity Grab (sell-side sweep)
🔹 BOS confirmation
🔹 FVG + Demand confluence
🔹 Expecting bullish continuation toward previous high and premium zone.
Waiting for price to tap the zone before riding the wave up! 📈
You can wait for confirmation on 5min TF after tap into POI
Let’s see if it delivers.
#SMC #EURUSD #Liquidity #SmartMoney #FXTradingClub #OrderFlow #Sam_trades_smc
