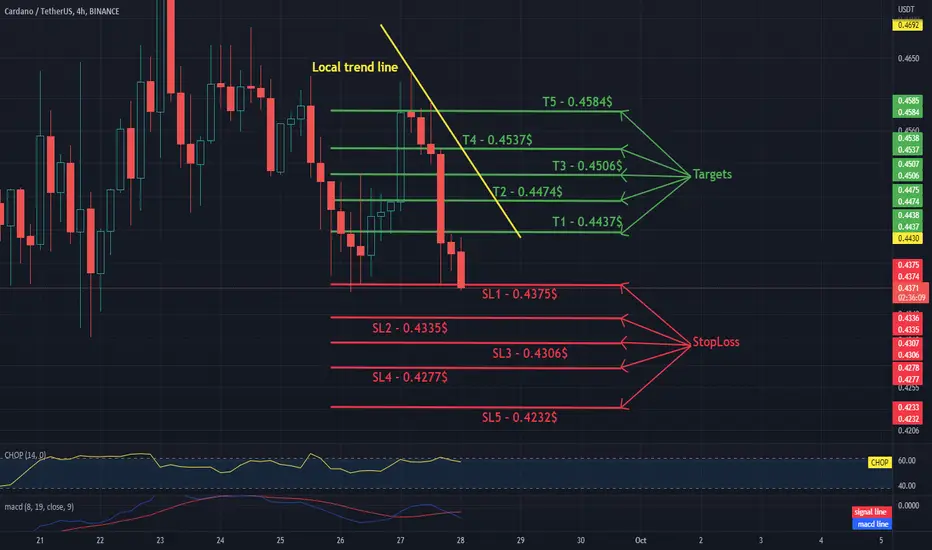
ADA/USDT TARGETS AND STOPLOSS 4HHello everyone, let's take a look at the 4H ADA to USDT chart as you can see the price is moving below the local downtrend line.
Let's start by setting goals for the near future that we can consider:
T1 - $ 0.4437
T2 - $ 0.4474
T3 - $ 0.4506
T4 - $ 0.4537
and
T5 - $ 0.4584
Now let's move on to the stop loss in case of further market declines:
SL1 - $ 0.4375
SL2 - $ 0.4335
SL3 - $ 0.4306
SL4 - $ 0.4277
and
SL5 - $ 0.4232
Looking at the CHOP indicator, we can see that in the 4H range we have a lot of energy, while the MACD indicator shows a local downward trend.
Fibonaccianalysis
Daily review of BTC interval 4HHello everyone, let's take a look at the BTC to USDT chart over the 4 hour timeframe. As you can see, the price is moving below the local uptrend line.
Let's start with the designation of the support line and as you can see the first support in the near future is $ 18,857, if the support breaks down, the next support is $ 18,632, $ 18,438 and $ 18,247.
Now let's move from the resistance line as you can see the first resistance is $ 19,219, if you can break it the next resistance will be $ 19,467, $ 19,681 and $ 19,888.
Looking at the CHOP indicator, we can see that in the 4-hour interval, the energy slowly begins to rise, and the MACD indicator shows a local downward trend.

$DOWI #US30 Watch This Level For A Possible BounceTraders and Investors,
With the dollar strength the indices have been taking a beating. US30, US500 and US100 have been following the same pattern but the leading one is still Dow Jones (US30).
So far:
1. It has crossed the 200 sma on the weekly timeframe so a bounce/retest is expected at some point.
2. There is an FCP zone coming around round number 29000 which can act as support
3. An extended M FCP pattern is forming and will complete around the FCP zone.
So watch this area closely to find a confirmation to go long for a bounce.
Please support this analysis by liking and sharing. 👍🙂
Rules:
1. Never trade too much
2. Never trade without a confirmation
3. Never rely on signals, do your own analysis and research too
✅ If you found this idea useful, hit the like button, subscribe and share it in other trading forums.
✅ Follow me for future ideas, trade set ups and the updates of this analysis
✅ Don't hesitate to share your ideas, comments, opinions and questions.
Take care and trade well
-Vik
____________________________________________________
📌 DISCLAIMER
The content on this analysis is subject to change at any time without notice, and is provided for the sole purpose of education only.
Not a financial advice or signal. Please make your own independent investment decisions.
____________________________________________________

$VIX Has Reached Another FCP Zone - W Pattern Complete #VIXTraders and Investors,
The VIX picked up a lot of strength and violated the bearish flag that was earlier forming. Now it has just completed a W pattern which means that it can take a bit of correction. An extended version of this W pattern places the price in the next FCP zone as well. So although there are chances of it falling down, a little more strength can also push it higher. So watch this carefully along with indices.
Please support this analysis by liking and sharing. 👍🙂
Rules:
1. Never trade too much
2. Never trade without a confirmation
3. Never rely on signals, do your own analysis and research too
✅ If you found this idea useful, hit the like button, subscribe and share it in other trading forums.
✅ Follow me for future ideas, trade set ups and the updates of this analysis
✅ Don't hesitate to share your ideas, comments, opinions and questions.
Take care and trade well
-Vik
____________________________________________________
📌 DISCLAIMER
The content on this analysis is subject to change at any time without notice, and is provided for the sole purpose of education only.
Not a financial advice or signal. Please make your own independent investment decisions.
____________________________________________________

Is BTC Bullish again?Ok so we broke out of the triangle to the upside not really my primary expectation. However BTC loves to do the opposite of what we are preparing for :). If this really is the bottom and we are going to move up impulsively we can already count a 1 2 pattern and 3 waves up in a wave 3 in sub waves. We still need a 4 down and 5 up! Looks like we have started wave 4. Price targets $19463 is the 50% fib would be ideal. Then we can focus on higher prices on wave 5 approximately to $20800 to 23k depending on where wave 4 finishes. If we go below the 50% fib the next support is 0.618 at $19245. If we go below this I would question if this wasn't just a C wave up before we go down impulsively in 5 waves to 17k
ARE YOU BULLISH OR BEARISH ON BTC RIGHT NOW?

$XAUUSD #Gold Can Be Bullish Next MonthTraders and investors,
Gold has been falling for straight 6 months. Now that on the monthly time frame XAUUSD has broken the mid point of potential M pattern, it can try to retest. However it all depends on how it closes this week and month. So watch it closely.
Please support this analysis by liking and sharing. 👍🙂
Rules:
1. Never trade too much
2. Never trade without a confirmation
3. Never rely on signals, do your own analysis and research too
✅ If you found this idea useful, hit the like button, subscribe and share it in other trading forums.
✅ Follow me for future ideas, trade set ups and the updates of this analysis
✅ Don't hesitate to share your ideas, comments, opinions and questions.
Take care and trade well
-Vik
____________________________________________________
📌 DISCLAIMER
The content on this analysis is subject to change at any time without notice, and is provided for the sole purpose of education only.
Not a financial advice or signal. Please make your own independent investment decisions.
____________________________________________________

Sail Cup and handle patternSail is in fibonacci 50 and 61.8% crucial zone
price is showing cup and saucer pattern in daily time frame
price is above 50 and 100 dema
we can observe good momentum aftyer brreaching 84
93.9 and 103.5 an be seen as possible hurdle on upside so can be kept as targets
78.38 -77 can be kept as sl if we take a positional trade based on risk appetite

Bitcoin D1- GOD CHARTHow I'm projecting BTC price to play with respect to Orange Ring, as well convergence with year long resistance line.
something to consider...
BTC always, ALWAYS, has bottomed on the same fib line (GOD LINE), where market peaked... 64K was the actual cycle top.

EUR/USD SHORTEvening Guys,
This is a EUR/USD breakdown.
Technically EUR/USD is bearish and has been since last year. It's only going to go further until ECB raises interest rates to tackle the surging inflation the economy is facing.
EURO/USD has made some beautiful structure on the H4 & H1 TF, you can clearly see a perfect head & shoulder pattern combined with bearish market structure and a perfectly aligned break and retest strategy.
It's unfortunate this formation has occurred at the end of the NY session because if this was to occur around 11:00-14:00 GMT we would see a huge sell off on this pair.
Personally I'm going to look to short this until market structure tells me otherwise.
Maybe price can hover around this zone before dropping even more later tomorrow.

Daily review of BTC interval 4HHello everyone, let's take a look at the BTC to USDT chart over the 4 hour timeframe. As you can see, the price moves in the triangle marked with yellow lines.
Let's start by marking the resistance line, as you can see, the first resistance is $ 19,069, if you can break it, the next resistance will be $ 19,149, $ 19,234 and $ 19,351.
Now let's move to the support line and as you can see the first support in the near future is $ 19,023, if the support breaks down, the next support is $ 19,023, $ 18,950 and $ 18,822.
Looking at the CHOP indicator, we can see that in the 4-hour interval we have a lot of energy, and the MACD indicator shows a local upward trend.

$SPY #SPX Watch This Level For A Possible BounceTraders and Investors,
With the dollar strength the indices have been taking a beating. US30, US500 and US100 have been following the same pattern but the leading one is still Dow Jones (US30).
On the SnP500 so far:
1. It has NOT touched/crossed the 200 sma on the weekly timeframe so a test and then a bounce is expected at some point.
2. There is an FCP zone coming around round number 3550 which can act as support
3. An extended M FCP pattern is forming and will complete around the FCP zone.
So watch this area closely to find a confirmation to go long for a bounce.
Please support this analysis by liking and sharing. 👍🙂
Rules:
1. Never trade too much
2. Never trade without a confirmation
3. Never rely on signals, do your own analysis and research too
✅ If you found this idea useful, hit the like button, subscribe and share it in other trading forums.
✅ Follow me for future ideas, trade set ups and the updates of this analysis
✅ Don't hesitate to share your ideas, comments, opinions and questions.
Take care and trade well
-Vik
____________________________________________________
📌 DISCLAIMER
The content on this analysis is subject to change at any time without notice, and is provided for the sole purpose of education only.
Not a financial advice or signal. Please make your own independent investment decisions.
____________________________________________________

LINKUSDT Head and Shoulders TopShort position @ peak of right shoulder from a bearish Head and Shoulders Top formation. TP1 38.2%; TP2 14.6% Fibonacci Retracement levels.

DOTThinking bottom will be put in next month at the 786% fib retracement lvl. Mainly because the 618% appears to be getting flipped into resistance. Otherwise I could count the correction complete if not for this pesky 618% resistance level
flipping into resistance. Once that confirms I will get very ugly for DOT. Also the falling triangle wedge bottom TL lines up nicely with the next level down 786% mid Nov. That said an overthrow of the wedge to test $4 in Oct would still be a valid C wave count and then up we go.

algoStill thinking bottoms in as I alerted to my group back in early Sept like XRP back did bottom at .30c but if BTC nukes we could overthrow to that cluster of
support & resistance I marketed off in my highlighted circle for a capitulation event.

Complete Dollar (DXY) Top Down Analysis =Where Is It Headed Now?Traders and Investors,
Dollar has been on a run again and it is moving towards our multi year target of 113 which we predicted nearly 2 years ago. Although it completed a W pattern and was inside an FCP zone, it did not have a substantial correction. On smaller time frames, it showed a little retaracement but that was not enough. The strength in dollar is taking it to our next multi year target of 113 zone. This zone again will have potential to push the price down or at least sow it a bit. After that we will have 116 as a new intermediate resistance followed by 127 zone.
In this DXY (Dollar) technical analysis we will study few scenarios which can help in understanding what is about to come next few days/weeks.
Please support this analysis by liking and sharing. 👍🙂
Rules:
1. Never trade too much
2. Never trade without a confirmation
3. Never rely on signals, do your own analysis and research too
✅ If you found this idea useful, hit the like button, subscribe and share it in other trading forums.
✅ Follow me for future ideas, trade set ups and the updates of this analysis
✅ Don't hesitate to share your ideas, comments, opinions and questions.
Take care and trade well
-Vik
____________________________________________________
📌 DISCLAIMER
The content on this analysis is subject to change at any time without notice, and is provided for the sole purpose of education only.
Not a financial advice or signal. Please make your own independent investment decisions.
____________________________________________________

SHIBUSDT 1-day chart review.Hello everyone, let's take a look at the 1-day SHIBUSDT chart as we can see that the SHIB price has emerged from a prolonged downtrend.
Let's start by identifying the support that the shib price has on the way and as you can see the first support is $ 0.0000011234, but if it is raised, we already have a support zone from $ 0.00000706 to $ 0.00000953.
Now we will turn our attention to the resistance that we need to overcome in order for the price to rise further. In the first place, we have a support zone from $ 0.00001246 to $ 0.00001579, the next resistance is at $ 0.5328 and then a second support zone from $ 0.00002116 to $ 0.00002507.
It is worth paying attention to the CHOP indicator, which shows that the energy is slowly starting to rise, and the MACD indicator indicates that we have entered an upward trend.

Daily review of BTC interval 1DHello everyone, let's take a look at the BTC to USDT chart on a 1 day time frame. As you can see, the price is close to exiting the current downtrend channel.
Let's start by determining the support that the price has in the event of a further correction, and as you can see, we have a support zone from $ 18,979 to $ 18,123 in front of us.
Now let's move from the resistance line, as you can see, the first resistance is $ 19,222, if you can break it, the next resistance will be $ 19,899, the third resistance at $ 20,462 and the fourth resistance at $ 21,003.
Looking at the CHOP indicator, we can see that on the 1-day interval most of the energy has been used and the MACD indicator shows that the blue line is approaching the red crossing from below, which could confirm the upward trend shift.

SOL - USDT 1HChart, targets and stoplossHello everyone, let's take a look at the 1H SOL to USDT chart as you can see the price is moving in the local downtrend channel.
Let's start by setting goals for the near future that we can consider:
T1 - $ 31.60
T2 - $ 31.86
T3 - $ 32.06
T4 - $ 32.27
and
T5 - $ 32.56
Now let's move on to the stop loss in case of further market declines:
SL1 - $ 31.35
SL2 - $ 31.04
SL3 - $ 30.79
SL4 - $ 30.54
and
SL5 - $ 30.19
Looking at the CHOP indicator, we can see that in the 1H range we have very little energy, while the MACD indicator shows a local downward trend.

Updating the SOLUSDT chart from 4H to 1D - targets and stoplossHi everyone, let's update today's SOL analysis on the 4H interval as you can see The price went up a lot and on 1D intervale we got out of the downward trend line, breaking the previously designated short targets.
Let's start by setting goals for the near future that we can consider:
T1 - $ 31.60
T2 - $ 31.86
T3 - $ 32.06
and
T4 - $ 32.27
Now let's move on to the stop loss in case of further market declines:
SL1 - $ 31.35
SL2 - $ 31.04
SL3 - $ 30.79
SL4 - $ 30.54
and
SL5 - $ 30.19
Looking at the CHOP indicator, we can see that in the 1D range we still have a lot of energy for further moves, while the MACD indicator shows that in the long term we are entering an upward trend.

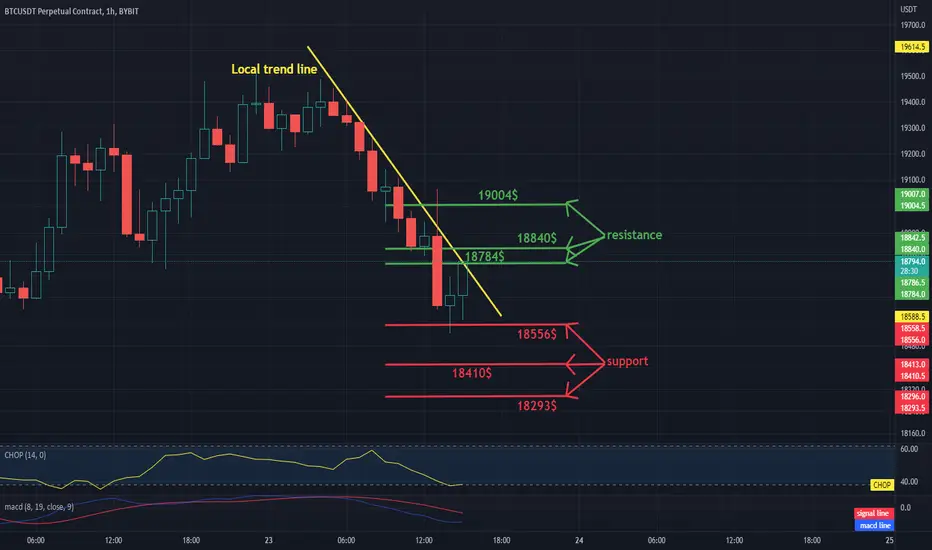
Daily review of BTC interval 4HHello everyone, let's take a look at the BTC to USDT chart over the 4 hour timeframe. As you can see, the price is moving below the local downtrend line.
Let's start with the designation of the support line and as you can see the first support in the near future is $ 18,556, if the support breaks down, the next support is $ 18,410 and $ 18,293.
Now let's move from the resistance line as you can see the first resistance is $ 18,784, if you can break it the next resistance will be $ 18,840 and $ 19,004.
Looking at the CHOP indicator, we can see that the energy has been used up in the 4-hour interval, and the MACD indicator shows a local downward trend.
Nasdaq Elliott Wave ViewOn the left is the weekly close chart of the Nasdaq (No noise, no nonsense) which clearly shows 5 waves down hitting precise Fib retracement levels. These 5 waves are the primary A wave of a Cycle wave 4. (Look at my long term view published some time ago). On the right is a daily bar chart of the recent market drop. 5 waves are clearly identifiable, indicating that we are in an intermediate B wave of the Primary B wave. There may still be a little bit of suffering before this Minute wave 5 of Minor A is over. If you are a dip buyer, this is your moment, also risk/reward is extremely high on the bullish front. More conservative traders should wait for 3 consecutive bullish days. The markets climb walls of worry and quite frankly the inflation number didn't seem so bad to me if you discount the unrealistic expectations that were rumored. Must be said though, that Bonds are signaling possible rate cuts this year and the Eurodollar yield spread says the Fed is going to make a big mistake in the third quarter.

ETH / USDT 4HChart - Targets And StopLossHello everyone, let's take a look at the 4H ETH to USDT chart as you can see the price is moving above the local downtrend channel.
Let's start by setting goals for the near future that we can consider:
T1 = $ 1,351
T2 = $ 1,368
T3 = $ 1,382
T4 = $ 1,396
and
T5 = $ 1,416
Now let's move on to the stop loss in case of further market declines:
SL1 = $ 1,304
SL2 = $ 1,284
SL3 = $ 1267
SL4 = $ 1,251
and
SL5 = $ 1,227
Looking at the CHOP indicator, we can see that in the 4H range some energy was used, while the MACD indicator shows a local upward trend.

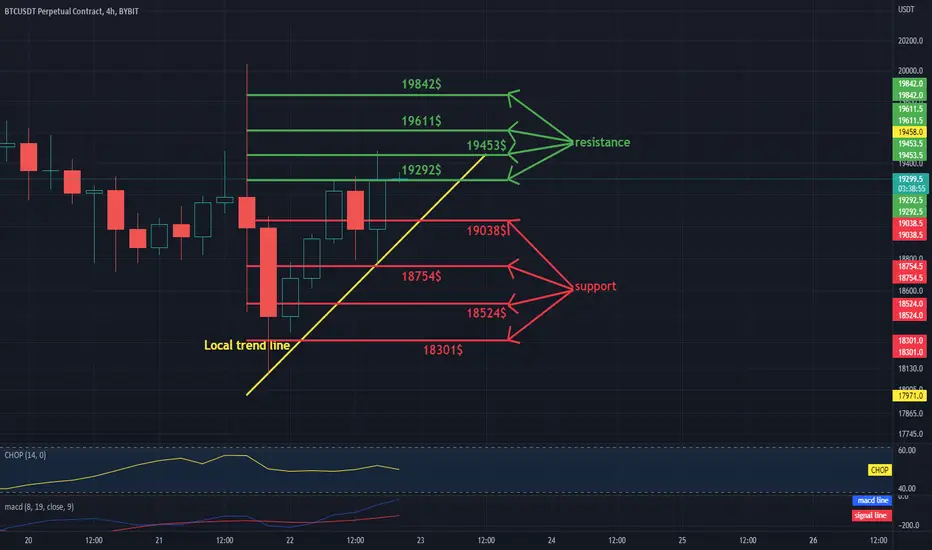
Daily review of BTC interval 4HHello everyone, let's take a look at the BTC to USDT chart over the 4 hour timeframe. As you can see, the price is moving above the local uptrend line.
Let's start with the designation of the support line and as you can see the first support in the near future is $ 19,038, if the support breaks down, the next support is $ 18,754, $ 18,524 and $ 18,301.
Now let's move on from the resistance line, as you can see, the first resistance that price is currently struggling with is $ 19,292, if you can break it, the next resistance will be $ 19,453, $ 19,611 and $ 19,842.
Looking at the CHOP indicator we can see that in the 4-hour interval some energy has been used up, but we have a little bit to continue the movement. On the other hand, the MACD indicator shows a local upward trend.