Daily review of BTC interval 1DHello everyone, let's take a look at the BTC to USDT chart on a 1 day time frame. As you can see, the price is moving below the local uptrend line.
Let's start with the designation of the support line and as you can see the first support where the price is currently at is $ 20.02, if the support breaks, the next support is $ 19,401 and $ 18,618.
Now let's move from the resistance line as you can see the first resistance is $ 21,068, if you can break it the next resistance will be $ 21,737, $ 22,223 and $ 22,738.
Looking at the CHOP indicator, we can see that on the 1-day interval, the energy slowly begins to increase, while the MACD indicator shows that despite the decline, we are in an upward trend.
Fibonaccianalysis

NDXWe have real momentum here on the NDX100. With the 3D sitting right on the 200 ema a break above that will likely confirm my count and send Tech sector (most likely crypto as well) up into higher targets on the HTF.

BTC Trend Based time fibs.Very simple idea here. I pulled a trend based time fib starting at the 2015 low. Each vertical fib marked a trend line break to date. Looking for 5/5 at the 1.618.

USDCHF BREAKS THE SUPPORTThe US Dollar experienced strong bearish momentum last week and the usdchf broke the support and settled below it.
We might get a retest of the broken support before resuming the drop.
Targets are 0.94700 and 0.93550(trendline support)

EURUSD BROKEN CHANNEL - BUYEURUSD finally broke outside the descending channel and holds above it.
We can expect bullish continuation if the price maintains stability above 0.9960.
The main targets are 1,01225 and 1.01850.

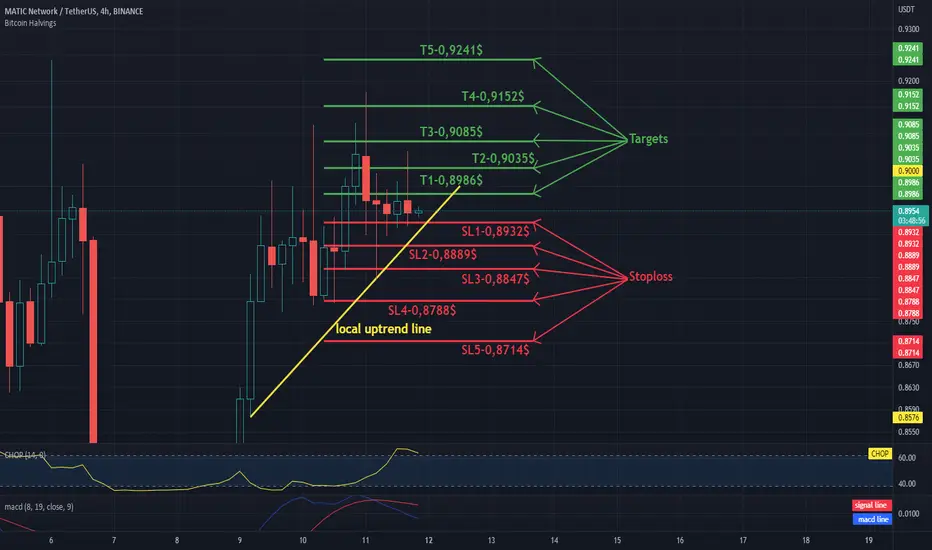
MATIC/USDT - Targets and Stoploss 4H IntervalHello everyone, let's take a look at the 4H MATIC to USDT chart as you can see the price is moving above the local uptrend line.
Let's start by setting goals for the near future that we can consider:
T1 - $ 0.8986
T2 - $ 0.9035
T3 - $ 0.9085
T4 - $ 0.9152
and
T5 - $ 0.9241
Now let's move on to the stop loss in case of further market declines:
SL1 - $ 0.8932
SL2 - $ 0.8889
SL3 - $ 0.8847
SL4 - $ 0.8788
and
SL5 - $ 0.8714
Looking at the CHOP indicator, we can see that in the 4H range we have a lot of energy for the next move, while the MACD indicator shows a local downward trend.
LUNAUSD - Targets and Stoploss Hello everyone, let's take a look at the 4H LUNA vs USD chart as you can see the price is moving in the local downtrend channel.
Let's start by setting goals for the near future that we can consider:
T1 = $ 6.04
T2 = $ 6.54
T3 = $ 6.92
T4 = $ 7.24
and
T5 = $ 7.81
Now let's move on to the stop loss in case of further market declines:
SL1 = $ 5.46
SL2 = $ 5.18
SL3 = $ 5.01
and
T5 = $ 7.81
Looking at the CHOP indicator, we can see that in the 4H range we have a lot of energy for the next move, while the MACD indicator shows a local downward trend.

Daily review of BTC interval 4HHello everyone, let's take a look at the BTC to USDT chart over the 4 hour timeframe. As you can see, price is moving above the local uptrend line.
Let's start with the designation of the support line and as you can see the first support in the near future is $ 21,602, if the support breaks down, the next support is $ 21,535, $ 21,447 and $ 21,322.
Now let's move from the resistance line as you can see the first resistance is $ 21,668, if you can break it the next resistance will be $ 21,752, $ 21,866 and $ 22,015.
Looking at the CHOP indicator, we can see that in the 4-hour interval we have a lot of energy and the MACD indicator shows a local downward trend.

OMGlooks to be in a complex double correction ABC. Using the WXY to bridge the counts we should be in the minor X wave up here before finishing lower into wave Y into Nov 2022.


ADA Long Trade with Video ExplanationThis is just a cleaned up chart from my analysis HERE.
Trade logic summary:
Cardano has been holding this ~$0.40 range for the past four months or so while making lower highs creating what appears to me to be a triangle.
Using the triangle to estimate a time horizon for this trade, I'd expect a break out in one direction or another by the end of November.
The strength of that breakout will also be telling, but we'll review that data as it comes.
The Trade
Time Frame is 2-6 months
Entry is at $0.5223
Stop-loss is approx 20% below my entry. I do not have a hard stop-order set, but I do have alerts set on the way down to that region as I am actively managing this trade.
Target is open as this is a long position, though I will likely take some profit at the $0.75 range (alerts set in that region as well)
Sizing
For this trade I used roughly 20% of my cash available to trade, which is about 12% of my trading portfolio tied up in this trade over the next few months.
Risk
With a floating stop at around 20% below my entry, loss would result in about a 4% loss of cash available to trade and about a 2.4% loss of my current portfolio balance.
Profit
If long plays out and initial target of $0.75 is reached, that would result in about a 45% gain on trade , a 9% increase of cash available to trade , and 5.4% increase of current portfolio balance .
I'll try to be sure to update this post as we move forward. If anyone follows this trade, feel free to follow up in the future.
Thanks for reading!

DOGE / USDT 4H interval reviewHello everyone, let's take a look at the 4H DOGE to USDT chart as you can see the price is moving below the local downtrend line.
Let's start by setting goals for the near future that we can consider:
T1 = $ 0.06437
T2 = $ 0.06549
T3 = $ 0.06641
T4 = $ 0.06735
and
T5 = $ 0.06858
Now let's move on to the stop loss in case of further market declines:
SL1 = $ 0.06307
SL2 = $ 0.06191
SL3 = $ 0.06097
SL4 = $ 0.06005
and
SL5 = $ 0.05870
Looking at the CHOP indicator, we see that in the 4H range the energy is slowly rising, while the MACD indicator shows an upward trend but we are close to entering the local downward trend.

DOT / USDT 4H CHART - Targets and Stoploss!Hello everyone, let's take a look at the 4H DOT to USDT chart as you can see the price is moving above the local uptrend line.
Let's start by setting goals for the near future that we can consider:
T1 = $ 7.86
T2 = $ 8.02
T3 = $ 8.16
T4 = $ 8.31
and
T5 = $ 8.51
Now let's move on to the stop loss in case of further market declines:
SL1 = $ 7.71
SL2 = $ 7.58
SL3 = $ 7.47
SL4 = $ 7.34
and
SSL5 = $ 7.19
Looking at the CHOP indicator, we can see that in the 4H range the energy slowly starts to rise, while the MACD indicator shows a local downward trend.

Daily review of BTC interval 4HHello everyone, let's take a look at the BTC to USDT chart over the 4 hour timeframe. As you can see, price is moving above the local uptrend line.
Let's start with the designation of the support line and as you can see the first support in the near future is $ 21,269, if the support breaks down, the next support is $ 21,027, $ 20,825 and $ 20,606.
Now let's move from the resistance line as you can see the first resistance is $ 21,618, if you can break it the next resistance will be $ 22,621 and $ 23,247.
Looking at the CHOP indicator, we can see that we have very little energy in the 4-hour interval, and the MACD indicator shows that we can enter a local downward trend.

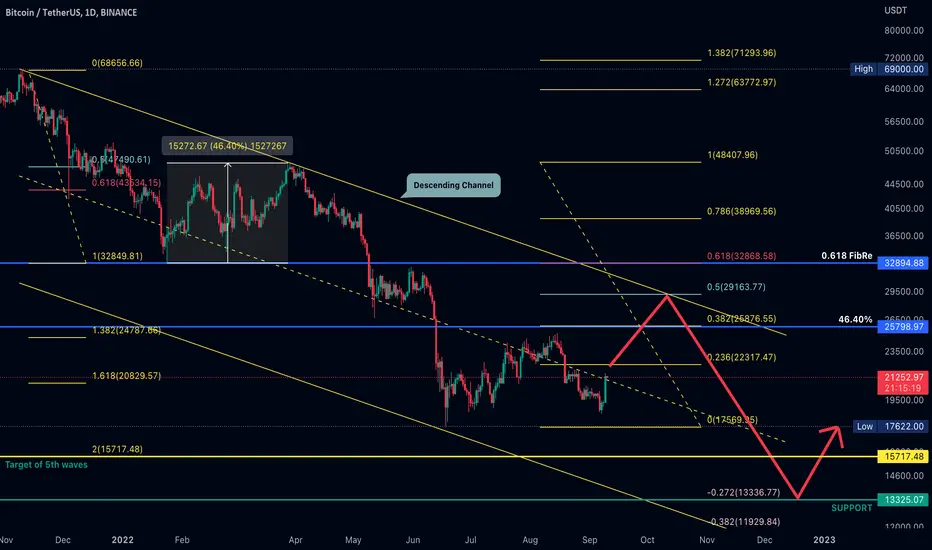
Pullback and moving down to in range 15-13KOn daily chart,
Bitcoin ( BINANCE:BTCUSDT ) still in the descending channel.
Right now, it's trading around 21200.
BTC has reached to 25200 and crashed after that. Wave A and B had completed and Wave C has been happening with target in range 29 - 33K.
If price reject at those level, that's a 4th wave. We can hope bitcoin will move down 15-13K to complete a fifth wave.
Let's wait and see
Innercircle Trading with FibsA daily chart with one major fib from the most recent extreme high down to the most recent extreme low.
We then break down the main levels further with the fibs that come in between the major levels.
The circles are there to give a visualization of how important each level is compared to the others.
The circles also go to show that it's all apart of the same set.

$BETA : A Potential 15x Gain$BETA fractals repetition suggest a big move up before a drop to its unknown demand zone.

ADA/USDT TARGETS AND STOPLOSS 4HHello everyone, let's take a look at the 4H ADA to USDT chart as you can see the price is moving above the local uptrend line.
Let's start by setting goals for the near future that we can consider:
T1 - $ 0.4975
T2 - $ 0.5083
T3 - $ 0.5232
and
T4 - $ 0.5422
Now let's move on to the stop loss in case of further market declines:
SL1 - $ 0.4828
SL2 - $ 0.4756
SL3 - $ 0.4690
SL4 - $ 0.4597
and
SL5 - $ 0.4469
Looking at the CHOP indicator, we can see that in the 4H range, energy has been used, while the MACD indicator shows a local upward trend.

Daily review of ETH interval 1DHello everyone, let's take a look at the ETH to USDT chart on a 1 day time frame. As you can see, price is moving above the local uptrend line.
Let's start with the designation of the support line and as you can see the first support in the near future is $ 1639, if the support breaks down, the next support is $ 1519 and $ 1402.
Now let's move from the resistance line as you can see the first resistance is $ 1728, if you can break it the next resistance will be $ 1800, $ 1898 and $ 2034.
Looking at the CHOP indicator, we can see that some energy has been used in the 1 day interval, but we have a lot to continue moving, and the MACD indicator shows an uptrend.

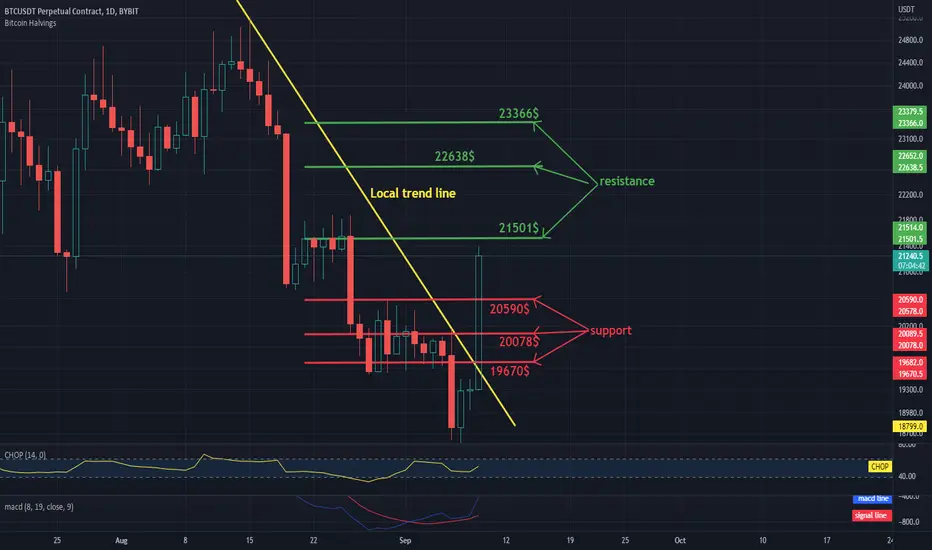
Daily review of BTC interval 1DHello everyone, let's take a look at the BTC to USDT chart over a 1 day timeframe. As you can see, the price has risen above the local downtrend line and has rebounded nicely from the recent declines.
Let's start by marking the resistance line, as you can see, the first resistance is $ 21,501, if you can break it, the next resistance will be $ 22,638 and $ 23,366.
Now let's move on to the designation of the support line and as you can see the first support in the near future is $ 20,590, if the support breaks down, the next support is $ 20078 and $ 19,670.
Looking at the CHOP indicator, we can see that on the 1-day interval, the energy begins to slowly increase, and the MACD indicator shows that we have changed the downward trend into an upward trend.
USDCAD PULLBACKThe usdcad pair rallied to hit the resistance level as initially predicted in my previous posts but couldn't hold above it.
This negative closing suggests that the price will make a pullback with the initial target at the pivot point.

OGNFalling Wedge bottom support being tested. Will this hold and send OGN back up above .30c or will OGN have 1 more capitulation back down to .13c?
Let's analyze and find out.

Daily review of ETH interval 4HHello everyone, let's take a look at the 4H ETH to USDT chart as you can see the price is moving above the local uptrend line.
Let's start by setting goals for the near future that we can consider:
T1 = $ 1,658
T2 = $ 1,678
T3 = $ 1,698
T4 = $ 1726
and
T5 = $ 1763
Now let's move on to the stop loss in case of further market declines:
SL1 = $ 1,608
SL2 = $ 1578
SL3 = $ 1,555
SL4 = $ 1532
and
SL5 = $ 1,498
Looking at the CHOP indicator, we can see that in the 4H range the energy slowly starts to rise, while the MACD indicator shows a local upward trend.
