ETHHitting The B wave here, should run out of gas soon, then back to $1,200 to finish wave C of the daily ABC which is correcting the 5 up from $900 to $2,000. After the successful retest of the C wave we should start a new cycle up to $3,000 plus.
Fibonaccianalysis

Nasdaq Elliott Wave updateWith yesterdays low my wave count has slightly changed, though nothing material. What appeared to be a wave 4 unfolding turns out to be a wave (B). If the low is in place, wave (C) of B is on it's way. I'll publish possible targets next week.

BTC PredictionThis is my BTC prediction for now, seems how things might play out.
If this doesnt exactly play out i believe that it will still be something similar as to where btc goes down a fair bit more then it is now. This is due to it seeming quite bearish along with the fact of the current economic climate.
What are you thoughts?

GTEleading diagonal target should land around .44c.
Could line up well with my WTIC target of $68 Wave 4 target posted recently.

Daily ETH to USDT review on 4H intervalHello everyone, let's take a look at the ETH to USDT chart in 4 hours. As you can see, price is moving above the local uptrend line.
Let's start with the designation of the support line and as you can see the first support in the near future is $ 1,545, if the support collapses, the next support is $ 1,520, $ 1,497 and $ 1,463.
Now let's move from the resistance line as the first resistance is $ 1,577, if you manage to break it, the next resistance will be $ 1,605, $ 1,629 and $ 1,653.
Looking at the CHOP indicator, we can see that we have a lot of energy in the 4H range, and the MACD indicator shows a local downward trend.

Elliott Wave Update NasdaqWave B well on it's way. If yesterdays low completed a wave 4 (size of 1 from top of 3) we shall complete quite rapidly the full 5 wave sequence of A of (B),fib targets on the chart. Note we shall be entering a wave 5 of 3 so expect a well defined trend to unfold in the coming weeks. Ultimate target of this wave (B) is quite likely to complete in ATH.

💡Don't miss the great Sell opportunity in XAUUSDHi Dears
The monthly and weekly trend of gold tells us that we are currently in a downward trend. In the 4-hour chart, we have a big resistance that gold has not been able to break, so we expect it to continue falling. I calculated the gold target from the monthly trend line, which of course is confirmed by the 1.13 Fibonacci area.
If you like my analysis, please support me with your likes and comments.
Don't forget to follow, friend

Daily ETH to USDT review on 4H intervalHello everyone, let's take a look at the 4H ETH to USDT chart as you can see the price is moving above the local uptrend line.
Let's start by setting goals for the near future that we can consider:
T1 - $ 1,572
T2 - $ 1609
T3 - $ 1,656
and
T4 - $ 1719
Now let's move on to the stop loss in case of further market declines:
SL1 - $ 1,549
SL2 - $ 1,506
SL3 - $ 1472
and
SL4 - $ 1,436
Looking at the CHOP indicator, we can see that in the 4H range we have a lot of energy, while the MACD indicator shows that we can enter a downward trend locally.

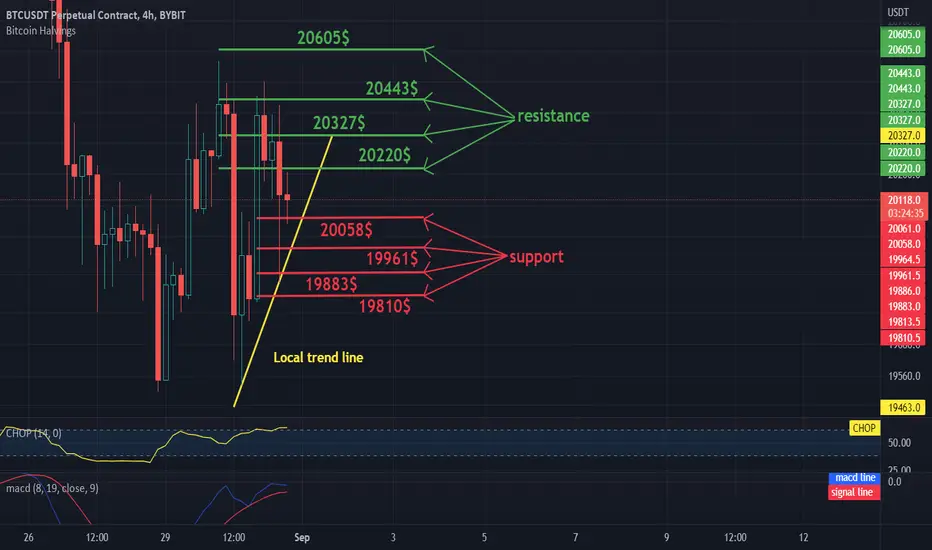
Daily BTC to USDT review on 4H intervalHello everyone, let's take a look at the BTC to USDT chart in 4 hours. As you can see, price is moving above the local uptrend line.
Let's start with the designation of the support line and as you can see, the first support in the near future is $ 20,508, if the support falls, the next support is $ 19,961, $ 19,983 and $ 19,810.
Now let's move from the resistance line as the first resistance is $ 20,220, if you manage to break it, the next resistance will be $ 20,327, $ 20,443 and $ 20,605.
Looking at the CHOP indicator, we can see that we have a lot of energy in the 4H range, and the MACD indicator shows the local upward trend.
USDCAD FURTHER GROWTHUSDCAD has maintained stability above the monthly pivot and is now heading to the resistance level.
The price might pull back towards 1.29850 before resuming the rise.

GBPAUD BUYS Price has bounced from support with bullish divergence on technical indicators.
Expect bullish price movements with an initial target of 1.7185


NDX 100Honestly thinking we are in a strong downtrend here until mid terms are over, after that I would expect we start w3 on the HTF. Leading the tech sector into the final 5th wave into 2023.

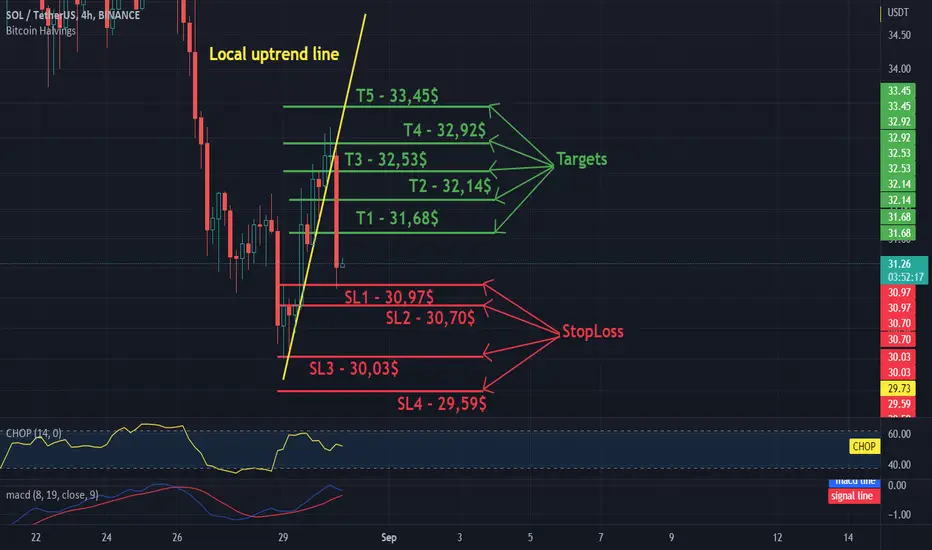
SOL/USDT on 4H interwal - Targets and StopLossHello everyone, let's take a look at the 4H SOL to USDT chart as you can see the price is moving below the local uptrend line.
Let's start by setting goals for the near future that we can consider:
T1 - $ 31.68
T2 - $ 32.14
T3 - $ 32.53
T4 - $ 32.92
and
T5 - $ 33.45
Now let's move on to the stop loss in case of further market declines:
SL1 - $ 30.97
SL2 - $ 30.70
SL3 - $ 30.03
and
SL4 - $ 29.59
Looking at the CHOP indicator, we can see that we still have a lot of energy in the 4H range, while the MACD indicator shows the local uptrend.
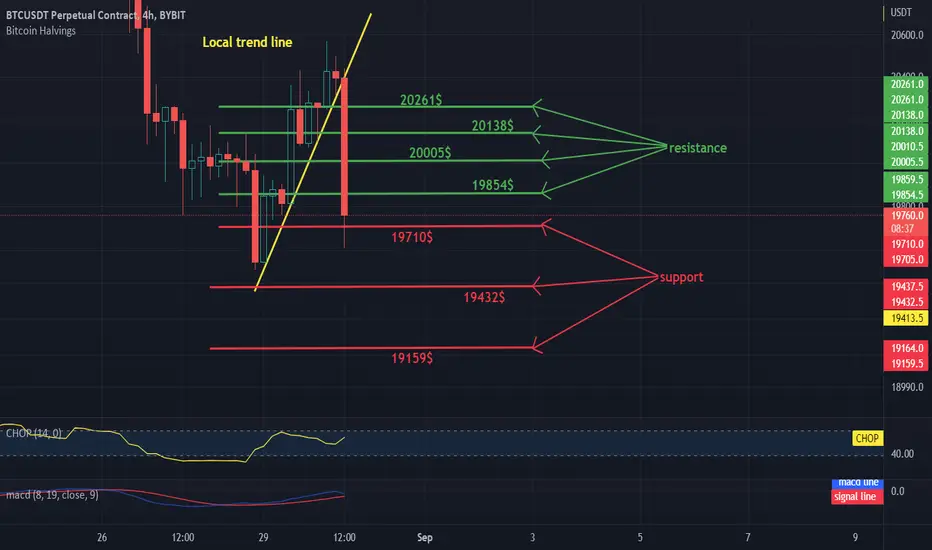
Daily BTC to USDT review on 4H intervalHello everyone, let's take a look at the BTC to USDT chart in 4 hours. As you can see, the price is moving above the local downtrend line.
Let's start with the designation of the support line and as you can see the first support in the near future is $ 19,710, if the support collapses, the next support is $ 19,432, $ 19,159.
Now let's move from the resistance line, because the first resistance is $ 19,854, if you can break it, the next resistance will be $ 2,0005, $ 20,308 and $ 20,261.
Looking at the CHOP indicator, we can see that we have a lot of energy in the 4H range, and the MACD indicator shows the local upward trend.
ETCETC appears to have broken out of the LT triangle correction, since this break out doesn't look impulsive yet I'm ruling it an ABC bearish move up which can hit $72 into Oct before another big sell off. If the C wave up leads into a786% correction of the ABC move then I'd rule that sell off as a wave 2 and the ABC would be a W1. Let's see

$WTI $USOIL Can Rise #crudeoilTraders, Intraday USOIL (WTI) has been slipping but the structure has been broker to the upside on the smaller timesframes. There is a very good confluence zone coming up soon on Crude Oil which can be a great place for long entry if the confirmation arrives. This can be a little risky trade so manage the risk. The target ultimately is the unfilled gap which left there days ago.
Rules:
1. Never trade too much
2. Never trade without a confirmation
3. Never rely on signals, do your own analysis and research too
✅ If you found this idea useful, hit the like button, subscribe and share it in other trading forums.
✅ Follow me for future ideas, trade set ups and the updates of this analysis
✅ Don't hesitate to share your ideas, comments, opinions and questions.
Take care and trade well
-Vik
____________________________________________________
📌 DISCLAIMER
The content on this analysis is subject to change at any time without notice, and is provided for the sole purpose of education only.
Not a financial advice or signal. Please make your own independent investment decisions.
____________________________________________________

BBBY The Road to $80NASDAQ:BBBY
Hello everyone ,
I'm back with BBBY madness! Just a reminder none of this is financial or sexual advice. The last time GameStop was on Reg Sho explosions happened. This is moving very fast so good luck to you all! Zooming in on the daily, from the recent downtrend we hit 0.618, 0.786, and the 1-1. We did leave two gaps to fill at around $13 and $8. I think the trend continues on and into the 23rd. There's no stopping this now. Zooming out on the daily, downtrend that we started at the start of the year starting our fibs there, we are aiming for that golden pocket retracement and an extension to the 1.618.
PT #1 35
PT #2 43
PT #3 85
If we can break 35 and 43, see you all at 85. It was also extremely NOT surprising to see that BBBY ran and so did AMC and GME. The 23rd is going to be a very volatile week.

Daily BTC to USDT review on 4H intervalHello everyone, let's take a look at charting the BTC to USDT in 4 hours. As you can see, the price is moving above the local downtrend line.
Let's start with the designation of the support line and as you can see the first support in the near future is $ 20,214, if the support collapses, the next support is $ 20095, $ 19,956 and $ 19,848.
Now let's move on from the resistance line as the first resistance is $ 20,375, if you can break it the next resistance will be $ 20,658 and $ 20,925.
Looking at the CHOP indicator, we can see that in the 4 H interval we have a lot of energy, and the MACD indicator shows a local upward trend.

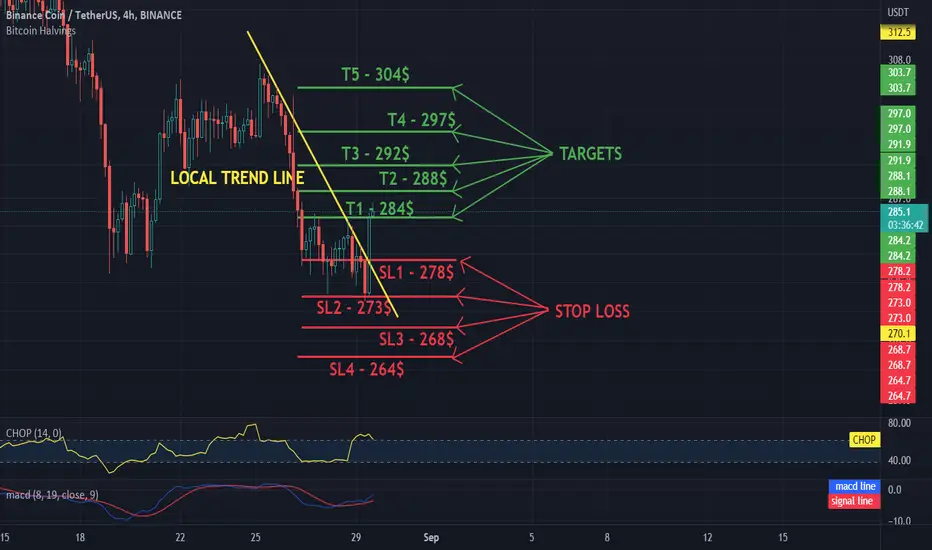
Daily BNB to USDT review on 4H intervalHello everyone, let's take a look at the 4H BNB to USDT chart as you can see the price is moving above the local downtrend line.
Let's start by setting goals for the near future that we can consider:
T1 - $ 284
T2 - $ 288
T3 - $ 292
T4 - $ 297
and
T5 - $ 304
Now let's move on to the stop loss in case of further market declines:
SL1 - $ 278
SL2 - $ 273
SL3 - $ 268
and
SL4 - $ 264
Looking at the CHOP indicator, we can see that in the 4H range we have a lot of energy, while the MACD indicator shows a local upward trend.
Daily ETH to USDT review on 4H intervalHello everyone, let's take a look at the 4H ETH to USDT chart as you can see the price is moving above the local downtrend line.
Let's start by setting goals for the near future that we can consider:
T1 - $ 1,522
T2 - $ 1,546
T3 - $ 1,578
and
T4 - $ 1,623
Now let's move on to the stop loss in case of further market declines:
SL1 - $ 1,461
SL2 - $ 1,416
and
SL3 - $ 1,382
Looking at the CHOP indicator, we can see that in the 4H interval we have a lot of energy, while the MACD indicator shows the local upward trend.

$VIX Is In The Zone, Can Take A CorrectionTraders, $VIX Is In The Zone, Can Take A Correction. Watch $DXY too with it. If these 2 fall, we are looking at some relief in indices (Dow Jones, SnP500 and NASDAQ)
Rules:
1. Never trade too much
2. Never trade without a confirmation
3. Never rely on signals, do your own analysis and research too
✅ If you found this idea useful, hit the like button, subscribe and share it in other trading forums.
✅ Follow me for future ideas, trade set ups and the updates of this analysis
✅ Don't hesitate to share your ideas, comments, opinions and questions.
Take care and trade well
-Vik
____________________________________________________
📌 DISCLAIMER
The content on this analysis is subject to change at any time without notice, and is provided for the sole purpose of education only.
Not a financial advice or signal. Please make your own independent investment decisions.
____________________________________________________

SOLUSDTPERPHi Traders,
I am waiting for LONG, The daily has Fibonachi 0.618 support.
Friends, press the "like"👍 button, write comments and share with your friends - it will be the best THANK YOU.
P.S. Personally, I open an entry if the price shows it according to my strategy.
Always do your analysis before making a trade.
