Is the correction finished?I think we are still in the possibility that this is all a triple correction and there is still a final drop according to Elliott.
And by psychological analysis, after the waves of large liquefaction, it is necessary to give an answer to the market to suspend the small fish. It is illogical for the price to flow with that nonsense to rise directly without noticing large volumes.
I have 3 possibilities to think of:
1- We will visit 18 thousand and we will go up because everyone will think that we are going down to 12 thousand, especially after the answer that the market has gained.
2- Not to stop within 18 thousand and penetrate it directly, I think because the price will not go down under 14 thousand, but the bottom cannot be expected before you saw the drop and its shape, so it remains talk.
3- This is a real bullishness and we missed the bottom. We are waiting for the end of wave 1 of the impulsive wave (I have not been able to draw any impulsive wave that supports this analysis).
Please let us know what you think and what you think
Fibonaccianalysis

[08/11] Beast Trading _ Today's Bitcoin Perspective Beast Trading _ Today's Bitcoin Perspective
Recently, if Bitcoin continues to set a short-term trend, it continues to move in that direction.
Currently, it is such a trend, but yesterday's CPI announcement showed 8.5 which is lower than the expected 8.7, resulting in a strong rise with a huge trading volume along with NASDAQ.
Looking at the overall wave, the C wave ends briefly at 22.6k, where the bottom line of the large parallel channel meets, and the adjustment of the increase from 20.7k to 24.7k has ended, and it seems that a new upward trend has begun.
So, for now, we're expecting 24.7k (high point) to break through, and we're looking forward to 26-27 lines.
As Bitcoin rises as the dominion decreases, there is a possibility that alt coin pumping will start.
The resistance hanging above is currently 24.5 to 24.6k with a downward trend from 32k, with a full-point resistance of 24.7k and a peripheral channel break of 25k.
Entering the short position will not be a good choice for profit and loss because there are not many sales stands above if it breaks the overall high point.
I hope you get good results today!

NDXZooming out, NDX looks strong, as per EW rules the 5th wave must match the 1st wave in both time and %.
That said fomo can obviously send the 5th much higher and also terminate the trend earlier.
But for now in respect to the fact that EW is not a crystal ball ,
I would say that since I am counting the 4th wave finished on the week June 13th 2022 the bulls have until July 2023 to finish the 5th wave at my projected target of 18,600.
(not accounting for any Fomo)
Also I expect a correction soon back to 12,300 or there about to make the LTF daily chart W2.

BTCUSD NEXT TARGET MAYBE "AROUND" 12,200$ ?According last post on 2022-05-06, I recount and It maybe end up with this, 69,000$ isn't B but just v, Then next correction is Zigzag (Still not finished yet)
BITSTAMP:BTCUSD
100% of A is most of Zigzag target. Main trend is still Down trend, But Bigger trend still in up!!! (Since 2010)

btcBitcoin & crypto Markets looking kinda bullish today after CPI 8.5% beats the expected 8.7% & also down from June 9.1% reading. BTC can correct to $26,500 and still be in the zig zag on h4, extending past that level would mean wave 3 not wave C. Leaning towards the C wave TBH.


CRVBuy CRV at .70c . Then sell it for $10 EOY. After that send big mike a 10% tip because I learned ya.

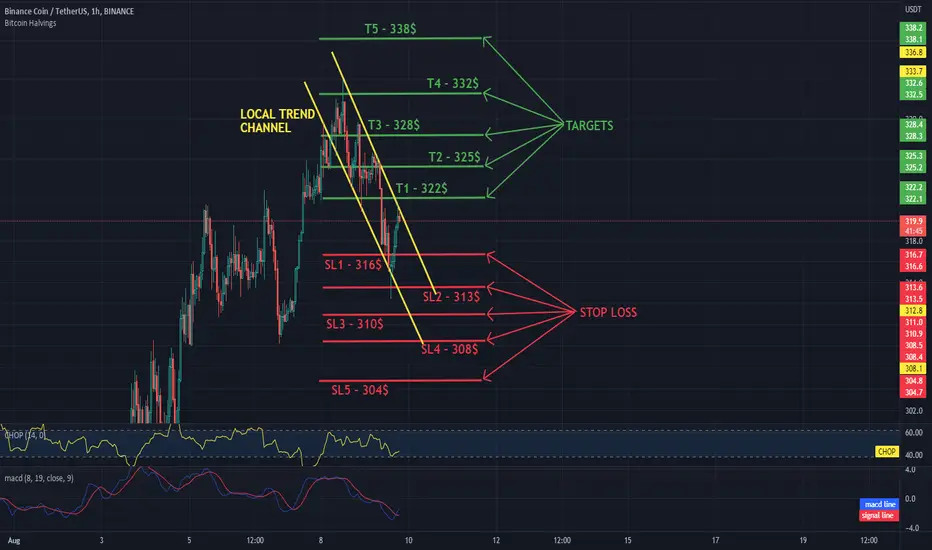
Daily BNB SHORT review 1HHello everyone, let's take a look at the 1H BNB to USDT chart as you can see the price is trying to come out of the local downtrend channel.
Let's start by setting goals for the near future that we can consider:
T1 - $ 322
T2 - $ 325
T3 - $ 328
T4 - $ 332
and
T5 - $ 338
Now let's move on to the stop loss in case of further market declines:
SL1 - $ 316
SL2 - $ 313
SL3 - $ 310
SL4 - $ 308
and
SL5 - $ 304
Looking at the CHOP indicator, we can see that in the 1H range the energy slowly starts to rise, while the MACD indicator shows a local upward trend.
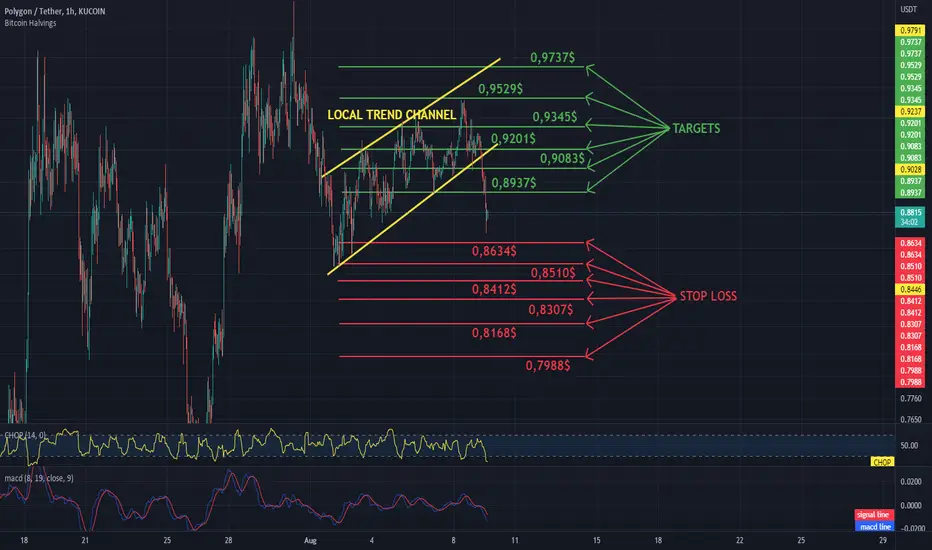
MATIC/USDT - Targets and StoplossHello everyone, let's take a look at the 1H MATIC to USDT chart as you can see the price has dropped below the local uptrend channel.
Let's start by setting goals for the near future that we can consider:
T1 = $ 0.8937
T2 = $ 0.9083
T3 = $ 0.9201
T4 = $ 0.9345
T5 = $ 0.9529
and
T6 = $ 0.9737
Now let's move on to the stop loss in case of further market declines:
SL1 = $ 0.8634
SL2 = $ 0.8510
SL3 = $ 0.8412
SL4 = $ 0.8307
SL5 = $ 0.8168
and
SL6 = $ 0.7988
Looking at the CHOP indicator, we can see that in the 1H band the energy has been used for the current price decline, and the MACD indicator confirms the local downward trend.
Daily review of BTC interval 1HHello everyone, let's take a look at the BTC to USDT chart over the 1 hour timeframe. As you can see, the price has dropped below the local uptrend line.
Let's start with the designation of the support line and as you can see the first support in the near future is $ 22,823, if the support breaks down, the next support is $ 22,615 and $ 22,451.
Now let's move from the resistance line as you can see the first resistance is $ 23,174, if you can break it the next resistance will be $ 23,375, $ 23,535, $ 23,701 and $ 23,939.
Looking at the CHOP indicator, we can see that in the 1-hour interval the energy has been used and the MACD indicator confirms the local downward trend.

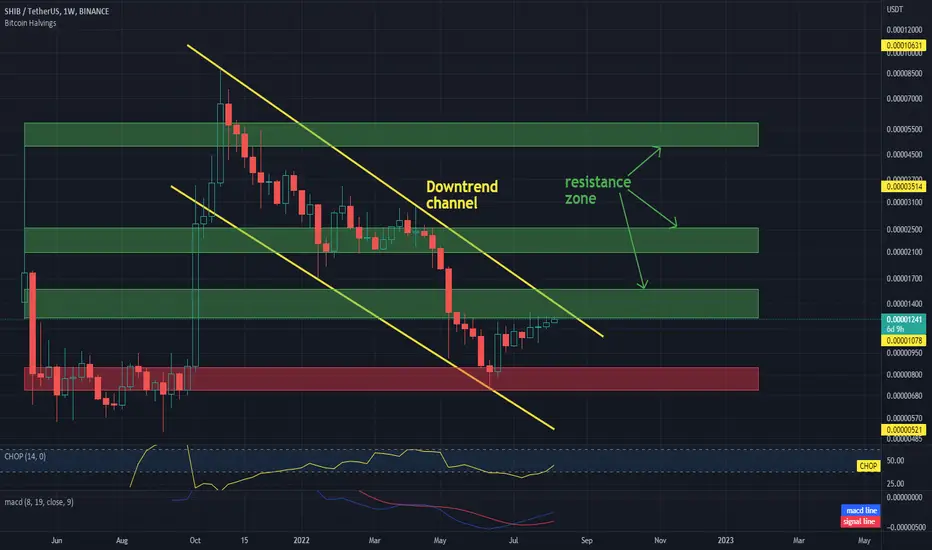
SHIB / USDT on 1Day IntervalHi everyone,
Let's take a look at the SHIBUSDT chart on the 1 day time frame.
As you can see, we are moving in the downtrend channel marked with yellow lines.
It is worth setting a support zone from which the SHIB price has rebounded, and 3 important resistance zones that the price has in front of it. We are currently fighting the first one from $ 0.00001245 to $ 0.00001567. However, it should be taken into account that in order to break the first resistance zone, we have to leave the downward channel upwards and change the trend in the long term.
The CHOP indicator shows that we are starting to gain more and more energy and the MACD indicator shows a local upward trend.
XRP at the top of the support zone!Hello, we are reviewing the XRP to USDT chart on a 1 day time frame looking at the long term.
It is worth designating two channels, the yellow lines for the uptrend channel and the blue lines for the downtrend channel in which we are currently. A price behavior that moves from the bottom to the top of the channel can be used for short-term licks.
It is worth noting that we are currently in the lower part of the channel and in the support zone. Looking at the price of XRP in the long term, it is worth setting two resistance zones that we must overcome in the future, the first is from $ 0.682 to $ 0.947, while the second is from $ 1.33 to $ 1.62.
Let us pay attention to the CHOP indicator which indicates that on the 1-day interval we are starting to regain energy, and the MACD indicator shows that the blue line has crossed the red one from the bottom, which confirms the local upward trend.

Logscale Bullish Gartley On Shiba InuWill be buying some more Shiba Inu here after have identified a Bullish gartley on the Logscale chart of Shiba Inu

BTCVideo analysis of the 4 hour price action. Looking for about $25,300 to confirm strong resistance.

TEVA - Double Bottom?TEVA has been a repair story now for many years. With litigation in the process of being resolved, debt burdens of $2 bn. per year appear manageable with cash flow - TEVA is moving away from a debt/litigation story
to an equity story. Cash Flow of $3bn + per year, Net Income of ~ 2bn.+.... warrant a blended Intrinsic Value of ~ $22 per share. TEVA's technicals show a textbook double bottom with positive divergence. Reverting to trends and fibonacci levels confirm $22 target.

DOGE / USDT 1D IntervalHello everyone, let's take a look at the 1D DOGE to USDT chart as you can see the price is moving above the local uptrend line.
Let's start by setting goals for the near future that we can consider:
T1 = $ 0.06989
T2 = $ 0.07095
T3 = $ 0.07269
and
T4 = $ 0.07477
Now let's move on to the stop loss in case of further market declines:
SL1 = $ 0.06891
SL2 = $ 0.06819
SL3 = $ 0.06747
SL4 = $ 0.06633
SL5 = $ 0.06507
and
SL6 = $ 0.06117
Looking at the CHOP indicator, we can see that in the 1-day range we have a lot of energy and the MACD indicator shows a local upward trend.

ETH collects a lot of energy on a 1-day intervalHello everyone, let's take a look at the ETH to USDT 1 day chart as we can see price movements in the upward channel denoted by the yellow lines.
It is worth designating two support zones that the price has in the event of a correction, and as you can see, the first zone is $ 1,570 to $ 1,442, but if the next zone is broken, the next zone is $ 1,224 to $ 1,070.
Now let's move on to the resistance that ETH has in front of it. In this case, we can also designate two zones, the first of which is in the range from $ 1,913 to $ 2,235, while the second is in the range of $ 2,564 - $ 3,012.
Note the CHOP indicator, which shows that we still have a lot of energy for the next price move in the 1-day range, and the MACD indicator shows that we are in a local downtrend.

Vertical areas of accumulation identified by trend-based fib timMonthly sorting time scale
Extension of Fibonacci based on the first pulse of 2010 2011
Trend-based fib time extensions based on the time elapsed between the first and second halving
It is impressive to see how reliable Fibonacci extensions based on the first bullish movement of 11 years ago are still relevant and accurate, and they have been throughout the evolution of the Bitcoin price
Vertical extensions it shows that twice in the past the zone between 0.618 and 0.786 have been areas of accumulation, we have just entered the third and if this is confirmed it will be interesting to observe this new dynamic in the future
Note that the tenkan and the SSA of the ichimoku cloud that is just beginning to form Signal a strong support at $10,000, while the cloud continues to form bullish supports until 2028, the year of the 5th halving

Daily BTCUSDT reviewHello everyone, let's take a look at the BTC to USDT chart over the 1 day timeframe as we are seeing movements in the local uptrend channel.
Let's start with the designation of the support line and as you can see the first support in the near future is $ 22,696, if the support breaks down, the next support is $ 22,243 and $ 21,520.
Now let's move from the resistance line as the first resistance is $ 23,255, if you can break it the next resistance will be $ 23,512, $ 23,796 and $ 24,212.
Looking at the CHOP indicator we can see that on the 1 day timeframe the CHOP indicator shows that we still have a lot of energy and the MACD indicator shows a downward trend in line with the price movement.

Important price points for TASI 1214 Shaker WeeklyTASI TADAWUL:1214 1214 Shaker
After target reached for 1st bearish flag and near 2nd bearish flag a divergence using RSI divergence strategy as shown on previous post.
Updated Logarithmic and Fibonacci Multiples with possible targets are indicated on the chart.
MACD and RSI points are also indicated.
Current price 20.84 is at center point of the horizontal channel.

UNFIUSDT Ranges and Value Areas to Trade TodayBYBIT:UNFIUSDT BINANCE:UNFIUSDT
UNFI has been trading in a range for the last few days and I show you where to take potential trades.
This asset can be extremely volatile, so trade with caution, but if you find yourself in a move in the right direction, a quick scalp trade could turn into a beautiful swing trade!!
Not Financial Advice. DYOR. Papertrade before trading with real money.
If you liked this idea, please give it a thumbs up and follow. Comment on how you are trading BTC right now.
Safe trading!
Shawn

$EVER Is EverQuote About to quote higher prices?Traders, Like majority of the stocks in this market cap category there is an M pattern which has been completed. This means that we now have a bullish bias on this stock. A trend line has been broken and retested successfully which means that this stock price is ready to go higher. As the overall market is taking a little recovery (upside correction so far), this can be a good opportunity however I would rate this as a speculative buy. The set up looks good from the technical analysis perspective.

Daily BTC SHORT reviewHello everyone, let's take a look at the BTC to USDT chart on a 15 minute time frame. As you can see, the price is moving in the local downward channel.
Let's start with the designation of the support line and as you can see the first support in the near future is $ 22,573, if the support breaks down, the next support is $ 22,552, $ 22,528 and $ 22,495.
Now let's move from the resistance line as you can see the first resistance is $ 22,652, if you can break it the next resistance will be $ 22,713 and $ 22,777.
Looking at the CHOP indicator, we can see that in the 15-minute interval almost all energy has been used and the MACD indicator confirms the local downward trend.
