GBPJPY BROKEN SUPPORTThe price broke the support and closed the daily candle below it indicating bearish momentum.
We can expect a retracement to the broken support (Pivot) before resuming the fall to the monthly support.
Fibonaccianalysis

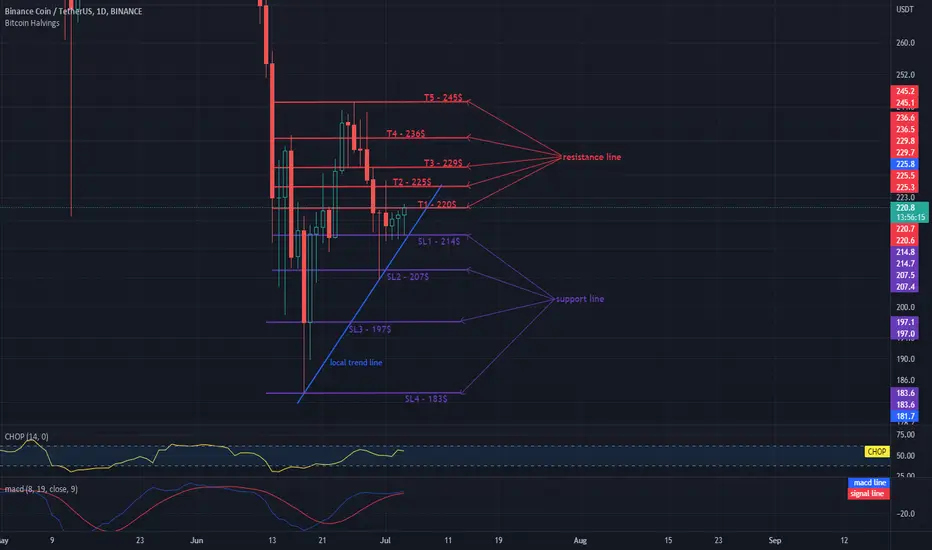
BNB / USDT 1DAYCHART TARGETS AND STOPLOSSHello everyone, let's take a look at the 1D BNB to USDT chart as you can see the price is moving above the local trendline.
Let's start by setting goals for the near future that we can consider:
T1 - $ 220
T2 - $ 225
T3 - $ 229
T4 - $ 236
and
T5 - $ 245
Now let's move on to the stop loss in case of further market declines:
SL1 - $ 214
SL2 - $ 207
SL3 - $ 197
and
SL4 - $ 183
Looking at the CHOP indicator, we can see that we have a lot of energy in the 1D range, while the MACD indicator shows a local upward trend.
BTC possible Elliot Wave ScenarioHello all my friends.
i hope you have good days and best things happen to you.
i have a possible idea about BTC moves.
in 1D chart historically we saw the first leg of correction with 5 wave ( I II II IV V )
that i mark it on my chart.
then we saw an extend B wave composed from 3 sub waves (A B C).
now we are in the third and final leg of correction i think , wave C.
we know that wave C typically have 5 sub wave.
and probbably we compelete 3 part of it.
so we can go up to 100% of sub wave 2 for introducing wave 4 (about 24000 to 25000).
after that if we dont see improvement in most countries inflation and
the SEC decision to increse interest rates we should go downward as wave 5 to about 14000 - 16000
and i think this will be happen.
after that BTC can make a bottom and after a while start a huge uptrend.
this proccess may take long time.
so be patience friends.
if you like my opinion plz like it and if you dont agree with me
share me your opinion in comments.
thank you all.
!!!NOTE!!!
MY POSTS ARE NOT TRADING AND INVESTING ADVISE
SO TRADE ON YOUR OWN STRATEGY AND CONSIDER MARKET RISKS.

Fibs, Fractals and WedgesHey there Tradingview community, thought I'd draw out what the Fibs, Fractals and Wedges tell me is to happen. As I have drawn the fractals as they have formed previously from the peak till the middle of the trend with the bearflag. The same I have drawn with the bigger wedges, the largest, falling, the one smaller connected to the right of it, rising. Thus a 50% rally is on the cards after which we have capitulation to the 11k zone. After that we will finally begin climbing to higher highs and a new ATH.

BTC DAY SHORT 4HHello everyone, let's take a look at the BTC to USDT chart over the 4 hour timeframe. As you can see, the price moves in the channel marked with the blue lines.
Let's start with the designation of the support line and as you can see the first support in the near future is $ 18551, if the support breaks down, the next support is $ 17,634.
Now let's move from the resistance line, as you can see, the first resistance is $ 19394, if you can break it, the next resistance will be $ 19,880, $ 20,264 and $ 20,643.
Looking at the CHOP indicator, we can see that we have a lot of energy in the 4-hour interval, and the MACD indicator shows a local uptrend.

A complete wave then in the correction wave On 4H TF
VANTAGE:SP500 has complete the first higher impulse wave at 3637.46 and
Right now, it's in the correction wave and might be in range 4030 - 4070, perhaps.
Besides, it's an invalidation level above 4230.
Trading in lower timeframes
What next, wait and see

DOGE/USDT TARGETS AND STOPLOSSHello everyone, let's take a look at the 4H DOGE to USDT chart as you can see the price is moving below the local uptrend line.
Let's start by setting goals for the near future that we can consider:
T1 = $ 0.06843
T2 = $ 0.07035
T3 = $ 0.07241
T4 = $ 0.07513
and
T5 = $ 0.07849
Now let's move on to the stop loss in case of further market declines:
SL1 = $ 0.06391
SL2 = $ 0.06040
SL3 = $ 0.05544
and
SL4 = $ 0.04919
Looking at the CHOP indicator, we can see that in the 4H range we have a lot of energy for the next move, while the MACD indicator shows a local upward trend.

BTC SHORT 4HHello everyone, let's take a look at the BTC to USDT chart over the 4 hour timeframe. As you can see, the price is above the local downtrend line.
Let's start with the designation of the support line and as you can see the first support in the near future is $ 19,116, if the support breaks down, the next support is $ 18,615.
Now let's move from the resistance line as you can see the first resistance is $ 19,433, if you can break it the next resistance will be $ 19,719 and $ 19,951.
Looking at the CHOP indicator, we can see that in the 4-hour interval some energy has been used, but we have some to continue the movement, and the MACD indicator shows a local uptrend.

SOL - USDT SHORT 1HHello everyone, let's take a look at the 4H SOL to USDT chart as you can see the price is moving below the local downtrend line.
Let's start by setting goals for the near future that we can consider:
T1 - $ 33.75
T2 - $ 35.49
T3 - $ 36.87
T4 - $ 38.27
and
T5 - $ 40.28
Now let's move on to the stop loss in case of further market declines:
SL1 - $ 32.71
SL2 - $ 31.01
and
SL3 - $ 28.25
Looking at the CHOP indicator, we can see that we have a lot of energy in the 4H range, and the MACD indicator shows the local upward trend.

SHIB/USDT SHORT 4HHello everyone, let's take a look at the 4H SHIB to USDT chart as you can see the price is moving below the local downtrend line.
Let's start by setting goals for the near future that we can consider:
T1 - $ 0.00001016
T2 - $ 0.00001055
T3 - $ 0.00001084
T4 - $ 0.00001116
and
T5 - $ 0.00001160
Now let's move on to the stop loss in case of further market declines:
SL1 - $ 0.00000987
SL2 - $ 0.00000964
SL3 - $ 0.00000925
SL4 - $ 0.00000904
and
SL5 - $ 0.00000820
Looking at the CHOP indicator, we can see that in the 4H range we have a lot of energy, and the MACD indicator shows a local upward trend, but the blue line is close to the red line, if it crosses it from the top, it can confirm the trend change.

BTC SHORT INTERVAL 4HHello everyone, let's take a look at the BTC to USDT chart over the 4 hour timeframe. As you can see, the price is moving below the local downtrend line.
Let's start with the designation of the support line and as you can see the first support in the near future is $ 19,121, if the support breaks down, the next support is $ 18,629.
Now let's move from the resistance line as you can see the first resistance is $ 19,443, if you can break it the next resistance will be $ 19,716, $ 19,943 and $ 20,167.
Looking at the CHOP indicator, we can see that in the 4-hour interval we are slowly starting to regain energy and the MACD indicator indicates entering the local upward trend.

BTCUSDT is creating the M patternthe price created a clear M pattern and the price retested its neckline as new resistance on 0.5 Fiboancci level.
The price created a big spike too on the supply zone.
How to approach it?
The current area is very hot for the market (20k). IF the price is going to lose the support and retest as new resistance we could see a new bearish impulse until 18-17500k area, so According to Plancton's strategy , we can set a nice order
–––––
Keep in mind.
🟣 Purple structure -> Monthly structure.
🔴 Red structure -> Weekly structure.
🔵 Blue structure -> Daily structure.
🟡 Yellow structure -> 4h structure.
–––––
Follow the Shrimp 🦐

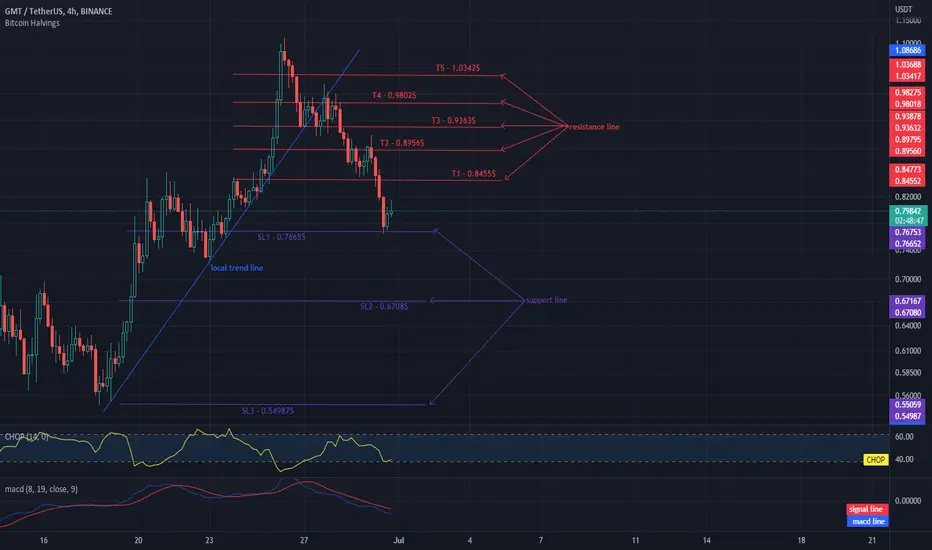
GMT - TARGETS AND STOPLOSS 4HHello everyone, let's take a look at the 4H GMT to USDT chart as you can see the price is moving below the local uptrend line.
Let's start by setting goals for the near future that we can consider:
T1 - $ 0.8455
T2 - $ 0.8956
T3 - $ 0.9363
T4 - $ 0.9802
and
T5 - $ 1.0342
Now let's move on to the stop loss in case of further market declines:
SL1 - $ 0.7665
SL2 - $ 0.6708
and
SL3 - $ 0.54987
Looking at the CHOP indicator, we can see that in the 4H range the energy is depleted and the MACD indicator shows a downward trend.
WILL BNB change its trend to an uptrend?Hello everyone, let's take a look at the 1H BNB to USDT chart as you can see the price is moving below the local uptrend line.
Let's start by setting goals for the near future that we can consider:
T1 - $ 221
T2 - $ 225
T3 - $ 228
and
T4 - $ 231
Now let's move on to the stop loss in case of further market declines:
SL1 - $ 218
and
SL2 - $ 211
Looking at the CHOP indicator, we can see that in the 1H range we have a lot of energy, and the MACD indicator shows that the trend is changing into an upward trend.

BTC SHORT 1H Hello everyone, let's take a look at the BTC to USDT chart over the 1 hour timeframe. As you can see, the price is moving below the local downtrend line.
Let's start with the designation of the support line and as you can see the first support in the near future is $ 19,770, if the support breaks down, the next one is $ 18,456.
Now let's move from the resistance line as you can see the first resistance is $ 20,336, if you can break it the next resistance will be $ 20,628, $ 20,871 and $ 21,109.
Looking at the CHOP indicator, we can see that in the 1-hour interval we have a lot of energy and the MACD indicator shows that we have entered the local upward trend.

