DOGE → Retest of the panic zone. One step away from a downtrendBINANCE:DOGEUSDT.P is facing selling pressure. After distribution (pump), the price enters a correction phase (dump) and storms the panic zone, a breakout of which could intensify an uncontrolled decline.
DOGEUSDT squandered all the potential accumulated in late April and early May. The distribution ended in the 0.2600 zone, after which the coin entered a correction phase. At the moment, the coin is testing the panic zone of 0.21400
All attention is on the base of the triangle at 0.21400. This is the panic zone. When the support breaks, buyers will be liquidated, and sellers may increase sales, which could trigger a bearish momentum.
Resistance levels: 0.222, 0.2307
Support levels: 0.2145, 0.2135
The main idea is a continuation of the decline. The trigger is a breakdown of support at 0.2135 and consolidation of the price below this zone, only in this case will the price continue to fall.
!!! The structure will be broken if the price reverses and consolidates above 0.222 and confirms the bullish sentiment with price consolidation above 0.23, in which case we will again consider growth.
Best regards, R. Linda!
Fibonacci Retracement

PEPE/USDT is Nearing an Important ResistanceHey Traders, in today's trading session we are monitoring PEPE/USDT for a selling opportunity around 0.00001330 zone, PEPE/USDT is trading in a downtrend and currently is in a correction phase in which it is approaching the trend at 0.00001330 support and resistance area.
Trade safe, Joe.

BTC/USD 4H Chart targets and stoplossHello everyone, let's look at the 4H BTC to USD chart, in this situation we can see how the price has come out of the downtrend channel on top, and the upward movement after leaving the channel is close to the height of the downtrend channel.
Let's start by defining the targets for the near future that the price has to face:
However, at the beginning we can see how the price is struggling with a strong resistance zone from $103882 to $108349. Next, we have potential targets:
T1 = 112,740 USD
T2 = 116,525 USD
Т3 = 120,000 USD
Now let's move on to stop-loss in case the market continues to fall:
SL1 = 100,551 USD
SL2 = 97,446 USD
SL3 = 92,525 USD
SL4 = 88,286 USD
The RSI indicator shows that in the 4H interval, the movement is at the upper limit of the range, which clearly affects the sideways movement on the chart.

BTC Preparing for A Move Towards $110k Are You Ready?Bitcoin Market Update: BTC Preparing for a Move Towards 109,200 and 110,000 Levels
Bitcoin (BTC) appears to be gearing up for a potential upward move targeting the 109,200 to 110,000 price range. Over the past several days, Bitcoin has been consolidating within a tight range, indicating accumulation and market indecision. However, the latest price action has shown a strong bullish breakout, confirmed by a solid bullish candle, followed by a healthy retest of the breakout zone.
This retest suggests that Bitcoin may now be preparing for its next leg upward. The current price area presents a possible buying opportunity, especially as we approach the key black-marked zones on the chart. These levels are significant because they hold pending liquidity from previous days’ highs and also correspond to notable swing highs—areas where the market previously reversed.
Traders should remain alert and not miss this potential opportunity. It's crucial to monitor the market closely for any structural shifts or additional confirmation signals, such as bullish patterns, increased volume, or momentum indicators aligning with the upward trend.
As always, conduct your own research (DYOR) before making any trading decisions. Market conditions can change rapidly, and informed decisions backed by solid analysis are essential for successful trading.

GOLD → The fight for 3,200 continuesFX:XAUUSD has recovered after a bearish distribution. The price has returned to the range but continues to test the fundamental threshold of 3200.
The fundamental background has been gradually improving recently, which is putting pressure on the gold market, increasing the profit-taking ratio and the level of sales. After the resolution of the tariff war, all attention has shifted to the negotiations between Russia and Ukraine, and de-escalation could also reduce economic risks. As well as the escalation of the conflict in the Middle East...
Technically, the price is returning to the range after a deep false breakout but is facing strong resistance and pressure from sellers. Further developments depend on the 3200 level, which is of fundamental importance.
Resistance levels: 3225, 3236, 3257
Support levels: 3204 - 3200, 3194
The battle for the 3200 area continues, with bulls likely to try to keep the price above 3200, in which case the market may test the 0.5-0.7 Fibonacci zone. However, given the recent improvement in fundamentals, the price may return from these zones of interest to 3200 with the aim of continuing the assault to break through and continue the downtrend.
Best regards, R. Linda!

GBPJPY → Return to range. Possible price decline.FX:GBPJPY is forming a local bearish trend amid a correction in the dollar. The price is returning to the range and entering strong resistance.
Amid a correction in the dollar, the Japanese yen is strengthening, putting pressure on the currency pair.
GBPJPY is returning below a strong level (within the range) and consolidating in the selling zone, which could trigger a continuation of the decline towards areas of interest. Technically, the global trend is neutral and the currency pair is forming a rebound from strong downward resistance. If the bears keep the price below 193.45 - 193.74, the local downward trend may continue.
Resistance levels: 193.45, 193.74, 194.22
Support levels: 193.04, 192.35, 191.65
Price consolidation below 193.74 - 193.45 will confirm that bears are holding the range resistance. The sell-off may continue, and in this case, the price will head towards the indicated zones of interest and liquidity.
Best regards, R. Linda!

$SOL and Most Major Alts Get Hard Rejection from 200DMAMost of your favorite Alts such as CRYPTOCAP:SOL had hard rejections from the 200DMA.
If this trend breaks into the red box we should see a retest around the .236 Fib and 50DMA ~$140
RSI also looks McDonald's toppy
Not a good time to FOMO.
PS. Normally i dont post TA this late in the night from the US but I'm gonna consider doing more if i get some decent engagement.
Lmk if you think i should post more at these midnight hours 🎃

DOGE/USDT: Key Buy Opportunity at 0.22800 Support Zone!Hey Traders, in today's trading session we are monitoring DOGE/USDT for a buying opportunity around 0.22800 zone, DOGE/USDT is trading in an uptrend and currently is in a correction phase in which it is approaching the trend at 0.22800 support and resistance area.
Trade safe, Joe.

LTC-USDT 1W chart ReviewHello everyone, let's look at the 1W LTC chart to USDT, in this situation we can see how the price approached the upper limit of the inheritance trend channel, only when it manages to get out of it, the price will be able to go further towards the inheritance trend line.
Going further, let's check the places of potential target for the price:
T1 = $ 105
T2 = $ 115
Т3 = 129 $
T4 = $ 147
Let's go to Stop-Loss now in case of further declines on the market:
SL1 = $ 97
SL2 = 80 $
SL3 = $ 63
Looking at the RSI indicator, we see
As he approached the center of the range, but we still have enough space for the price to definitely move up.

Bitcoin Potential UpsidesHey Traders, in today's trading session we are monitoring BTCUSDT for a buying opportunity around 100,000 zone, Bitcoin is trading in an uptrend and currently is in a correction phase in which it is approaching the trend at 100,000 support and resistance area.
Trade safe, Joe.

Breakout
Crossed the Valid Resistance around 159-162
Potential target is 220+
However mid resistances are there also.
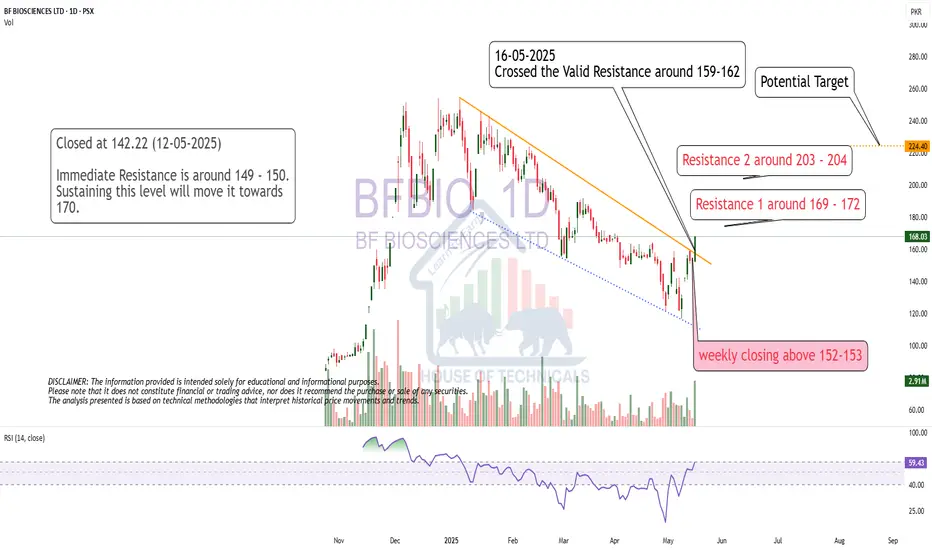
Though Bullish but..
Though Bullish but Bearish Divergence has appeared
on bigger TF.
ABCD Pattern intac but only if 155 is Crossed & Sustained
with Good Volumes.
Upside Targets can be 200+
Good Support levels are 136 - 138 and then around 123 - 125

SOL-USD 12h Chart ReviewHello everyone, let's look at the 12h SOL to USD chart, in this situation we can see how the price came out sideways from the downtrend line, then formed a downtrend channel, the exit from which gave a strong rebound creating a new uptrend.
Let's start by defining the targets for the near future that the price must face:
T1 = 172 USD
T2 = 195 USD
Т3 = 218 USD
Т4 = 252 USD
Now let's move on to the stop-loss in case the market continues to fall:
SL1 = 151 USD
SL2 = 130 USD
SL3 = 115 USD
SL4 = 96 USD
It is worth paying attention to the Stoch RSI indicator, where you can see how the current correction has strongly reacted on the indicator, which may give room for another stronger uptrend.

AUD/USD 4H | Wave 2 Pullback in MotionAUD/USD is currently completing a corrective Wave (2) within a larger impulsive structure. After the peak of Wave (1) at 0.65145, price has been in a healthy retracement phase, now nearing key fib confluence zones.
🟣 EMA Confluence:
Price is reacting near the 100 & 200 EMA (0.6373–0.6394), which has acted as dynamic support throughout this structure.
We are currently holding above the 0.382 level, with the golden zone (0.618–0.705) sitting just below.
🔄 Bullish Continuation Scenario:
If the pair holds above 0.6285 and we see bullish confirmation candles, we may begin the next leg higher — Wave (3) — targeting 0.66250–0.66766 as initial projection zones.
📊 RSI:
The RSI is hovering just below the 50 level, showing temporary bearish pressure, but has room to recover if structure holds.
🧠 Plan:
📍 Watching 0.6285–0.6214 for final support
📍 Wave (3) target zone: 0.66500+
📍 Invalidation: Clean break and close below 0.6015
🔔 Wave (2) entries are where the patient traders shine. Eyes on structure, and let price do the heavy lifting.
@WrightWayInvestments
@WrightWayInvestments
@WrightWayInvestments

LINK/USDT is Nearing The UptrendHey Traders, in today's trading session we are monitoring LINK/USDT for a buying opportunity around 15.20 zone, LINK/USDT is trading in an uptrend and currently is in a correction phase in which it is approaching the trend at 15.20 support and resistance area.
Trade safe, Joe.

HH HL still intact.
HH HL still intact.
Hidden Bullish Divergence has appeared.
We may expect the reversal only if 36 is not broken.
49-50 can be immediate targets in case of reversal.

GOLD → Correction ahead of news. Will the decline resume?FX:XAUUSD has been buying back all the losses from the Asian and Pacific sessions since the opening of the European session, but this looks more like a catapult being loaded...
GOLD broke through the global consolidation base of 3200, which only confirmed the bearish market structure. Investors are waiting for PPI and retail sales data in the US, as well as Fed Chair Powell's speech.
Expectations of fewer Fed rate cuts and optimism surrounding trade talks with China and South Korea continue to weigh on gold. However, weak macro data and a growing US budget deficit could revive interest in this safe-haven asset.
GOLD is in a correction phase and is heading towards the zone of interest: the liquidity zone and previously broken support of global consolidation.
Resistance levels: 3187-3190, 3200
Support levels: 3123, 3100
Gold may test the indicated resistance, but based on the nature of the market, this situation may end in a false breakout and a fall. Target 3123 - 3100.
However, unpredictable data may temporarily change the market, which could lead to momentum towards 3220-3230.
Best regards, R. Linda!

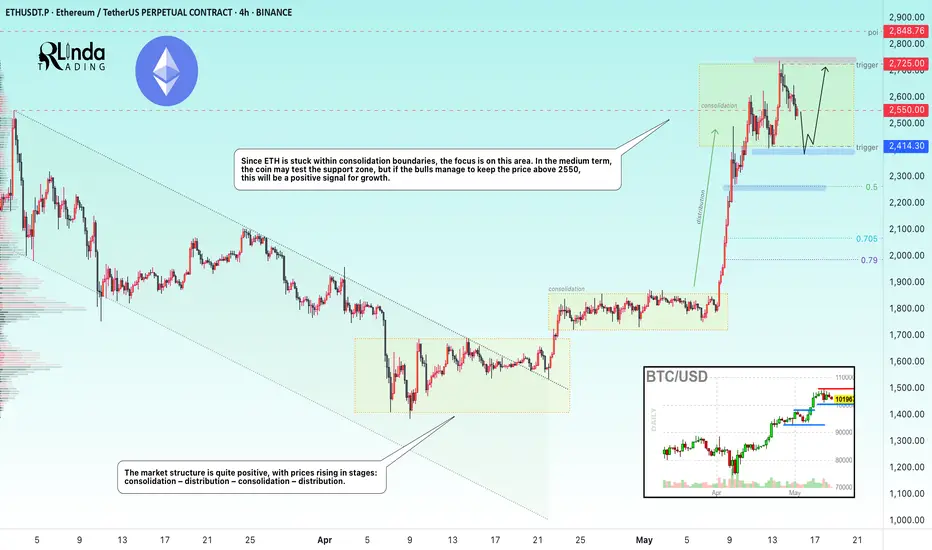
ETHEREUM → Consolidation. Which way will the distribution go?BINANCE:ETHUSDT.P has moved into a consolidation phase after the distribution phase. Focus on the 2414-2725 range. A retest of support is possible during the current phase. Despite the bullish trend, there are risks of a reversal...
ETH has been a fairly unprofitable project over the past few years, with the price hitting one bottom after another. While Bitcoin and altcoins were flying high, ETH has only shown itself to be a bull in the last few days.
In the current phase, the focus is on the consolidation boundaries, as well as the 2550 level. If the bulls keep the market above 2550, then the coin could strengthen to 2725, which would be a positive sign for us that buyers are interested in continued growth.
If ETH continues its correction towards support at 2414, then we will need to monitor the market's reaction to this level. I remain skeptical about ETH due to its weak long-term performance despite a strong fundamental backdrop.
Resistance levels: 2550, 2725
Support levels: 2414, 2260
Further movement will determine the price's exit from consolidation: a breakdown of support means a fall, a breakout of resistance means growth. But the current scenario is trading within the range. If ETH trades near 2725 and forms a pre-breakout consolidation, then we will have a chance for growth.
The opposite scenario is if the price falls below 2550 and begins to test 2414. In this case, sticking to the support level and numerous retests will indicate that the bull market has exhausted its strength and we can expect a correction to 2260-2065.
Best regards, R. Linda!
GOLD → One step away from a bullish trend reversalFX:XAUUSD is emerging from the local corrective channel “flag.” Pre-breakdown consolidation relative to the base of the reversal pattern continues. All eyes are on 3200...
Gold is losing ground amid trade optimism and a strong dollar. The price is falling at the start of Wednesday as traders take profits after a rise from weekly lows. Weaker-than-expected US inflation has not justified expectations, but the Fed's refusal to cut rates soon is weighing on the metal. Optimism surrounding new trade agreements between the US and China, the UK, and other countries, as well as hopes for peace talks between Russia and Ukraine, are reducing demand for gold as a safe-haven asset.
Technically, the overall situation looks bearish. There is no deep pullback from support, which means pressure from sellers in the market. Consolidation is forming before an attempt to break through the 3200 level.
Resistance levels: 3243, 3257, 3269
Support levels: 3222, 3200
If the price continues to consolidate in the current local range and continues to attack support at 3222-3200, then in the short and medium term, we can expect the decline to continue. However, knowing the tricks of MM, the price may form a short squeeze relative to local resistance zones before falling further.
Best regards, R. Linda!

NZDJPY → Countertrend correction and false breakoutFX:NZDJPY is testing resistance within a global downtrend. The currency pair is not yet ready to continue its growth and is forming a local reversal pattern.
Within the global downtrend, the currency pair is forming a countertrend correction and testing resistance at 87.400. The liquidity pool formed above this level is not yet ready to let the price move further. Without the possibility of continuing growth, the price returns to the range and forms a false breakout of resistance. However, since we are in the range and the price has returned inside it, if the bears hold the line (the upper limit of the trading range) at 87.400, this could trigger a further decline, thereby continuing the global downtrend.
Resistance levels: 87.400
Support levels: 86.5, 85.26
Consolidation of the price below 87.400 will confirm that the price is not yet ready to continue the trend. The falling dollar index is provoking a rise in the Japanese yen, which may also put pressure on the currency pair.
Best regards, R. Linda!

Inverse H&SBeautiful Inverse H&S pattern in place.
Sustaining 42 may lead it towards 48 & then 50 - 54.
39 - 40 can be an immediate Support.
However, breaking 36 may bring more Selling pressure.

Ripple Potential UpsidesHey Traders, in today's trading session we are monitoring XRP/USDT for a buying opportunity around 2.50 zone, XRP/USDT is trading in an uptrend and currently is in a correction phase in which it is approaching the trend at 2.50 support and resistance area.
Trade safe, Joe.

MOODENG Up 1561% — Is a 50% Crash Next?MOODENG has gone full parabolic — launching from $0.0206 to $0.34 in just 36 days. That’s a staggering +1561% gain. But after a move this vertical, it’s time to ask the real question: can it sustain this pace… or is a correction looming?
Let’s break it down.
Technical Snapshot
MOODENG just tapped a major resistance zone — the 0.786 Fibonacci retracement (log scale) of the entire bear trend from $0.70 down to $0.0206. That drawdown was a brutal -97% over 143 days, defining the last macro bear cycle. The current rally has now retraced almost 80% of that decline.
And now? It’s knocking on exhaustion’s door.
RSI Screaming Hot
The RSI on the daily chart is currently at 96 — a level rarely sustained for long. Historically, these readings lead to sharp corrections as early bulls take profit and late buyers get trapped.
Key Structure:
The key swing high at $0.31982 was just taken out, possibly as a liquidity grab.
Price is now hovering at this level — hovering… or topping?
Potential Retracement Zone
If MOODENG enters a standard corrective phase, the $0.15411 level stands out. — it lines up as a logical 50–61.8% retracement zone from the recent parabolic leg. A return to that level would mean a -50%+ crash from current highs.
Short Trade Idea (On Confirmation Only)
Entry: Break below $0.32 and retest it as resistance
Stop-Loss: Above $0.34 (structure invalidation)
Target: $0.15411 (0.618 Fib retracement)
R:R: 7:1+
This setup requires patience. Don’t front-run it — let price lose $0.32 with conviction and treat a clean retest as your trigger.
📘 Bonus Insight:
Whenever you see extreme RSI paired with major Fib levels (like 0.786), you’re likely looking at the exhaustion phase of a move — especially when paired with psychological price levels and historical resistance. That’s where smart money exits… and emotional money enters.
🧠 Educational Note: Why You Should Be Cautious with Parabolic Moves
These kinds of explosive rallies are exciting, but they’re often unsustainable. When price goes vertical and indicators like RSI hit extreme levels, smart money starts exiting — and emotional money starts chasing.
Parabolic moves often end with sharp, sudden crashes. Chasing these tops may feel tempting, but more often than not, it leads to losses. The real edge comes from waiting — for structure, confirmation, and setups with defined risk. Don’t trade hype. Trade the chart.
Summary
MOODENG up +1561% in just over a month
Tapped the 0.786 Fib of its entire macro downtrend
Daily RSI at 96 → overheated
Break & retest of $0.32 = ideal short setup
Targeting a possible -50% correction to $0.15411
Keep your emotions out of it — parabolic runs like this are exciting, but it’s discipline that gets you paid. Let price confirm. Then strike. 📉🔥
