GBPUSD → Pre-breakout consolidation. One step away from a rallyFX:GBPUSD is trading in consolidation. Against the backdrop of the falling dollar index, the currency pair is testing resistance at 1.3632 but is not yet ready to bounce down.
Against the backdrop of the dollar's decline due to fundamental reasons, the GBPUSD currency pair is strengthening. Technically, this could lead to the price breaking out of consolidation upwards. A pre-breakout base is forming relative to the upper boundary of consolidation. The price is compressing towards the level, volatility is decreasing, which in general could lead to a breakout of resistance - trigger 1.3632. The exit from consolidation may be accompanied by distribution. The liquidity zone with W1 can be considered as a target.
Resistance levels: 1.3632, 1.3743
Support levels: 1.3593, 1.3508
The global and local trends are bullish. After growth, consolidation is forming. Against the backdrop of the falling dollar, GBPUSD is testing resistance. The reaction to the false breakout of resistance is weak. The chances of a breakout are quite high.
Best regards, R. Linda!
Fibonacci Retracement

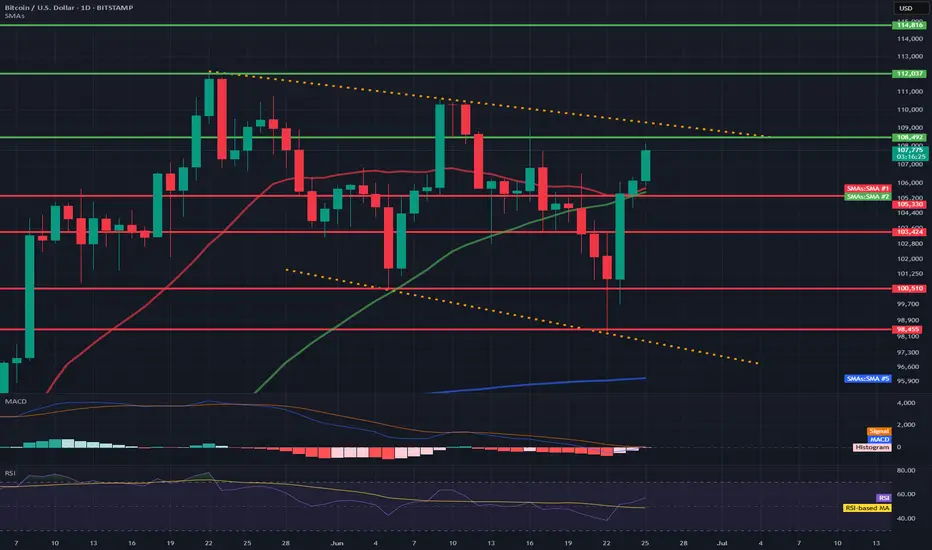
BTC/USD 1D Chart📊 1. Technical formation: Downtrend channel marked with orange lines
Upper trend line (resistance): ~108,200 – 110,000 USD
Lower trend line (support): ~98,455 – 97,000 USD
➡️ Such a formation usually ends with a breakout. The direction of the breakout will be key – currently, the price is testing the upper resistance line.
💵 2. Support and resistance levels
📈 Resistance:
108.202 – currently tested
112.037 – psychological level
114.816 – local top
📉 Support:
105.300 – SMA 50 + local support
103.424 – local lows
100.510 – key psychological support
98.455 – lower edge of the triangle
📉 3. Moving averages (SMA)
SMA 50 (green): currently as dynamic support (~105.300)
SMA 200 (blue): far below the price (~96.000), inactive in the short term
SMA 20 (red): price broke through it upwards – a signal of bullish strength
➡️ A bullish crossover took place between SMA 20 and SMA 50 → bullish signal.
📉 4. MACD (Momentum)
MACD line is approaching the intersection with the signal line from below.
The histogram is becoming less and less red → a potential intersection and a bullish crossover signal may occur any day now.
📉 5. RSI (Relative Strength Index)
Currently: 57.19
RSI is rising and approaching the overbought zone (70), but it is not overheated yet.
Exceeding 60 would be a signal of further bullish strength.
🔍 6. Volume and context
There is no volume marking on the candles, but:
The current bullish candle is strong and breaks through the key averages (SMA 20, 50).
This indicates buyer activity with technical support.
🟢 Bullish scenario (if a breakout occurs up)
A breakout above 108.200 with a close of the daily candle could open the way to:
112.037 (next resistance)
then even 114.816
🔴 Bearish scenario (false breakout)
A rejection from 108.200 and a drop below 105.300 → a possible return to:
103.424 or even 98.455 (lower triangle line)
STAR Health: Building Strength Quietly?STAR Health has shown a clear Wave (2) bottom and now appears to be in early stages of Wave (3). Price recently bounced from the 50–61.8% Fibonacci zone, retesting volume-supported levels around ₹425–₹430.
If this impulse unfolds cleanly, bullish targets lie ahead:
• Short-term: 506
• Extension: 562 (1.618 Fib)
Volume support + structure suggests institutional interest is active.
Fundamentals:
• Market Cap: ~₹25,000 Cr
• ROE: ~20%, Solvency Ratio: ~2.1x
• P/E: ~45x | P/B: ~9.2x (Premium valuation due to sector position)
• Promoter Holding: 58.28% (No pledging)
• Strong DII & FII interest, rising institutional exposure
STAR is India’s leading standalone health insurer with over 8 lakh agents, expanding presence, and structural demand tailwinds post-COVID. Long-term fundamentals support technical recovery.
Keep on radar: Break and close above 440–₹445 can ignite further momentum.
NOTE: This post is for educational purposes only not a buy/sell recommendation.

USD/CHF – Rejection at Key Fib Confluence, Bearish Continuation We’re seeing a beautiful textbook rejection off the 0.79Fib zone (0.8200), precisely where price tapped into a previous structure break and minor supply block. Price surged into the red zone, wicked just above the 200 EMA, and was instantly met with heavy sell-side pressure — a strong signal of institutional distribution.
📌 Technical Confluences at Play:
Price failed to break the 200 EMA cleanly — acting as dynamic resistance.
0.79 Fib levels aligning with prior supply.
Rising wedge structure broken to the downside.
Entry candle printing a solid engulfing rejection — institutional footprint.
📉 Target Zone:
Primary TP sits at the 0.236 Fib level (0.8101), but the full measured move of this wedge gives us a final downside target near 0.8038, with intermediate stops at key Fibs. Invalidation above 0.82294
🧠 Trader’s Insight:
“Patience is power. You don’t chase moves, you position for moments.”
Let the market come to your zone of interest, validate your thesis, and then strike with precision. The best trades come from areas where multiple confirmations stack in your favor.
📉 Trade Plan:
Entry: 0.81933 rejection zone
TP1: 0.8130
TP2: 0.8101
Final TP: 0.8038
SL: Above 0.82294 (tight invalidation)
@WrightWayInvestments
@WrightWayInvestments
@WrightWayInvestments

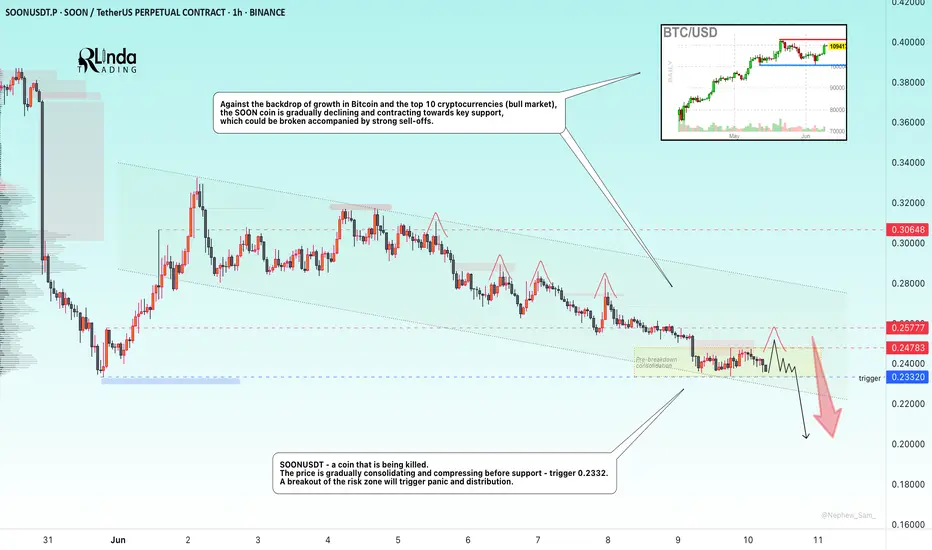
SOONUSDT → The coin that gets killed...BINANCE:SOONUSDT.P is under pressure. The coin looks extremely weak against the backdrop of a bullish market, with key support ahead, separating traders from the panic zone and a sharp decline
This coin is being killed. The price is gradually consolidating and compressing before support - the trigger is 0.2332. Against the backdrop of the overall decline that the market has experienced after a slight impulse from 0.2332, shocks are forming with the aim of capturing liquidity (red check marks). This generally indicates that large players are gathering a bearish position. A breakout of the risk zone will trigger panic and distribution.
Against the backdrop of growth in Bitcoin and the top 10 cryptocurrencies (bull market), the SOON coin is gradually declining and contracting towards key support, which could be broken accompanied by strong sell-offs.
Resistance levels: 0.2478, 0.25777
Support levels: 0.2332
If the coin continues to contract towards the 0.2332 support and form a pre-breakdown consolidation, there will be little chance of survival. In the short and medium term, I expect prices to fall.
Best regards, R. Linda!
GBPAUD → Countertrend liquidity captureFX:GBPAUD is forming a countertrend correction within a global uptrend and testing the support level with W1-D1, forming a false breakdown...
Against the backdrop of the dollar's correction, GBP/XXX pairs are strengthening. On the weekly timeframe, GBPAUD is forming a retest of support at 1.067 (false breakdown) within an upward bullish trend.
Unable to continue falling, the price returns above 1.0673 and consolidates in the buying zone. A breakdown of the structure will confirm the bullish sentiment.
Support levels: 2.0673
Resistance levels: 2.0785, 2.0852
If the bulls manage to hold their ground above the 2.067 support level within the current structure, the currency pair will have a good chance of returning to the bullish trend.
Best regards, R. Linda!

EURAUD → Breakout and consolidation above key supportOANDA:EURAUD is trying to consolidate above the key support zone of 1.76 - 1.77. Within the uptrend, bulls have a fairly good chance.
The market continues to break of structure, confirming the bullish sentiment on the chart. A correction is forming from 1.7882. Before rising, the price may test support. The currency pair is supported by its own bullish trend and the falling dollar (especially against the backdrop of economic problems with the USD (DXY)).
Technically, the currency pair looks quite positive. After the formation of another ‘bos’, we are seeing a correction to the Fibonacci zone of 0.7 and support at 1.7696. If, during the retest, the bulls manage to hold their ground above the key support level, growth may continue in the medium term.
Support levels: 1.7696, 1.7629, 1.7463
Resistance levels: 1.7882, 1.7988
Locally, a reversal pattern is forming relative to the specified zone (as part of a correction). We need to wait for confirmation (price consolidation above the level). The potential within the bullish trend is quite large, and in the medium and long term, the price may test 1.85.
Best regards, R. Linda!

GOLD → Declining interest. Retest of supportFX:XAUUSD experienced significant volatility toward the end of the US trading session. This was due to developments in the Middle East. The de-escalation of the situation is leading to a decline in interest in the metal.
The announced ceasefire between Iran and Israel has reduced demand for gold as a safe-haven asset, while falling oil prices have reduced its appeal as a hedge against inflation. Gold is supported by expectations of a Fed rate cut in July. The focus is on Fed Chair Powell's testimony before Congress and further developments in the Middle East.
Technically, the price confirms the local bearish structure. A continued assault on the 3340 support level could trigger a further decline.
Support levels: 3343-3340, 3320
Resistance levels: 3360, 3366
Focus on the trading range (consolidation) 3340 - 3400. De-escalation of the conflict in the Middle East may lead to a decline in interest in gold as a hedge asset, which may cause the price to break down of consolidation. If the retest of 3340 continues, the price will begin to contract before the level, in which case the chances of a breakdown and decline will only increase. The target will be the liquidity zone of 3320 - 3306
Best regards, R. Linda!

GBPJPY → Assault on the resistance 196.400FX:GBPJPY under the pressure of the bull market breaks through the resistance with the aim of possible continuation of growth and retest of the liquidity zone
Against the background of the dollar growth, the Japanese yen is losing value, which in general may provide support for the currency pair GBPJPY
The currency pair, after a false breakout of the key resistance and a small correction, technically, the bullish structure has not broken. The price returns to the resistance at 196.400 and breaks it. If the bulls hold their defenses above the level, we can expect a rise
Resistance levels: 196.400, 198.24
Support levels: 195.94, 195.45
Consolidation above 196.400, retest and break of 196.93 may trigger continuation of the growth. Zones of interest 198.24, 198.94
Regards R. Linda!

JINDAL STEEL: Leading Diagonal Starting?JINDAL STEEL & POWER appears to be constructing an initial impulsive advance that may very well be taking the form of a Leading Diagonal. The advance from the 770 lows has so far developed into a structure where Wave 4 has overlapped with Wave 1 territory, suggesting that a classical impulse structure may not be applicable here. Instead, the price action fits neatly within the characteristics of a leading diagonal pattern, which allows such overlaps.
Wave 1 terminated at 923.80 followed by a corrective pullback into Wave 2 at 833.60. The subsequent rise into Wave 3 reached 985.80, which completed near the 100% extension of Wave 1, supporting the diagonal scenario where extensions are often limited. This was followed by a clear a-b-c correction into Wave 4, which found support at 882.65. Notably, the c-leg of Wave 4 reached close to 1.618 times the length of Wave a, adding further symmetry to this structure.
The current advance may therefore represent Wave 5 of this diagonal, projecting towards the 1036 to 1131 region of Fibonacci extensions. However, since leading diagonals typically signal the start of a larger structure, this entire formation could well be unfolding as either the first leg of a higher degree impulse (Wave 1) or as an initial Wave A of a larger correction. The labeling is thus kept open as "1/a" to reflect both possibilities at this stage.
The invalidation level for the current bullish scenario remains at 882.65, below which this entire leading diagonal interpretation would require reassessment. Until then, the bias remains upwards as the final leg of this structure seeks completion.
Disclaimer: This analysis is for educational purposes only and does not constitute investment advice. Please do your own research (DYOR) before making any trading decisions.

A Step-by-step Guide to One of the Chart Analysis MethodHello Friends,
Welcome to RK_Chaarts,
Today we're going to learn step-by-step guide to one of the chart analysis Method by analyzing a chart of " Varun Beverages Ltd. (VBL) " to identify a trend change opportunity.(Educational Post).
Let's get started!
Applying Elliott Wave Theory
First, we can see that the bottom formed in March 2025 is likely a Wave ((4)) in Black as a bottom, marked as such on the chart. From there, Wave 5 should move upwards. Looking at the daily timeframe, we can see that price gone up in five sub-divisions of Wave (1) in Blue of Wave ((5)) in Black have completed, marked as Red 1-2-3-4-5, that means blue intermediate Wave (1) has ended, and Wave (2) has begun, which is unfolded in corrective nature marked as WXY in Red of Wave (2) in Blue.
According to the wave principle, Wave (2) should not retrace more than 100% of Wave (1), which started from the 419.65 bottom. Therefore, 419.65 becomes our invalidation level. If the price moves below this level, it would invalidate our Wave (2) principle.
Assuming our wave counts are correct, the upward movement is in the five sub-divisions, and the downward movement is in the three sub-divisions. Definitely, the conviction is increasing that we have correctly identified Waves (1) and (2). Shown in chart image below
Tweezers at Bottom
Now, we can see that Wave 2 has retraced more than 70% and has formed a Tweezer candlestick pattern at the bottom. A bearish candle was followed by a bullish candle, both with a Tweezer-like shape, with the second candle being green. This could indicate a potential reversal. Moreover, the latest candle has also taken out the high of the previous two candles, showing follow-through. The price has also shown follow-through on the upside after that. So, this can be considered as the first sign that Wave 2 might be ending, marked by a significant Tweezer pattern at the bottom with a follow-through candle. Shown in chart image below
Significant Breakout Pending Yet
Secondly, from the top where Wave 1 ended, we've been considering the decline from around 560.50 as a resistance. We drew a resistance trend line, and if the price breaks out above it, we can say that the resistance trend line has been broken, indicating a breakout above the last fall's trend line, Which is not Broken yet. Shown in chart image below
Dow Theory
The Dow Theory states that when the price moves up, it forms a Higher High, Higher Low pattern, and when it moves down, it forms a Lower High, Lower Low pattern. Somehow, the Dow Theory also needs to change, as the last swing was forming a Lower High, Lower Low pattern. The last swing high was at 479, which we marked with a green arrow. If the price crosses above it, we can say that the price is now forming a Higher High pattern. This indicates that the Dow Theory is changing from a falling trend to a rising trend. Shown in chart image below
Stop Loss
Once the Dow Theory also changes, we can use the last swing low at 446.15 as our stop loss. However, this stop loss will only be valid after the Dow Theory changes; otherwise, the invalidation level will remain at 419. Shown in chart image below
Projected Target of Wave (3)
So, friends, we've applied the Elliott Wave principle, and there's been a significant retracement, all within the valid range, without violating any rules or triggering invalidation. There's limited room left on the downside, and then we have the Tweezer candlestick pattern, which is a significant sign. We're expecting a reversal from there, and the price has followed up with an upward move.
What's left now is the breakout above the resistance trend line and a change in the Dow Theory. Once these two conditions are confirmed, all parameters will match, and we can add a position to our portfolio using the last swing low as our stop loss, instead of the invalidation level.
This is how chart analysis is done for investment purposes. We've seen many signs in our favor, and yet we still use a stop loss to prevent significant losses in case the stock or market moves unexpectedly. This is what stop loss is all about - minimizing potential losses.
We've also discussed the target projection based on Wave theory, 161.8% level, which we explained through an image. So, friends, I hope you've understood the entire conclusion and learned how to analyze charts using different methods, one of which we shared with you today.
I am not Sebi registered analyst.
My studies are for educational purpose only.
Please Consult your financial advisor before trading or investing.
I am not responsible for any kinds of your profits and your losses.
Most investors treat trading as a hobby because they have a full-time job doing something else.
However, If you treat trading like a business, it will pay you like a business.
If you treat like a hobby, hobbies don't pay, they cost you...!
Hope this post is helpful to community
Thanks
RK💕
Disclaimer and Risk Warning.
The analysis and discussion provided on in.tradingview.com is intended for educational purposes only and should not be relied upon for trading decisions. RK_Chaarts is not an investment adviser and the information provided here should not be taken as professional investment advice. Before buying or selling any investments, securities, or precious metals, it is recommended that you conduct your own due diligence. RK_Chaarts does not share in your profits and will not take responsibility for any losses you may incur. So Please Consult your financial advisor before trading or investing.

Oil Price: Breakout or Fakeout? Watch This Zone Closely Technical Overview:
The current price action is testing the upper boundary of a descending wedge, a bullish reversal pattern. The recent strong green candle indicates a potential breakout attempt, yet price is hovering near a critical resistance level at $74.20 (Fib 0.5).
Key levels from the Fibonacci retracement are:
🔼 Resistance at $74.20 (0.5), then $78.16 (0.618)
🧲 Local support at $69.78 (0.382)
🛡️ Strong demand zone near $63.81 (0.236) if rejection occurs
Structure + Patterns:
Price has been compressing inside a falling wedge, which statistically resolves to the upside.
The breakout candle broke above the 20 EMA and touched the upper wedge resistance — signaling a decision point.
Volume is rising on bullish candles — initial confirmation of buyer interest, but not yet decisive.
Scenarios to Watch
Bullish Case:
Break and close above $74.20 on higher volume → likely move toward $78–$86 resistance zone.
Confirmation of wedge breakout could trigger trend reversal, aligning with bullish fib levels.
Momentum could accelerate if macro factors support demand (see geopolitics below).
Bearish Case:
Failure to close above $74.20 = fakeout risk → price may reject down to $69.78 or even retest $63.81.
Bearish rejection wick on the daily/4H would be an early signal.
Macro & Geopolitical Factors to Monitor:
Middle East Tensions: Any escalation (especially around Iran or shipping lanes) could spike oil due to supply fears.
US Strategic Reserves & Elections: Moves to refill reserves or control inflation could support demand.
China Demand Recovery: Data showing improved industrial output or stimulus from PBoC may strengthen global oil outlook.
Final Thoughts:
Price is at a pivot zone — breaking this wedge with strength could shift the short-to-midterm trend. Until then, this remains a "show me" breakout . Watch how the next 1–2 weekly candles close around the $74–$75 area to confirm direction.

ETHEREUM → Rally and liquidity capture. Up or down?BINANCE:ETHUSDT.P is strengthening following Bitcoin. This is a reaction to developments in the Middle East, namely Trump's comments on peace. But there are doubts...
The crypto market is reacting to the situation in the Middle East, namely Trump's statements about peace. But apart from him, no one else is talking about peace. No agreements have been reached, so the level of risk is quite high.
Another nuance hinting at the general mood in the market: 66% of the largest traders on Hyperliquid are currently shorting crypto — Cointelegraph
ETH, technically, has stopped in the trend resistance zone as part of a local rally in the Pacific session.
If there is not enough potential to break through the trend resistance and the price forms a false breakout of 2390, the local trend may continue
Resistance levels: 2433, 2475
Support levels: 2390, 2313
The inability to continue growth will confirm the fact of bearish pressure (market distrust of the bullish momentum). The past momentum, in hindsight, can be considered manipulation (liquidity capture). Consolidation below 2390 may trigger a decline.
Best regards, R. Linda!

$SOL Local Bottom FormingCRYPTOCAP:SOL closed the day back within the POI.
RSI oversold.
Should see a retest ~$136 to confirm the local bottom.

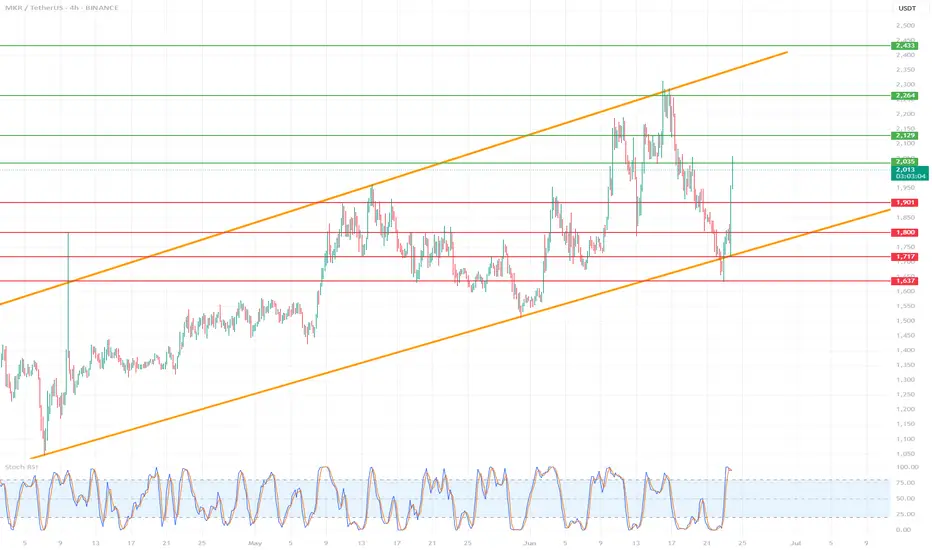
MKR/USDT (MakerDAO) on the 4H time frame🔷 1. Trend and market structure
🔸 Upward channel:
The price is moving in a wide, ascending channel (orange lines).
The lower line of the channel was last tested on June 22, 2025, which ended with a dynamic upward bounce.
The upper limit of the channel reaches around 2,450 USDT.
🕸️ Market phase:
In the short term, the market was in a downward correction phase within the uptrend.
Currently, we see a strong rebound from support - a new uptrend is possible.
🔷 2. Key horizontal levels (support/resistance)
🟥 Support:
1,637 USDT - local support (the lowest level of the red zone), almost tested at the bottom.
1,717 USDT - very technical support, tested several times.
1,800 USDT – psychological level and local consolidation.
1,901 USDT – last support peak, currently broken upwards.
🟩 Resistances:
2,003 USDT – current price level, currently tested as new resistance.
2,129 USDT – strong resistance from previous peaks.
2,264 USDT – previous swing high.
2,433 USDT – upper boundary of the channel and technical level from historical peaks.
🔷 3. Price and candle behavior
Strong demand reaction at the lower boundary of the channel: long pin bar/bull's embrace at the lower boundary.
The upward movement was dynamic and uniform, which indicates high buyer activity.
If the price stays above 1,901 USDT – further increases are possible.
🔷 4. Technical indicators
🔁 Stochastic RSI (4H):
Currently in the overbought zone, just below the level of 100 - a temporary correction or consolidation may occur.
However, with a strong upward trend, Stoch RSI may "stick" to the upper band - it does not yet give a clear S/S signal.
🔷 5. Technical scenarios
🟢 Bullish scenario (continuation of growth):
Condition: maintaining the level above 1,901 USDT.
Targets:
TP1: 2,129 USDT
TP2: 2,264 USDT
TP3: 2,433 USDT (upper limit of the channel)
Stop-loss: below 1,800 USDT
🔴 Bearish scenario (rejection of resistance):
Condition: strong rejection of 2,003 USDT and return below 1,901
Targets:
TP1: 1,800 USDT
TP2: 1,717 USDT
TP3: 1,637 USDT
SL: return above 2,003 USDT
🔷 6. Final remarks
The current upward movement looks like a "V-shape reversal" reaction - a sharp turnaround with dynamic volume suggests strong buyer interest.
The key will be the reaction to 2,003 USDT - a breakout and retest can give a very good long entry.
Short positions are risky as long as the price is in the lower half of the ascending channel.
GOLD → Risk zone 3340. Sell-off after rallyFX:XAUUSD , after breaking out of its accumulation phase, rallied towards the 3400 zone of interest, but failed to reach liquidity and reversed, selling off its gains due to economic uncertainty.
In my opinion, the market is unexpectedly subdued and has reacted very weakly to geopolitical problems in the Middle East. The market has digested the news of US airstrikes on Iranian nuclear facilities and is awaiting PMI data from the US and the eurozone, Fed statements, US GDP and other macroeconomic data. The uncertainty factor has done its job... Participants fear further escalation of the conflict, but so far Iran has refrained from taking drastic steps, which has reduced demand for gold as a safe haven asset. Geopolitics and macro statistics remain in focus.
Technically, gold is trading above 3340 (in the buy zone). A retest of the liquidity zone is possible, and if buyers keep the market above 3340-3350, the price may continue to rise.
Support levels: 3347, 3342, 3320
Resistance levels: 3366, 3396
On D1, the key level is the 3340-3347 area. At the moment, we are seeing a sell-off and a move to retest support. Accordingly, a false breakdown and price holding above 3340, followed by a change in character and a breakdown of the bullish structure, will hint at growth. But if the reaction at 3340 is weak and the market continues to storm this support, then in this case, the metal could drop to 3300
Best regards, R. Linda!

$BTC Heading to the Long-Awaited 200DMA Retest ~$96kFULFILL THY PROPHECY 📖
CRYPTOCAP:BTC making its way down to the long-awaited 200DMA retest, which just so happens to show confluence with the .618 Fib level at $96k.
RSI shows a bit more room to the downside as well.
Make sure to get those bids in!

BTC Loses Key Level — Will 100K Hold or Fold?Bitcoin has been locked in a range for the past 45 days, clinging above the critical psychological support at $100K. But cracks are starting to show…
Every bounce from the key level at $102,430 has been weakening — and now, for the first time, we’re breaking cleanly below it. Things are starting to tilt bearish.
So the question is…
⛏️ Will 100K be tested next?
🔍 Key Support Zone: $97.7K–$96.9K
Using the Fibonacci retracement from the swing low at $74.5K to the recent ATH, the 0.382 retracement lands at $97,655 — just below the $100K mark.
But there’s more…
Here’s why the zone between $97.7K and $96.9K is crucial:
0.382 Fibonacci retracement: A common pullback level in strong uptrends.
Anchored VWAP from $74.5K: Currently sitting around $96.9K, tracking cumulative volume-weighted average price — a key level.
Daily Order Block: Sits right at $96,887, aligning with the VWAP and reinforcing the area as demand-rich.
1.272 Fibonacci extension: From the previous move — providing another layer of confluence.
Fair Value Gap (FVG): The imbalance lies right in this zone. Price often fills these before continuing trend.
All of this stacks up to a high-probability long setup.
🕵️♂️ What to Do Now?
Set alerts at $100K and watch for a reaction. If price slices through, shift focus to the 0.382 Fib — monitor price action closely for signs of a reversal.
The first clean test of this zone could present a solid long — but as usual don’t trade blindly. Wait for confirmation.
_________________________________
💬 If you found this helpful, drop a like and comment!
Want breakdowns of other charts? Leave your requests below.

#Ethereum Update!!CRYPTOCAP:ETH has broken below the $2,308 resistance zone and is now trading lower.
Price is approaching a key demand area around $2,132–$2,000, where we’ve seen strong buyer reactions in the past.
IMO, if bulls step up and defend this zone, we could see a recovery bounce aiming for $2,526, the next major resistance ahead.
I’ll keep you updated as things develop.
If you find my updates helpful, don’t forget to like and follow for more! DYOR, NFA

BITCOIN → Possibility of retesting 100K. Buyer weakeningBINANCE:BTCUSDT.P is in consolidation after the rally stalled due to the exhaustion of the bullish driver. The price updates local lows and starts looking at 100K
Bitcoin is under pressure after the escalation of conflict in the middle east and after the FOMC speech. There is also another observation: large companies, politicians, funds and investors have long and aggressively motivate the crowd to buy, verbally confirming that they bought dozens and hundreds of bitcoins at a time for the balance, but bitcoin is standing still and updating lows. At the same time, various services such as "cryptorank" fix bullish sentiment at the lows. The market either lacks liquidity or something more unpredictable is happening (chart drawing????)
Technically, bitcoin is following the behavior of the SP500 quite strongly, which closes Friday's session quite weak and close to key support, which could trigger a continuation of the decline. Bitcoin won't stay on the sidelines and could also follow the index....
Resistance levels: 104K, 105K, 106K
Support levels: 102K, 100.6K, 97.5K
The price is coming out of the “symmetrical triangle” consolidation breaking the support, thus confirming the bearish mood. After a small correction after a false breakdown of 102500 the price may again return to storm (retest) the level under market pressure, which will only strengthen expectations of further decline. The target is liquidity 100600 - 100K. From 100K rebound and growth is possible.
Regards R. Linda!

BTC/USD (4-hour interval)📈 BTC/USD
🕒 Interval: 4H
1. General trend
We are observing a medium-term downtrend.
Since June 10 (middle vertical line), the price has been systematically creating lower highs and lower lows.
Current price: approx. USD 102.625.
2. Formation and Price Action
🔻 Left side of the chart (May 20 - June 10):
Volatility, no clear direction, but local highs are formed in the area of USD 111,000 - 112,500.
Consolidation from May 27 to June 2.
🔻 Right side of the chart (after June 10):
A clear breakout from the consolidation downwards.
A potential correction or continuation of the downward movement is currently forming.
The last candles suggest a strong downward impulse, and the current candle has a long lower shadow – a possible demand reaction.
3. Technical levels
📉 Resistance:
$112,400 – local peak from June 10.
$109,000 – $109,500 – area of previous consolidations.
$107,000 – lower limit of previous support.
📈 Support:
$102,000 – currently tested level.
$100,000 – psychological support level.
$97,000 – potential range of further declines.
4. Stochastic RSI (oscillator at the bottom of the chart)
The indicator currently shows the intersection of the %K and %D lines in the oversold zone.
This may suggest a short-term upward rebound – but in the context of a downtrend, this may just be a correction.
5. Candles and price action
The last candle has a long lower shadow and a close close to the maximum – this may indicate buyer pressure in this zone.
No confirmation of a reversal – only the closing of a bullish candle and a breakout above USD 103,500–104,000 may give a signal of a larger rebound.
6. Scenarios
✅ Bullish scenario (short-term):
Rebound from the USD 102,000 zone.
Test of USD 103,500–104,000 (local resistance).
If broken – a move towards USD 107,000 is possible.
❌ Bearish scenario (continuation):
Breakout of support at USD 102,000.
Movement towards the psychological level of 100,000 USD.
Possible escalation of declines on increased volume.
7. Signals to watch
Price behavior in the area of 102k USD - a key place to react.
Volume indicators (not visible here) could confirm the direction of the movement.
Will stochastic RSI give a full buy signal? (%K line above %D, both coming out of the oversold zone).

HYPE/USDT Technical Analysis (4H Chart)🔍 HYPE/USDT Technical Analysis (4H Chart)
High Time Frame (Daily): Bullish
Despite recent pullbacks, the overall trend remains bullish on the daily timeframe. However, current price action suggests a potential fakeout or legitimate breakdown, as we test key structural and volume-based supports.
Short-Term Time Frame (4H): Bearish
The 4-hour chart displays clear bearish pressure, confirmed by the Three Black Crows candlestick pattern. This signals sustained selling interest and supports the current downward move.
🧱 Key Zones
Supply Zone: $41.7 – $45.9
Strong resistance marked by prior selling pressure and overlapping FVGs.
Demand Zone: $24.4 – $26.3
Historical area of buying support, aligned with a low-volume node and an unfilled FVG.
📏 Fair Value Gaps (FVGs)
Above Price:
Four 4H FVGs act as upside inefficiencies, offering targets in a bullish recovery:
~$34.9
~$36.6
~$37.8
~$40.0 (psychological level & POC cluster)
Below Price:
One major 4H FVG remains unfilled, directly above the demand zone.
📐 Fibonacci Analysis
Price is testing the Golden Pocket (0.618–0.65) from the recent swing low to high.
A clean break below this area (with confirmation) targets the unfilled FVG around $30, and potentially the demand zone ($24.4–$26.3).
📉 Volume Profile Insight
Volume is clustered around $34–$37, indicating strong past market participation.
Very low volume between $29–$30, creating a volume void — if price loses support at the FVG and golden pocket, it could rapidly drop into the demand zone.
🔻 OBV Analysis (Volume Momentum)
OBV has broken below a larger rising wedge, confirming bearish divergence.
A falling wedge is now forming within OBV.
Break below this wedge: Confirms further price breakdown.
Reclaim of the larger wedge trendline: Suggests potential bullish reversal.
✅ Trade Scenarios
🔺 Bullish Scenario
Trigger: Bullish reversal pattern at the golden pocket (e.g., double bottom, falling wedge, inverse H&S) + OBV recovery.
Entry: Upon confirmation around $32.5.
Targets:
$34.9 (FVG)
$36.6 (FVG)
$37.8 (FVG)
$40.0 (psychological)
Stop: Below $30 or recent swing low (tight below FVG).
🔻 Bearish Scenario
Trigger : Confirmed breakdown of golden pocket & 4H FVG with OBV falling wedge breakdown.
Entry : Below $32.5 with confirmation (e.g., retest or strong momentum candle).
Targets:
$30.0 (psychological level)
$28.5 (FVG zone)
$26.3 → $24.4 (Demand zone)
Stop : Above golden pocket resistance (~$33.8–$34.2).
📝 Conclusion: The market is at a pivotal point. A confirmed break below $32.5 could accelerate selling due to the volume gap, while a strong bullish reaction from the golden pocket could drive a recovery toward $40. Always wait for confirmation before entering either scenario.

Looking deeper in the consolidation zone of $BTC 4hr Wanted to show how I use fibs and how I use them to approach entry and exit points while in consolidation.
