NEAR the Bottom? - The Crash Ends HereBack in October 2023, NEAR embarked on an incredible bull run lasting 147 days, surging from a low of $0.971 to a high of $9.01—an astounding +828% gain. Following this euphoric phase, the market sentiment shifted dramatically. Over the subsequent 392 days, NEAR retraced to around $2, marking a -78% decline. Now, with the market at a critical juncture, the question remains: when does the madness of the crash end, and can we finally see a reversal?
Harmonic Patterns & Fibonacci Confluence
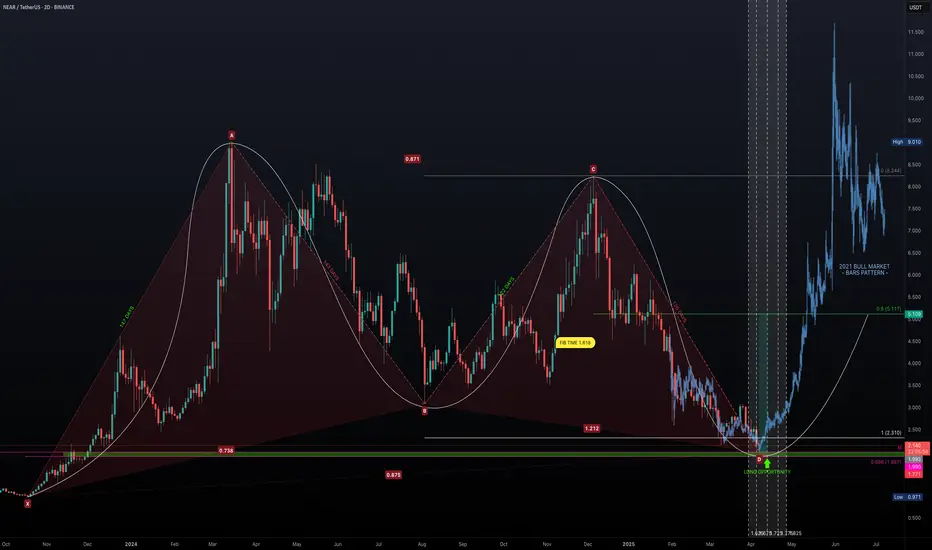
Chart Pattern Analysis: The XABCD Framework
Using the XABCD pattern tool, we identify the following key points:
Point X: $0.971
Point A: $9.01
Point B: $3.076
Point C: $8.244
Point D: $1.978
Durations:
X-A: 147 Days
A-B: 143 Days
B-C: 122 Days
C-D: 126 Days
These durations show remarkable symmetry—with the up-move phases (X-A and A-B) nearly matching in time, and similarly for the correction phases (B-C and C-D). This time symmetry supports the presence of a harmonic structure, and the retracement levels help validate the potential for a reversal.
Fibonacci Implications
Fib Retracement of XA: Point B is at 0.738
Fib Retracement of AB: Point C sits at 0.871
Fib Retracement of BC: Point D lands at 0.875
Fib Extension of BC: Point D is at 1.212
While Point D’s retracement at 0.875 is slightly deeper than the classic 0.786 level expected for a Gartley Harmonic, it remains close enough to validate a harmonic correction, especially considering market noise. Additionally, the expansion of BC at 1.212 is close to the 1.27 range, lending further credence to this being a Gartley-type pattern.
Time Factor: Fibonacci Time Extensions & Exhaustion
147-day Bull Run: NEAR rose from $0.971 to $9.01 in 147 days.
392-day Bearish Correction: Since hitting $9.01, the price has retraced for 392 days.
Fibonacci Time Extensions:
1.618 multiplier: 147 × 1.618 ≈ 238 days. A Classic "golden ratio" reversal target. This period coincided with a +135% surge in November.
2.618 multiplier: 147 × 2.618 ≈ 385 days. High-probability exhaustion point. This is nearly equal to the current 392 days, suggesting that time-based exhaustion may be imminent.
The alignment of these time-based measures with the price retracement (approximately 87.5% retracement of the original move) signals a critical juncture where the bearish phase could soon be over.
Identifying the Support Zone & Long Opportunity
Based on harmonic and Fibonacci analyses, the confluence of key support levels points to a potential bottom:
Harmonic Point D: Trading near $2.
Monthly Level: $1.99 acts as a strong support benchmark.
Fibonacci Retracement (0.886): at $1.887.
These levels create a long opportunity window between $1.99 and $1.887. This confluence offers a solid entry region for long positions.
Additionally, other confluence factors include:
Fibonacci time extension at the 2.618 level (around 385 days) aligning with the current duration of the bearish phase.
The symmetry of the XABCD pattern adds to the reliability of the support structure.
High-Probability Trade Setup
Long Entry:
Entry Zone: Accumulate positions in the $1.99 to $1.887 range.
Target: Aim for the 0.5 Fibonacci retracement level of the bull run, approximately $5.00, which represents a potential +150% gain from current levels.
Risk-to-Reward (R:R): With the setup targeting a substantial rebound, the risk-reward ratio is very attractive, particularly if entry is taken in the defined confluence zone.
Market Outlook:
Current Sentiment: NEAR is in a significant downtrend, evidenced by a dramatic -78% retracement after an explosive bull run.
Reversal Indicators: The harmonic pattern, Fibonacci retracements, and time exhaustion (392 days approaching the 2.618 extension) all point towards a possible bottom formation in the coming month, particularly during April.
Potential Reversal: If NEAR holds within the $1.99 to $1.887 window, a reversal back towards $5.00 appears plausible, echoing the conditions seen at previous market cycle reversals.
Key Takeaways
Historic Run & Severe Correction: NEAR surged over +828% in 147 days only to retrace -78% over the following 392 days.
Harmonic Confluence: The XABCD pattern and Fibonacci levels create a compelling argument for a turnaround.
Time & Price Alignment: Fibonacci time extension around 385 days combined with an 87.5% price retracement suggests market exhaustion.
Solid Long Entry Zone: The support between $1.99 and $1.887 offers an attractive risk entry point with the potential to target a move back up to $5.00.
After decades in the trading arena, one thing is clear—the market often cycles through periods of euphoria and despair before turning a corner. NEAR's confluence of harmonic symmetry, Fibonacci retracement, and time-based exhaustion is almost too aligned to ignore. With a defined long entry window between $1.99 and $1.887, this might be the moment to consider a high-probability long trade. As always, manage your risk diligently and wait for clear confirmation.
Wrapping it up here, happy trading =)
If you found this helpful, leave a like and comment below! Got requests for the next technical analysis? Let me know.
Fibonaccitime
DDOG Bat harmonic possibilityIf we can close of the month above $86.33 this would help confirm our Bat harmonic here and one can say would be bullish for cloud and tech stocks in general
- .886 retracement
- previous range POC
- 1.272 extension from the top
- Bat harmonic
- .75 speed fan

HTF Fib TimingsTake the April high, June low and extend from Sept high. Use 1:1 time ratios of A->B. Pretty much times every major pivot. To take this further and get a more accurate answer, use older pivots on another chart perhaps. I noticed that using negative 1:1 values also showed confluence, however it's slightly off.

EUR/USD - for EW Heads !!Hello trader,
wish you a profitabel year 💲
EUR/USD 1D Chart 📊
In my opinion, the ECB will keep lowering rates !!
Investor fear will further weaken the EUR !!
But its time for a Rebaund !!
Technically we are at 1,68 Fib Extension from Wave 1 to 2 ,thats the perfekt Target Zone for wave 3.if we break the actuall High i wil go Long.
My Target from Wave 4 is 0,382,than i will Change to a new Short.The last downward movement,to -0,236 until -0,618 🎯
I want to mention that everything I post is just options and my own opinion!
Always trade with SL and do not risk more than 1% of your portfolio (max. 3%) per trade.
If you have any questions, please let me know
➡️If you like my posts, press the Like button, comment or follow me
Thanks for reading my ideas,
Trade save !!

TESLA probably forming a triangle. 19/July/21TSLA probably forming a triangle in wave 4 (red) as price ranging above 550, which is 1) Demand Zone 2)Daily 200 EMA Lines Support 3) Fibonacci 38.2% Level...

NASDAQ100 - FIB experiment !Hy trader !
This NASDAQ100 6h chart is a combination of Fib channel,Fib Circle, Fib retracement and Fib time !
No trading advice !
If you like this post smash the like👍 button, comment or follow me.
Thanks for reading my idea,
Trade save!!

BITCOIN. WE..maybe still at Triangle in wave 4 (yellow) .18/6/21BITCOIN price seem like still in consolidation, maybe still forming a triangle pattern..

BITCOIN - Death Cross + Fib TimeBTC death-cross looks like it will happen somewhere between the two trend-based fib time projections. Trends do not magically implode at the sight of a death cross and often price is on a bounce as they do, but it is interesting that the DC is lining up with the time fibs. I am looking to fib time to provide a more accurate projection because they are a fractional extrapolation of stability found in phi / golden section and so more likely to find a continuation / reversal point. But it looks like DC will happen at the 1.618 fib of pivots 1,2,3 so I roughly guesstimate the wave 4 collapse will begin around 12th June.

RVNUSDT Harmonic targetHere I have provided my harmonic price target accompanied with time Fibonacci zones. Buy at or above the red line. Good luck!


perfection calling the drops right before they happenfibonacci time ! the scalp long buy after closing this short i just aced is at 10948-10920 area

DJI crisis take 2My previous take on DJI got reached ahead of time. Currently I am focusing on improving my time fib skill. So this is my second take on what is next with estimated time and value, included a circle fib just in case I nail everything this time.

All good things come to an end...Needless to say SPY has been on an epic run for roughly a decade but as anyone of age knows all good things come to an end. The Fibonacci timing tool used in this chart uses two high points and a low in between them. The tool has been accurately predicting trend reversals but one week late 2 times in a row (look at how SPY reversed trend 1 week before the 1 extension and 1 week before the 1.27 extension. The 1.618 corresponds to the 23rd of Dec. implying on the 16th we may begin to see a reversal to the downside, lets see what happens. Thus far we are seeing negative RSI divergence (not included it the chart) and negative on balance volume divergence as well. We are also very close to 1.27 extensions of the two most dominant impulse waves of the index; 1 up and 1 down. I would not be surprised to see extensions that surpass the respective 1.27s and I can only be neutral at this time as my own analysis shows we are more than a month away from what could be the start of a correction at best or be on the cusp of a full blooded bear market at worst. All we can do is deal in probabilities. Please ask any questions and leave relevant comments. Thanks for reading.


Gold will reach 1360 within 5 Feb 2019I try to seek Date at Target price.
I think Gold will reach 1360 but not sure how many days will there.
so i follow them it can be there ? or It can be there around that Date ?
*** This is only Education Idea ***

Cardano short term for day tradersI am back with BTC cross ALTs analysis and also back with the tool fibonacci time. Fibonacci time is something on my toolbox I usually got around 50% accuracy last year, I will to improve it for next year together with mighty fibonacci circle and the all important standard fibonacci together. The idea here is try to filter out fibcircle harmonics which should not be the main one, as this year the main problem was several fibcircle harmonics hidding the main one which are only sorted by risk management but even mid harmonic provide us with sweet spots where risk return is very high so with trailing stop you handle the market even without a magic ball and this is all about what we want, gaining more than losing and have a positive net profit without any future prediction at all.
There is two possible circles here, one for each green flag, but I have not displayed the second one in order for the chart to be clean.
So if you like my charts and want me to continue analysis with BTCATLs please show some form of support be it Like, comments, share.

Dow Jones - What do Fibonacci Time Tell us? This blog is using fibonacci spirals as basis for price projection in several market, while the same basis can be apply in time series manner. First, we need a first swing for projection, the obvious one was the 2007 peak to 2009 market bottom, it took 512 days from peak to low. So projection as follow:
Factor First Swing 61.80% 161.8% 261.8% 423.6% 685.4%
Duration of Trend 512 316 828 1340 2169 3509
Date of Peak 15-Jan-10 13-Jun-11 8-Nov-12 12-Feb-15 11-Oct-18
A summary of price action from projection date:
15-Jan-10: Market reached its peak at the same date, price dropped for 8.34%
13-Jun-11: The day pointed the low of 7.87% correction, but price made lower high and correction for 18.24% with Greece crisis.
08-Nov-12: Low of 8.71% correction came 6 days later from projection date, trend continue to rally.
12-Feb-15: Price reached historical high 11 days later from projection date, Dow fall 16.24% after that and correction for 21 months.
11-Oct-18: At 3 Oct, Dow reached historical high , no further indication yet.


BTC – Fibonacci – Divine Ratio - $20K soon ?Hello Guys!
Let’s take a look at BTC but this time using large time frame. We love big pictures.
With them many things make deeper sense, doesn’t it?
Today we want to describe you what Fibonacci ratio is.
This is a special ratio that rules the proportions of the world starting from such a small things like atoms, flowers, trees and finishing with unimaginably large celestial bodies. Simply nature relies on this golden ratio. People who stand behind financial markets are the part of the nature, too. Such rules can be applied to their behaviour.
Mathematicians, scientists and naturalists have known this ratio for centuries. It's derived from something known as the Fibonacci sequence, named after its Italian founder, Leonardo Fibonacci (whose birth is assumed to be around 1175 A.D. and death around 1250 A.D.). Each term in this sequence is simply the sum of the two preceding numbers (1, 1, 2, 3, 5, 8, 13, etc.).
Sequence is not that important. More important are ratios. Here are couple of examples:
1,618 (golden ratio) ~ 5/3 ~ 8/5 ~ 13/8 ~ 21/13
0,618 ~ 3/5 ~ 5/8 ~ 8/13 ~ 13/21
0,382 ~ 3/8 ~ 5/13 ~ 8/21 (by the way 1 – 0,618 = 0,382)
0,236 ~ 3/13 ~ 5/21
Ok you think this is cool but it doesn’t prove anything. Does it?
Take honeybees, for example. If you divide the female bees by the male bees in any given hive, you will get 1.618. Sunflowers, which have opposing spirals of seeds, have a 1.618 ratio between the diameters of each rotation. This same ratio can be seen in relationships between different components throughout nature.
Still don't believe it? Need something that's easily measured? Try measuring from your shoulder to your fingertips, and then divide this number by the length from your elbow to your fingertips. Or try measuring from your head to your feet, and divide that by the length from your belly button to your feet. Are the results the same? Somewhere in the area of 1.618? The golden ratio is seemingly unavoidable.
So guys getting back to the chart.
We marked Fibonacci Spiral marking minimums and maximum from last 7 months.
What does it say? We are really low and there is no much room to go any lower.
We have a plenty room to go up. First till $12000 - $12600. Of course it takes time and won’t happen linear. Once we brake it and be in the uptrend we can expect such levels as $20000 - $23000. When? That is good question?
We also marked time frames based on Fibonacci scale. We marked them first backing to 2014 when BTC was first time listed on Bitfinex. Each vertical blue line represent something interesting on the chart. Saying that we mean price turns. Look how perfect it matches the peak from turn of 2017/2018.
We also marked mid-term Fibonacci scale with red lines using the same strategy (turning points). Funny thing happened. There are only 2 lines aligned with each other. They occurred JUST NOW. Is something big to happen very soon?
What do you think guys?
Would you apply this technique to your charts? Do you trade with it?
Please do share with us your opinion. We are co curious…
HUGE Hugs!
WBM Team

$ETH USD - Bull run or bust? 90% gain at 1:7 risk/rewardHello friends and fellow traders, welcome to this idea on ETHUSD.
Looking at the weekly gives us a good idea as to how far ETH has come and where it’s planning to go. On a conservative estimate, I’d say $20K isn’t out of the question for ETH some day.
From the surface, if one just look at ETH’s correction from $1400 to $360, one may arrive to the conclusion that yes, we’ve hit support and since we’ve past the .618 retracement, we’re likely done with the second cycle, wave II, right? Possibly, but I doubt it. Typically the second wave retrace does about .382, .5, or .618 the time it took to produce the first wave. So in this case, the earliest we should expect ETH to be done with its second cycle would be near the end of the year. With the short bull run that BTC will be having, it’s not out of the question to expect a short bull run for ETH, which may be followed by several months of correction to take it down to the low 300s.
With those assumptions in mind, we do have a fairly decent trade setup as follows:
Entry: $570 - $550
Stop: $500
Target: $1100, exit half at $800 and spread the rest up to $1100
I’ll be updating this as we go and if market condition dictates, we might have to close the trade early or take less profit and let the rest ride past our original target. Please don’t forget to like or comment as it always helps to get feedback from you. As always, good luck and stay safe!
Kinashi-San
*The ideas and comments expressed herein are my personal opinions and should not be taken as financial advice. Being a trader, at any given point in time, I may or may not be holding the asset in question. This is not a recommendation to buy, sell, or hold.*

$POA BTC - easy money - 50% gain 1:5 risk/rewardGuys,
While I’m longterm bullish on POA, this correction seems like it’s not done yet:
1) We are only .382 the amount of bars it took for the impulse wave that precedes it.
2) I am unable to identify the waves in the daily chart, making this seem like a single impulse wave that’s part of a larger corrective wave.
With that said, we do have a short bullish corrective wave within this correction to cash in on so let’s gamble a bit here while BTC is showing strength. You can FOMO market buy or set your order as follows:
Spread your entries: 0.00004900 down to .00004700
Stop: 0.0004325
Target: spread your TP from 0.00006800 to 0.00007200
After you exit at 7200, we may continue the trend up but there is a chance that we’ll come back down to the 4000 range so tread carefully if you decide to hold. This will all depends on the impulsive wave that takes us to 7200 of course so I’ll be updating this post as we go.
Found this idea to be entertaining or absolute garbage? Feel free to let me know with a like or comment. As always, good luck and stay safe!
Kinashi-San
*The ideas and comments expressed herein are my personal opinions and should not be taken as financial advice. Being a trader, at any given point in time, I may or may not be holding the asset in question. This is not a recommendation to buy, sell, or hold.*

$XRP BTC - unconventional time-based analysis 130% gain 1:18 RRHey guys,
Ripple is struggling to prove itself due lots of FUDs in the media at the moment. Say what you will but XRP is one of the few projects that actually has products that are being used right now. xCurrent, xRapid, and xVia are real products being used by major banks and MoneyGram right now as we speak as opposed to some pie in the sky 1 zillion TPS blockchain that's just getting their ideas together. XRP is as real as it gets. Yes, banks don’t need XRP to use their products or the blockchain, however, they do save quite a bit (70%) in overall costs by using XRP so know that this push will happen eventually and it’s just a matter of you being ready for it or not. This video helped me understand quite a bit about the product side of Ripple:
www.youtube.com
From a technical stand point, so far we’ve exited our descending trend line from January high and have bounced off it for support successfully. However, looking at the daily, it seems we’re being blocked by the 100MA, 200MA and a key pivot at 8450. At least we have an ascending trend line originating from April 3rd to help support this slow push. If you feel like you’re just watching paint dry, you’re not alone as I think about it everyday. So when will the action starts? Perhaps mid June.
If you take a look at the push from 3/15/17 to 5/17/17, the corrective wave was about 3.236 the time it took to produce the impulse wave preceding it. Also note the 3x fibonacci projection at .000228:
A similar ratio can be observed by the push from 12/08/17 to 1/4/18 and its correction:
With those 2 as guidelines, we can expect XRP to be done warming up by mid June and start accelerating hard towards the end of June to mid July. With that in mind, our trade would be like this:
Entry: 0.00008
Stop: 0.00007
Target: 0.00019
Risk/Reward: 1:18
Found this idea to be entertaining or absolute garbage? Feel free to let me know with a like or comment. As always, good luck and stay safe!
Kinashi-San
*The ideas and comments expressed herein are my personal opinions and should not be taken as financial advice. Being a trader, at any given point in time, I may or may not be holding the asset in question. This is not a recommendation to buy, sell, or hold.*

$BCN BTC Salivating over Bytecoin? Go grab a burger insteadLadies and gents, cycles exist whether you like it or not. When you understand and respect cycles, you’ll do much better as a trader. There are bull and bear cycles with every asset. While we can rely on fib levels for correction entries, not understanding cycles will lock up your capital for an unknown amount of time and ultimately force a premature losing exit for a better trade.
I want to thank my followers for bringing this coin up to my attention so I can hopefully save a few traders from this seemingly great trade. On the surface, we have
1) An impulse wave that did 600%. Six hundred percents. Yes, FOMO was very real
2) A corrective wave down to almost .786 that terminated at the support created by the resistance in early May at 75 satoshis.
3) As far as fib time, this corrective wave happens to be roughly .618 of the impulse so it’s save to assume that it should be done, right?
4) The last 2 days, we have an indecision candle which was followed by bullish candle that broke above our 9D EMA and will likely close above it.
5) We are trading above a technical pivot at 89 satoshis and will likely close above it.
6) In this short BTC recovery, it is the definitely one of the higher gainer, currently at 24% where most of the other major coins are doing 5-10%
So, BCN seem bullish, should you buy? Well, let’s take a look at the history of this coin
I don’t know about you but I have reservations recommending this coin. It seems too pump and dump to me. If you take a closer observation at the last 2 pumps:
3/28/2017 to 5/22/2017 - the correction took about 4 times the length of time of the impulse wave
12/14/2017 to 1/6/2017 - same thing - the correction was 4 times the impulse wave
Please note, I have a high chance of being wrong here since we do have a W or double bottom being formed here. However, if history repeats itself, likely we’ll see another pump in September and not anytime soon.
With that said, there are plenty of other great trades that are happening now so while this might seem like a great trade at the moment, do yourself a favor, control your appetite and look elsewhere. Much love.
Found this idea to be entertaining or absolute garbage? Feel free to let me know with a like or comment. As always, good luck and stay safe!
Kinashi-San
*The ideas and comments expressed herein are my personal opinions and should not be taken as financial advice. Being a trader, at any given point in time, I may or may not be holding the asset in question. This is not a recommendation to buy, sell, or hold.*
