Ethereum Price Target $3,120 by Sunday?Ethereum short position Price Target $3,120 by Sunday ? Negative divergence on the hrly RSI.
Exhausted the 15 minute positive divergence when bouncing off the EMA 200 on the 1 Hour chart. First profit target is $3,350 second is $3,120. I am usually wrong with my estimations... I would recommend the opposite. So go long!
Fibonnacci

Fake Pump, Real Dump?On the daily timeframe, XAUUSD is expected to be vulnerable to a correction toward the 3253–3325 area as the minimum retracement zone to potentially form a triangle pattern. However, in the worst-case scenario, indicated by the black label, XAUUSD may experience a deeper correction toward the 3093–3191 range.

One Last Dip Before the Pop?On the daily timeframe, we anticipate two possible scenarios for USOIL’s movement. In the red-labeled scenario, USOIL is expected to undergo a correction to test the 63.71–64.03 area. However, in the best-case scenario, if USOIL manages to hold above 64.03, it has the potential to strengthen toward the 68.27–72.53 range.

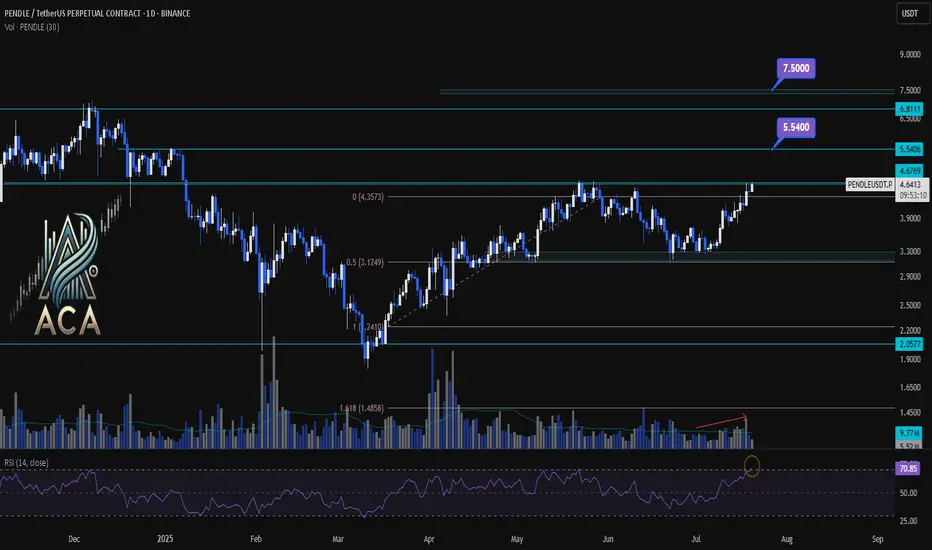
PENDLEUSDT 1D Chart Analysis|Bullish Breakout Eyes Higher TargetPENDLEUSDT 1D Chart Analysis | Bullish Breakout Eyes Higher Targets
🔍 Let’s break down the PENDLE/USDT daily chart, focusing on breakouts above key resistance, Fibonacci retracement dynamics, RSI momentum, and volume confirmation for a comprehensive bullish setup.
⏳ Daily Overview
PENDLE has staged a powerful recovery after pulling back to the 0.5 Fibonacci retracement level (around $3.12). Price is now testing the critical $4.68 resistance—the ceiling from the last corrective wave. RSI has jumped above 71, entering the overbought zone, a classic precursor to strong momentum moves. Volume is rising as bulls attempt a breakout, confirming participation behind the price action.
📈 Technical Convergence and Trend Structure
- Fibonacci Structure: The correction held the 0.5 retracement, a textbook bullish reversal zone in rising trends.
- Resistance Breakout: Price is challenging the $4.68 resistance. A daily close above, especially with high volume, would confirm the breakout and trigger bullish continuation.
- RSI Indicator: RSI has cleared the 70 mark, reinforcing strong momentum. Overbought RSI often supports further rallies when backed by breakout moves and rising volume.
- Volume Confirmation: Volume surged as PENDLE reclaimed lost ground and is now accelerating into the resistance test, suggesting trend conviction and confirming the move.
🔺 Bullish Setup & Targets
- First target: $5.54 — the next resistance based on historical supply and Fibonacci extension.
- If macro conditions like interest rate cuts align, the next potential target: $7.50 — the major extension target where price discovery is likely.
- Key trigger: A strong daily (or weekly) close above $4.68, combined with breakout volume, is likely to ignite the next leg up.
📊 Key Highlights
- Correction held at the 0.5 Fibo, signaling trend health and resetting momentum.
- A bullish daily structure aligned with a weekly breakout confluence.
- RSI and price action both making new local highs — strong uptrend indication.
- Volume confirming the move—a real breakout is underway, not a false start.
🚨 Conclusion
PENDLE/USDT looks primed for continuation higher. The blend of a successful 0.5 retracement retest, breakout attempt above $4.68, robust RSI, and volume surge all point to bullish follow-through. Watch for a confirmed close above resistance as the catalyst for further upside, with $5.54 and $7.50 the next logical targets if momentum persists.
Gold Futures ($GC1!) — US Session Setup: Bearish Retest from 618🟡 Gold Futures ( COMEX:GC1! ) — US Session Setup: Bearish Retest from 0.618 Fib in Bullish Breakout Context
⏳ Pre-US Session Playbook
We're currently watching Gold Futures ( COMEX:GC1! ) for a potential short opportunity into the US session open. While the broader structure has broken bullish, we're anticipating a bearish retest scenario from a key Fibonacci level — aligning cleanly with last week’s breakout structure.
No positions have been taken yet — we are setting up for the US session — and are closely monitoring price action near the 0.618 retracement zone before committing.
📍 Setup Breakdown
• 0.618 Fib Retracement from the last bearish impulse aligns with:
○ Recent volume shelf resistance
○ Retest zone from prior breakout
○ An overextended local push into thin volume above 3380
• Bullish Context:
○ HTF breakout from descending wedge structure remains valid
○ Macro buyers still in control
○ Upside continuation risk is high if sellers don’t show up
• Short Bias Conditions:
○ Rejection or absorption in the 3385–3390 zone
○ Weak follow-through above 0.618 (failed breakout scenario)
○ Breakdown of LTF higher low structure post-test
🧠 Strategy Commentary
Although we’re in bullish breakout mode, this is a tactical short setup — a fade into prior structure with clear invalidation. We're not fighting trend, but looking to short into exhaustion at a defined level, with tight risk parameters.
Confluence Factors:
• 0.618 fib alignment
• VRVP volume shelf
• Prior breakout structure retest
• LTF divergence or absorption confirming the fade
🎯 Trade Parameters (Planned)
• Entry Zone: ~3385–3390
• Stop Loss: Tight, 3395–3400
• Target Zone: 3342–3337 (full structure retest)
📌 Patience is key — this remains a setup until confirmed. We'll post live if and when conditions are met.
Let the market come to you.

fuboTV $5.00 price target Positive Divergence Multi time frameMy trade on fuboTV has a $5.00 price target. With positive divergence multiple time frames 15,1hr, 4hr. An RSI scoop where the hrly RSI with a length setting of 36 shows upward momentum? The Chande momentum oscillator with a setting of 24 indicates the price may not stall at $4.50.

Got filled at the bugattiMy hedge short is filled
continuation of my other chart
IF this is good the target it the!!....
key levels will be longed if data aligns.
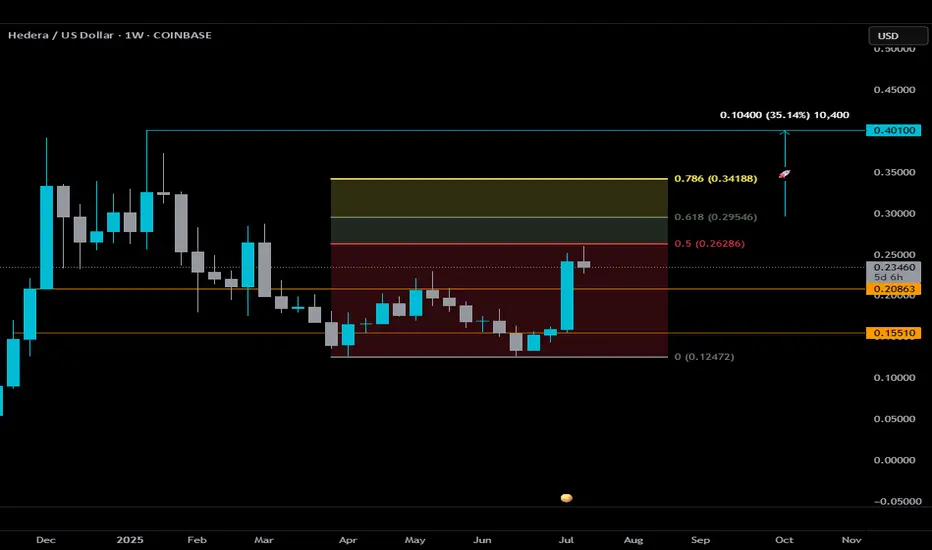
$HBAR Weekly Outlook — Key Levels to WatchHedera is attempting to catch some momentum alongside the broader ISO20022 narrative, but from a technical standpoint, here’s what matters right now:
🔍 The 0.5 Fib level at $0.26286 is critical.
During last week’s #bUCKmOON the candle came close but ultimately failed to close above it — a clear sign of rejection. Until we see a confirmed weekly close above that level, this move remains a potential fakeout rather than a breakout.
⚠️ If HBAR can secure that close, the next key area is the golden zone. A break into this zone would suggest bullish momentum is gaining strength, with a potential target at $0.401 — roughly 35% from the .618 Fib.
🟥 On the downside, as long as price stays under the 0.5 Fib and in the “red zone,” don’t expect much follow-through. Price will likely continue to range between the two well-defined orange lines:
• Support: $0.15510
• Resistance: $0.20863
These levels have held consistently throughout 2025 and should continue to act as key pivots.
📌 In summary:
— No weekly close above the Red Zone = range-bound behavior
— Break and hold above the red zone = potential entry into bullish continuation
— Golden Zone = area to monitor for acceleration or reversal
Stay Sharp and Disciplined. Wait for the setup, confirmation is 🗝️.
THIS IS NOT FINANCIAL ADVICE. DrAnkin Smöökëē Whizkee. Edumacational Purpiz Only!
XAUUSDHello trader
Gold and the recent correction levels
Before the rally and never returning
This is one of the last opportunities to enter gold
In areas below $3,000
The final correction
If it occurs and the price enters the $2,700-$2,800 range
These are ideal buying areas.
Good luck to everyone.

FiservInsiders have sold $239 Million shares on MAY 29TH. We expect price to rally from these lows to visit the 50% Fib levels. This is a contrarian play as 4,024 Puts are in play which means more Bears are betting on a drop. This means a lot of Stop Loss orders are prime above the $170 level. This will be a Fade the market play.

Trading the Impulse Rally Retracement — Price and Time Symmetry The Stop Loss Triangle is back!
This time with BITSTAMP:BTCUSD coming off its recent impulse rally. For those of you that aren’t familiar with my strategy — let me start from the beginning…
This concept involves positioning against the opposing decline in price and time as a precursor to our theoretical projection. If the underlying enters our predetermined faded cross-section, the stop loss is triggered to prevent sideways consolidation and the erosion of contract premiums or leverage decay.
This inherently ‘sclene’ triangle is constructed by drawing a straight trend line through the bottoming reversal candle and the furthest projection in price and time symmetry (78.6%) of the retracement. Once connected, draw a vertically positioned straight line from the highest or lowest point in the previously identified retracement to the bottom reversal candle area once again. To create a ‘right triangle’, now turn 90 degrees towards the final point, which is determined by the nearest projection in price and time symmetry (38.2%). This allows time after the imposed price and time date, yet not enough for premium or leverage decay to become significant.
In its entirety, this forms the stop loss triangle.
I encourage my followers to identify and explore the system on their own. As always, feel free to ask me anything related to it. We’ll follow along and you’ll be amazed at the precision of Fibonacci symmetry.
CHEERS

GOLD 4H: not all that glitters is bullish...The 4H chart shows a clean descending triangle breakdown. Price failed to reclaim the trendline and was rejected under both MA50 and MA200. The bounce into 3325–3340 was absorbed — classic liquidity sweep and fade. Volume confirms bearish control.
Technically, the breakdown below 3320 opens the way toward $3293 (1.0 Fibo), $3250 (1.272 extension), and final target at $3195 (1.618), where buyers might step in. RSI supports the continuation without signs of reversal. Structure broke — and the market is telling us where it's heading.
Tactical plan:
— Entry at market or on a retest of $3325–3335
— Targets: $3293 → $3250 → $3195
— Stop: above $3340 (above MA50 and broken trendline)
When gold looks shiny, smart traders look deeper. This breakout isn’t golden — it’s a trap for late bulls.

TUBE INVEST OF INDIA at Best Support This is the 4 hour Chart of TIINDIA.
TIINDIA is holding within the Fibonacci retracement golden zone.
If this level is sustain , then we may see higher prices in TIINDIA.
Thank You !!

BTC Loses Key Level — Will 100K Hold or Fold?Bitcoin has been locked in a range for the past 45 days, clinging above the critical psychological support at $100K. But cracks are starting to show…
Every bounce from the key level at $102,430 has been weakening — and now, for the first time, we’re breaking cleanly below it. Things are starting to tilt bearish.
So the question is…
⛏️ Will 100K be tested next?
🔍 Key Support Zone: $97.7K–$96.9K
Using the Fibonacci retracement from the swing low at $74.5K to the recent ATH, the 0.382 retracement lands at $97,655 — just below the $100K mark.
But there’s more…
Here’s why the zone between $97.7K and $96.9K is crucial:
0.382 Fibonacci retracement: A common pullback level in strong uptrends.
Anchored VWAP from $74.5K: Currently sitting around $96.9K, tracking cumulative volume-weighted average price — a key level.
Daily Order Block: Sits right at $96,887, aligning with the VWAP and reinforcing the area as demand-rich.
1.272 Fibonacci extension: From the previous move — providing another layer of confluence.
Fair Value Gap (FVG): The imbalance lies right in this zone. Price often fills these before continuing trend.
All of this stacks up to a high-probability long setup.
🕵️♂️ What to Do Now?
Set alerts at $100K and watch for a reaction. If price slices through, shift focus to the 0.382 Fib — monitor price action closely for signs of a reversal.
The first clean test of this zone could present a solid long — but as usual don’t trade blindly. Wait for confirmation.
_________________________________
💬 If you found this helpful, drop a like and comment!
Want breakdowns of other charts? Leave your requests below.

AUDJPY TREND TRADINGLooking to follow the lower time frame bullish trend next week to play into the higher timeframe down trend. Three trade ideas roughly looking to bank 16R. can squeeze more depending on if you market execute from price action signals or just set limit orders with conservative stop loss sizes.

Market Outlook – Nifty Near Critical Levels! Caution Advised
Nifty Weekly Wrap-Up:
The Nifty 50 index closed the week at 25,003, posting a solid gain of +250 points from last week's close. It touched a high of 25,029 and a low of 24,502 during the week.
But here’s the twist—while the uptrend looks strong, we’re now at a crucial inflection point on the weekly chart.
Technical Outlook – Is a Bearish “M” Pattern Forming?
On the weekly timeframe, Nifty is at a level where a bearish M-pattern could potentially develop. To complete this pattern, the index could pull back towards support levels at:
24,414
24,200
24,000
If the selling deepens, the final support zone lies between 23,900–23,700, where a bounce-back is likely.
Bullish Scenario – Can Nifty Break Out?
If Nifty holds above 25,000 for at least 2 consecutive sessions, it could trigger a short-covering rally, paving the way for a move toward key resistance zones at:
25,400
25,565
26,100
Next Week’s Expected Range: 24,500 – 25,500
This range should see most of the action next week. If you're holding long positions, now is a great time to:
✔️ Lock in profits
✔️ Trail stop-losses
✔️ Prepare cash reserves for potential dip-buying opportunities
Global Watch – S&P 500 Hits Key Resistance
The S&P 500 closed near 6,000, up 100 points for the week. But heads up—it’s now testing a strong Fibonacci resistance at 6,013.
A rejection here could lead to a correction toward 5,900–5,850, a dip of 1.5–2.5%. If this unfolds alongside a Nifty pullback, it would align perfectly with our support targets around 24,400–24,500.
Final Takeaway:
Markets are looking stretched. While momentum remains positive, profit booking at higher levels is essential. Don’t get caught unprepared in case of a reversal. Stay tactical, stay liquid.
Smart money is already locking in gains. Are you?

EURAUD (BOS + IMB + OTE)Hello traders!
Description: We have STB(Sell to Buy Action) - you can see it on 1H TF, which grab some liquidity and then made BOS. In this moment we can expect that price comeback to 0.5 and then i will look reversal on LFT, after closing IMB.
Entry: Confirmation on LTF in POI. Alarm on 0.5 Fib Level.
Target: HH
P.S: check also previous idea. We still have valid Demand on LTF.
Have a profitable day and don't forget to subscribe for more updates!
If you like this idea drop a like, leave a comment or write your pair, i will check.

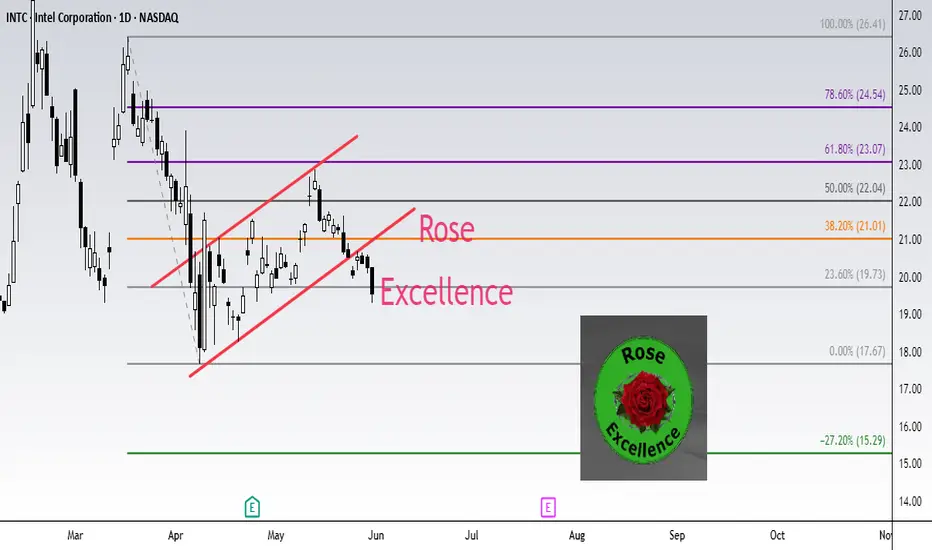
INTEL INTC Short setup target 15.29Fibonacci technical analysis : Intel Corporation NASDAQ:INTC has already found resistance at the Fib level 61.8% (23.07) of my Down Fib. The May 30th Daily candle has closed below retracement Fib level 23.6% (19.73), confirming a sell signal. A Bear Flag pattern has also formed. My Down Fib guides me to look for NASDAQ:INTC to eventually go down to hit first target at Fib level -27.2% (15.29).
NASDAQ:INTC – Target 1 at -27.2% (15.29), Target 2 at -61.8% (12.26) and Target 3 at -78.6 (10.79)
Stop loss slightly above the 50.0% retracement Fib level (22.04).
Enjoy the trading process and take time to smell the roses🌹
Apple I expect to grow back to 260 after this correction.Looking to the Fibonacci sequence, I'll expect Apple to return to 260.
The bottom is strong and was tested after Trump announced the tariffs.
The market lookout is also good, I see large banks advise 270 even.
Now it's a good time to buy Apple.

$XAUUSD Holding Key Support – Bounce Incoming?OANDA:XAUUSD is holding firm at the short-term support zone around $3,290–$3,295. This zone also aligns with the 200 EMA, adding strength to the current level.
Price previously flipped this resistance into support, now acting as a solid demand zone.
If we hold here, a potential push toward $3,330–$3,360 could follow.
Sellers remain active near the upper range, so monitor reactions closely.
DYOR,NFA
OANDA:XAUUSD TVC:XAU

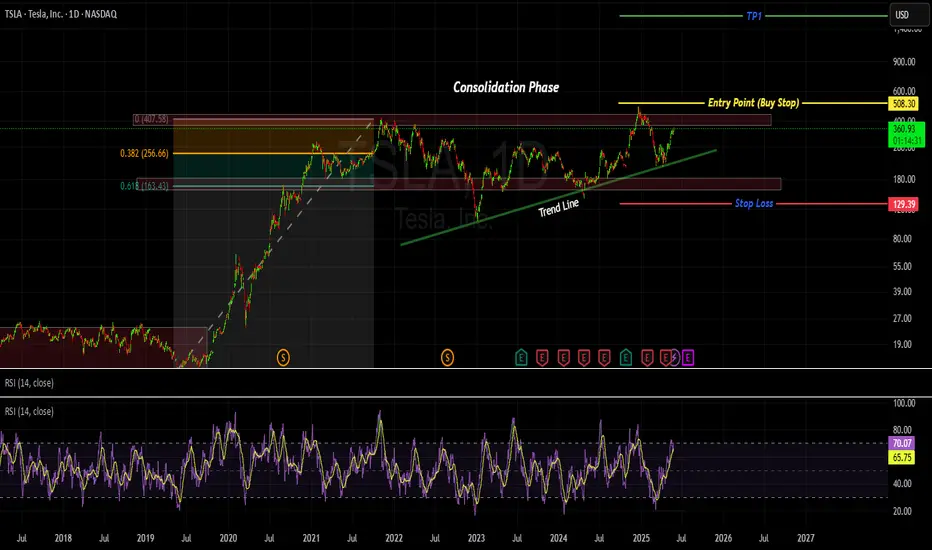
TESLA - POSTIONS ACCMULATING OR MARKET CONFUSION !!!!Hi, Tesla is making series of HH and HL. Bullish trend line can also be seen. however, it is in consolidation phase since long. currently the market is trading near the strong resistance level of 409. if the market break this support level and even breaks the previous HH which is 482 then we can expect market to take a bull ride.
Trade entry plan is to set BUY STOP order type at the mentioned Entry Point. once the trade is executed we can Set Stop Loss slightly below the previous HL /support level.
TP1 and TP2 are placed with 1:1 and 1:2 Reward to Risk ration
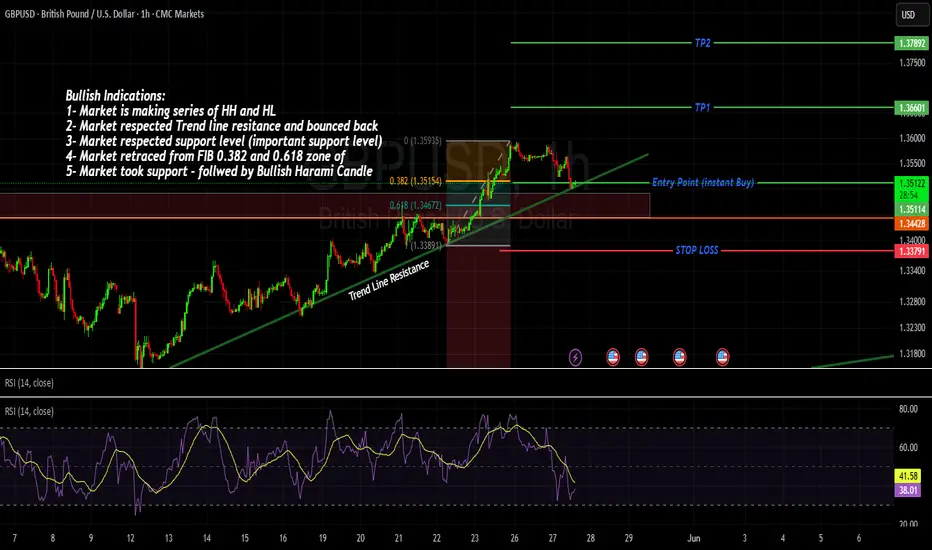
GBPUSD - SO MANY BULLISH CONFLUENCES ! Bullish Indications:
1- Market is making series of HH and HL
2- Market respected Trend line resistance and bounced back
3- Market respected support level (important support level)
4- Market retraced from FIB 0.382 and 0.618 zone of
5- Market took support - followed by Bullish Haram Candle
Entry point - Instant Buy
SL below last LH (Although too much, but safe play)
TP1 and TP11 (with 1:1 and 1:2)
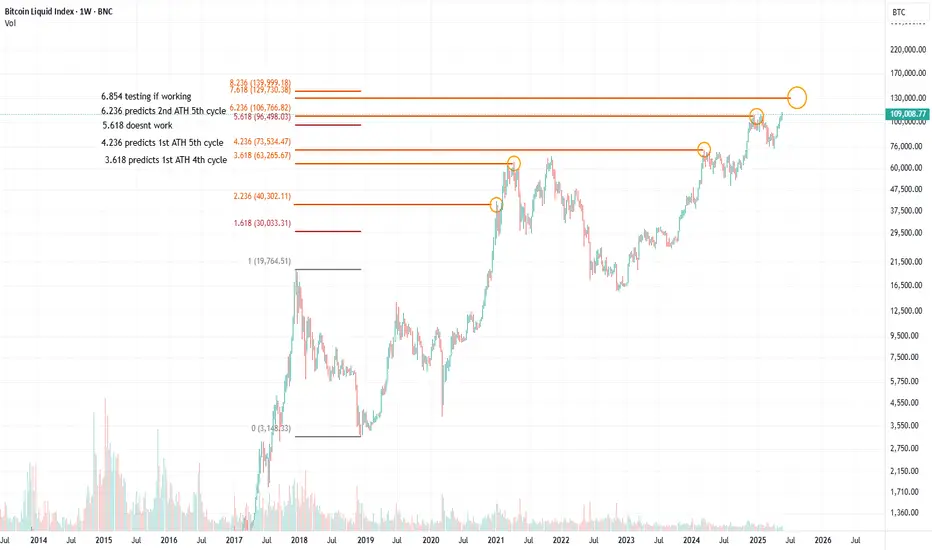
BITCOIN IS A SOLVED GAME. AND I SOLVED IT WITH 1 FIB PULLOne single fib pull to rule them all. From top to bottom in 2018 we can clearly see how many significant levels we get:
The 2.236 level gives us the first ATH in 2021. After that we face a 30% pullback.
The 3.618 level gives us the 63k top in 2021, again to the absolute dollar.
The 4.236 level gives us the first ATH of 2024, after which we faced 230+ days of sideway nothingness.
The 6.236 level gives us the exact ATH at the end of 2024
Following the logic of these numbers the next levels we should look for are: 7.618 and 8.236