BTC 1H BEARISHIt looks very bearish for btc, with some possible targets where btc could test before rally up again.
what is your current opinion on the BTC ?
Fibonnacci

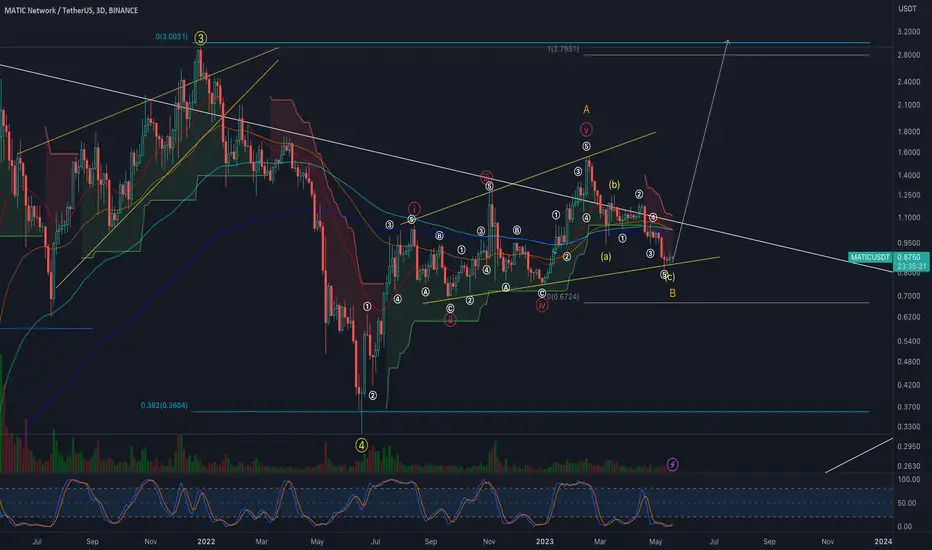
matici got matic about bottomed and finished with the HTF B wave. Now loading C wave back to $5 plus

GNSUSDTGNSUSDT breakthrough resistance and now is in good bullish momentum.
A retest of broken resistance along with 38% Fib level will be a good area of value for another bullish leg.

BTC Potential Movements Time for a new update :
Hello, traders. I'd like to provide an update on Bitcoin's Fibonacci pivot points for various periods, including 1 year, 3 years, and 10 years.
Fibonacci pivot points are a popular tool used in technical analysis to identify potential support and resistance levels. These levels are calculated based on Fibonacci ratios and are commonly used by traders to identify entry and exit points for trades.
For this analysis, I've calculated the Fibonacci pivot points for Bitcoin using three different periods: 1 year, 3 years, and 10 years. By analyzing these different time frames, we can get a better understanding of Bitcoin's long-term trend and potential price targets.
Based on my analysis, Bitcoin's Fibonacci pivot points for the 3-year period suggest that the current resistance levels are around HKEX:30 ,000
Of course, these levels should be used in conjunction with other forms of analysis, such as trend analysis and price action, to make trading decisions. It's also important to note that past performance is not necessarily indicative of future results, so traders should exercise caution when using Fibonacci pivot points or any other technical indicator.
I hope this analysis provides some useful insights for Bitcoin traders. As always, I welcome your comments and feedback on this idea.

W10-12 AUDUSD BULLISH IDEA (HARMONICS REVERSAL PATTERN)Potential Bullish Entry
Dow Theory In Place - Higher High and Higher Low Expected in Place
Formation of Harmonic Bullish reversal Pattern coupled with bullish divergence at potential reversal zone (PZR)
Entry at the new HH
SL & TP Levels are defined.

$NVDA Monthly Chart with Fibonacci NASDAQ:NVDA Monthly Chart Fibonacci resistance Level almost there just a little bit higher!!!

HBAR to dip sub .05 or do we moon?Big fan of the HBAR... Feeling there's going to be a pull back taking out March lows providing another amazing buy opportunity!! There's loads happening in the Hedera ecosystem many new projects are coming on board making most of its benefits to developers... www.degenparadise.com - Get your Degen Coins for a share of revenue from its amazing games!! zuse.market - Would love to see this beast of a project rise to the top 5 this next 2 years!!!! Vamos Hedera Hashgraph

MY THOUGHTS ON EUR/USDIn my analysis of EUR/USD on the WEEKLY Chart , I forecast that price is moving toward price $1.18692 which is the 61.8 of Fibonnaci, for wave 3 or the Elliot Wave. I utilized the Elliott Wave and the Fibonacci in my analysis. FX:EURUSD

How it played out.... GJ TRADE.Right now I am up 3K with this trade alone. If you check out my previous idea, you would see that it played out perfectly. Along with my EURAUD & XAUUSD trade idea. Follow me for more ideas using price action. I will be sending day trades & also some good swings. GJ,EA,GOLD & US30.

Eurnzd BREAKOUT!!!! who else is SEEING this!!!!!!????💥💥A CONFLUENCE of TRENDLINE, PULLBACK zone and FIBONACCI retracement zone everything's stacked for a potential strong up move.
lets see whats gonna happen guys......
Like and subscribe or you will miss analysis and calls like this in future......
LIKE or i'll take your stoploss!!!!!!!! 😆

Prepare for Impact: Scorpio Tankers Approaching Free FallScorpio Tankers Inc. (STNG) appears to be headed for a downside based on two significant factors - the impact of the oil market and the approach of Wave 3 in the Elliott Wave Theory. The recent downturn in the oil market has hit the entire industry hard, and Scorpio Tankers is no exception. As a company that operates in the oil tanker shipping industry, the drop in oil prices and demand for oil transportation services will have a significant impact on its revenue and earnings. Additionally, from a technical analysis perspective, Scorpio Tankers is approaching Wave 3 of the Elliott Wave Theory. After touching the 0.786 Fibonacci retracement of Wave 2, the stock saw a sharp decline, indicating that Wave 3 may be on the horizon. Based on this analysis, investors should look for the price of Scorpio Tankers to head towards the range of TASE:47 - TASE:43 in the near future.

Is the US30 Rally Coming to an end??The last two days have been highly bullish, wouldn't you agree? Just enough to get buyers off their wallets to deliver a devastating blow. Last week we successfully sold US30 for 500 pips. I expect more of the same this upcoming week.
I've Identified 5 Different Structures that give us a price cluster, at a significant market level. Details Below.
Structure 1
S1 from swing high 34889 to swing low 31426 is the largest structure we used to capture the .618 Retracement.
Structure 2
S2 from swing high 34498 to swing low 31426 gives us another .618 Retracement .
Structure 3
S3 from swing high 33582 to swing low 31426 gives us the .786 - .886 retracement zone . (Only using the .886 as a part of the price cluster.)
Structure 4
S4 from swing high 32992 to swing low 31426 gives us the 1.272 extension
Structure 5
S5 from swing high 32765 to swing low 31727 gives us the 1.618 extension
We have been experiencing a lot of market volatility and had some consolidation the last few times price was at these levels. As always respect your risk and be patient with your entries. I took a more conservative entry because there are significant levels above the price entry. In case markets get wicky I would like to stay in it. Good Luck
STOP LOSS: 338876
ENTRY: 33570
TARGET: 32823
Was this helpful for you? If so like and comment! If not, please share with me how you feel these ideas can come across more clearly. Happy Trading

USDCHF - Bearish Double Top 📉Hey Traders !
The USDCHF Price Reached a 0.5 FIB Level !
Currently, The Price Formed a Double Top Pattern !
The Neckline is Broken 🔥
If Price Stays Under The Key Zone, USDCHF Can Continue The Bearish move !
-----
TARGET: 0.88650🎯
___________
if you agreed with this IDEA, please leave a LIKE, SUBSCRIBE or COMMENT!

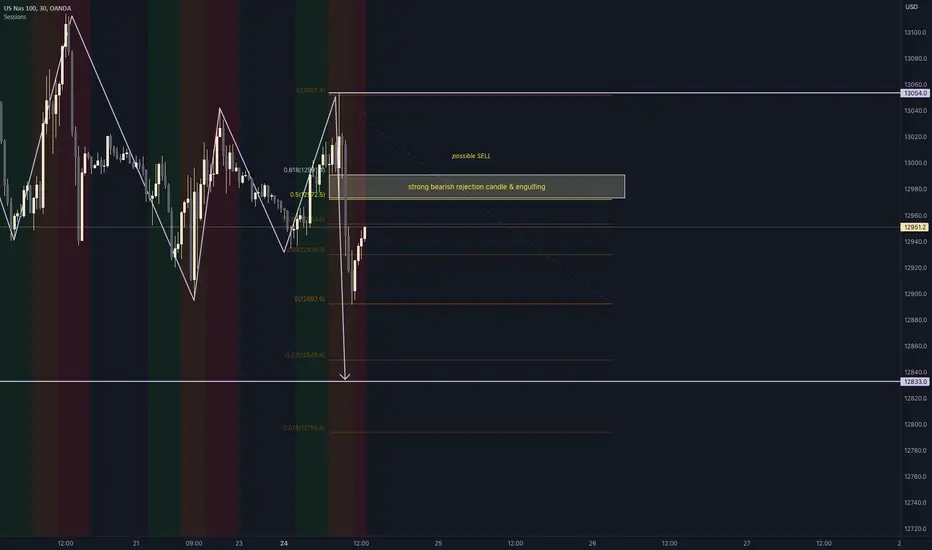
Possible SELL on NAS100Looking for a bearish rejection candle followed by an engulfing candle. If we get our entry around the 50% level then we will place our SL above 61%. If we happen to get our entry at 61% we will place our SL 30 pips above that level.
EURUSD - New Bullish Move !HELLO TRADERS 💖
The EURUSD Broke The Last Higher High (1.09566-1.09734)
Currently, The Price is testing 1.09028-1.09298 Support Level and 0.6 FIB Level for Creating a new Higher Low🔥
if price stays above the key zone, EURUSD can continue the bullish move !
-----------
TARGET: 1.10440🎯
___________
if you agreed with this IDEA, please leave a LIKE, SUBSCRIBE or COMMENT!

ETH NEXT MONTHETH started correction
we may test 0.3 level ang go deeper then might bounce of zone 27 and get back to test zone 0.6 after which go deeper to -0.618
abra cadabra ! BUM!

Algo Bulls Need FuelLooking at Algorand/USDT 4H on Binance, it seems like there is a long road ahead for ALGO bulls.
We see two recent rejects at the .5 FIB / $.24. The retracement found support on the 200MA but the subsequent bounce was unable to fully recapture the .382 FIB at $.225. I'd expect some chop between the 200MA & .382 then a drop down towards $.21.
With the two rejections in place at $.24 and little volume supporting the 200MA bounce, I'm generally bearish in the short & long term on Algo. The volume spike that drove it from $.19 to $.24 seems anomalous and without any real momentum.
Should bulls get the fuel they need from somewhere in the ecosystem, its a tough road towards the long time resistance at $.26 (white line). I'd expect multiple attempts & failures at recapturing that level, especially with the .618 so close to it. With so many other charts & cryptos showing bullish indicators, Algo is a tough technical sell in current form.

BTC | AIM 32K! So, imagine you're a sniper, carefully eyeing your target through your scope. Suddenly, you notice something strange - the movements of your target seem to be following a pattern! You take a closer look and realize it's the Fibonacci sequence!
As any savvy sniper knows, Fibonacci retracements can be a handy tool in trading. So you whip out your Fibonacci tool (which, for the record, looks a lot like a ruler with some fancy numbers on it), and start drawing your lines.
You carefully calculate your entry and exit points, making sure to account for all the Fibonacci levels. And then, just as you're about to pull the trigger (on your trade, of course), your target moves - just like the sequence predicted!
You adjust your aim slightly, recalculating your Fibonacci levels on the fly. And then, with a steady hand and a calm mind, you take the shot.
The market reacts with a satisfying ka-ching, and you walk away with a tidy profit. As you pack up your gear and head off into the sunset, you can't help but think: "Sniping is all about precision and timing - just like trading with Fibonacci retracements!

Next target to $41.09 for Alphabet ?Here is my point of view about Google.
Based on my Elliott Wave, the bear trend could come back the next week (April,17) after the optimistic Bull run from March,13.
We reach the the Fibonacci Ret 0.382% and the ii circle degree seems to be done after a complex correction in ABCDE.
And about the Time the Ret and Projection both are pointing April, 6 and 10.
My concern now it's the indicator DT Oscillator who seem to be not ready for a reversal now.. so it's might be sideway to down the week of April,17 and wait 1 more week to be ready for a reversal during the week April,24.
If this post was useful to you, do not forget to like and comment.❤️ 🙏
Kindly,
TradingX30
Y.F

ES1! Fibonacci LevelsES1! Fibonacci Levels on 6wk horizon. Confluence observed with PA in sustained level between Key SMAS 20, 200. Confluence observed with 0.618 and 0.5 with areas of fair value. Reliability of measure supported using linear regression with pearsons r of 0.97554. A bear flag would be confirmed with breach of sigma 2 :3888.50 and KLs 3973.75, 3515.50 (and rediscovery of September 2022 and October 2020 prices). > 4165.75: 4319.25, 4509 (sigma 1 level confluent with fib 0.236); Where RSI of 54.43 x upward slope supports risk on auction // Price at time of study 4140.25// Upcoming earnings will be factored in alongside economic events, breadth, and treasury market volatility// Bias: Neutral to risk on

QNT multiple indicators pointing to long-term bullish breakoutBINANCE:QNTUSDT
Multiple indicators pointing to a potential price outbreak (long direction).
Head and shoulders
Triangle
Fib retracement (for mid-term projection)
THIS IS TOO RISKY FOR LEVERAGE IDEAS, TRADE ON SPOT AND WITH CAUTION.
NOT FINANCIAL ADVICE.

BTC price target based on 2 ABCs on 4h timeframe2 ABCs on the 4h tf. Targets 100% and 161.8% are closely aligned. That's where I'm targeting.
