EL | This is Ready for a Move Higher | LONGThe Estee Lauder Companies, Inc. engages in the manufacture of skin care, makeup, fragrance and hair care products. It sells products under Estee Lauder, Clinique, Origins, MAC, Bobbi Brown, La Mer, Jo Malone London, Aveda and Too Faced. Its channels consist of department stores, multi-brand retailers, upscale perfumeries and pharmacies, and prestige salons and spas. The company was founded by Estee Lauder and Joseph Lauder in 1946 and is headquartered in New York, NY.
Fibonnacci

EURJPY (BOS + 0.5 DEMAND + 0.5 FIB + IMB)Hello Traders!
Here we have BOS on 1H TF, and the reason of pullback is to mitigate our 0.5 fib level + 0.5 DEMAND and fully close imbalance, after i will wait for confirmation on LTF.
Have a profitable day and don't forget to subscribe for updates!

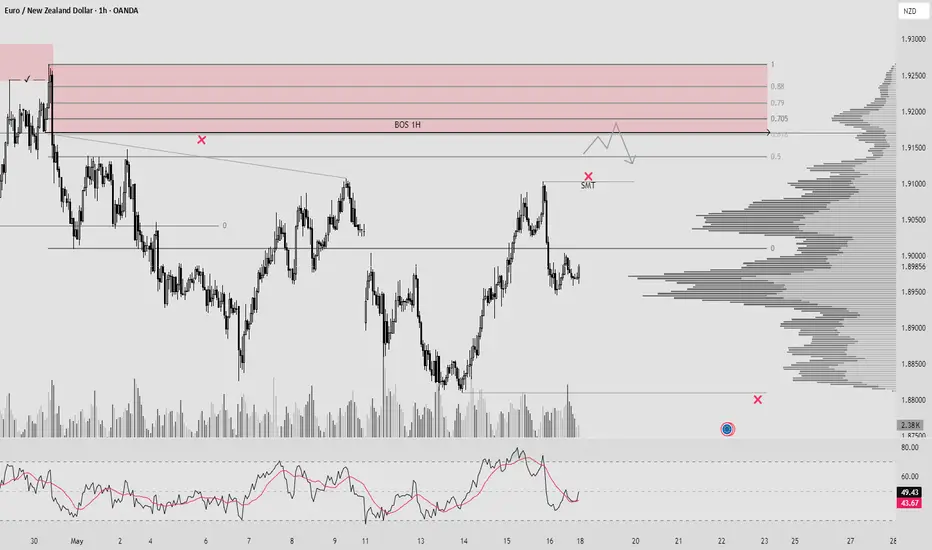
EURNZD (BOS 1H + INDUCEMENT + OTE + SMT + ORDER FLOW) Hello traders!
As you can noticed, we have unmitigated BOS on 1H - which is also our Supply Zone, under zone price built liquidity and make even SMT(Fake BOS). In Supply zone expecting reversal.
Have a profitable day and don't forget to subscribe for updates!
Can $AMC come back to life again? NYSE:AMC is showing some good TA on the weekly and daily chart. We are visiting lows from the past, which reminds me of when I played NYSE:AMC and it visited the COVID lows.
On both the Weekly and Daily we have the MACD in GREEN, RSI crossing MA which the weekly is showing downtrend being broke.
Daily chart Is almost or is right on the 8 day crossing the 21 day EMA. Daily is also breaking the downtrend of ~$4.40 along with breaking the 100 day SMA. Holding VWAP form the low of $2.45 on 4/4/2025.
NYSE:AMC Price as of 5/15/2025: $2.81
Need to see continuation out of the downtrend with volume
Break the resistance level of $2.81 - $2.85, which has the 100 Day SMA around the $2.83 that needs to be cleared.
Then $2.90 - $3.00 and we'll follow the Fib Levels and mark support/resistance levels as we go.
This could get spicy so buckle up knuckleheads!
NYSE:AMC Daily
NYSE:AMC Weekly

AUD/USD 4H | Wave 2 Pullback in MotionAUD/USD is currently completing a corrective Wave (2) within a larger impulsive structure. After the peak of Wave (1) at 0.65145, price has been in a healthy retracement phase, now nearing key fib confluence zones.
🟣 EMA Confluence:
Price is reacting near the 100 & 200 EMA (0.6373–0.6394), which has acted as dynamic support throughout this structure.
We are currently holding above the 0.382 level, with the golden zone (0.618–0.705) sitting just below.
🔄 Bullish Continuation Scenario:
If the pair holds above 0.6285 and we see bullish confirmation candles, we may begin the next leg higher — Wave (3) — targeting 0.66250–0.66766 as initial projection zones.
📊 RSI:
The RSI is hovering just below the 50 level, showing temporary bearish pressure, but has room to recover if structure holds.
🧠 Plan:
📍 Watching 0.6285–0.6214 for final support
📍 Wave (3) target zone: 0.66500+
📍 Invalidation: Clean break and close below 0.6015
🔔 Wave (2) entries are where the patient traders shine. Eyes on structure, and let price do the heavy lifting.
@WrightWayInvestments
@WrightWayInvestments
@WrightWayInvestments

EURGBP - LONG | BUYCALL | Sentiments -Strong Bullish Divergence based on strong sentiments at bullish side and strong bullish divergence, the pair seems to be bullish shortly. Market once breaks the last LH we can enter into the market with defined TPs and SL.
HAPPAY TRADIND GUYZ !

BTCUSD – Multi-TF Bearish SFP & Fib Retrace Before ATH Rebound
Bearish SFP printed on 4H / 8H / 12H / 1D at $103 345 – $104 985 after a parabolic ~$94 k → $104 k run and multiple rejections at $104 k–$106 k resistance.
Trump tariff-cut announcement sparked a sharp spike into resistance that was quickly sold off, confirming heavy supply at $104 k – $106 k.
Baseline plan: drop to 0.786 Fib ~$102 586, then 0.618 Fib ~$100 613, before a push toward the ATH ~$109 588.
Trade Setups
Short – SFP Breakdown
Trigger: 4H close below $103 345
Entry: ≈ $103 300 on retest
SL: $105 500 (above swing high)
TP1: 0.786 Fib ≈ $102 586 RR ≈ 0.7
TP2: 0.618 Fib ≈ $100 613 RR ≈ 2.6
Long – Fib Rebound
Trigger: Bullish reversal at 0.618 Fib / FVG cluster ≈ $100 613
SL: $99 300 (below FVG)
TP1: SFP top / range high ≈ $104 145 RR ≈ 2.7
TP2: ATH ≈ $109 588 RR ≈ 6.8

Nifty Futures.... 25425 on the Anvil ....Lets see.Nifty Futures seem to be moving into stratosphere..... 78.6 Fib the nx tgt. Lets See.
#Nifty #NiftyFutures #markets #Fibonacci

Hind Copper on the Move ??With Copper prices likely to move higher - truce on Tariff, Hind Copper seems to get into an upside mode.Above 21 ema, Jus shy of 50 ema.
Also, i'ts jus kissed the Retracement of around 61.8 & moving higher. Let see.......
#nifty
#Copper
#HindCopper

NZDJPY LONGHey everyone we looking for a long NZDJPY, we were having a uptrend for an quiet a while so this is what i see and why i will taking a buy
1) break and retest to daily support and reject few times
2) reject from a 50% Fib level
3) break our counter trend line on 4h which shows us buyer is taking over
4) shift from bearish to bullish market after break of structure on1h
5) reject Daily and 4h 50 EMA
6) engulfing bullish on 4h
Im aiming 1:2 risk to reward Ratio

SOLANA... The next rising Star.Crossed the 38.2 Fib Rt . All cryptos flying. Lets see.
#Crypto
#Solana
#Bitcoin
#Trading

Due to Geo Political changes in Europe grow expected. These types of rates are always difficult (but fun) to analyze, because there is no history. This one has gone from always low to sky high. But I can still do something with it. You see again, classically according to the Fibonacci model, that the rate has shot up from 400 to 1280, from the blue area straight through the green and yellow. The red area is the outperformance, but you don't know that because you don't know where the rate ends.
You can put a reserve Fibonacci chart against that and then you suddenly see the purple area appear up to 2700. If I subdivide that again, resistance arises on:
1884
2064
2180
2313
2459
2700
The group was promoted to the DAX, Germany's main stock market index, in March 2023. It is the largest German and fifth-largest European arms manufacturer, and produces a variety of armored fighting vehicles and armored personnel carriers, both wheeled and tracked.


Hidden Bullish Divergence +Hidden Bullish Divergence +
Closing above 298 is a +ve sign.
Immediate Support can be around 283 - 287.
Breaking 272 may bring more
selling pressure towards 246 - 250.

GBPUSD Week 19 Swing Zone/LevelsHope y'all had a good weekend with your profits.
This week we go into a slight variation of our winning strategy and ask the question:
what if Retracement is not fixed at the Fib levels but dynamic?
And so whilst keeping the zone and primary values of 279/721, we mark 2 levels and the predicted price reaction around them.
As Always price action determines trades

Tata Motors - Short term target - 850 to 900Tata Motors has formed Shark pattern confirmation.
Based on Fib targets it will have resistance at 850 to 900.
In short term it will have potential to reach 900 with following targets,
700 / 750 / 780 / 820 / 860 & 900.
2 Weekly candle close above 900 will have further potential upside.

Nifty Important Fibonacci levels from previous month closeNifty Important levels for May 2025 from previous Month close price

USDSGD LONG TO 1.36750 WITH GOLDBACH AND FIB BACKING USDSGD with a clean fib structure and looking to target 0.90 retrace in line with a Goldbach retrace to the higher order block zone

LOOKING FOR USDJPY TO TARGET 149.400 Looking for a retrace into 143.9 and then a move to 149.400 weekly and monthly supply .

XAUUSD Analysis: Gold Awaits a Breakout From Downtrend (H4)Currently, gold ( OANDA:XAUUSD XAUUSD) is trading around 2331. On the H4 timeframe, gold remains in a high-efficiency downtrend. However, the market is awaiting a catalyst to trigger a breakout and escape the current stagnation.
A critical support area to watch is around 3310 - 3312, where we see a clear battle between buyers and sellers, as reflected on the H4 candles. This zone could determine the next move for gold.
XAUUSD Intraday Trading Strategy
SELL XAUUSD Entry: 3368 - 3370
Stoploss: 3378
Take Profit 1: 3360
Take Profit 2: 3355
Take Profit 3: 3350
BUY XAUUSD Entry: 3310 - 3312
Stoploss: 3306
Take Profit 1: 3316
Take Profit 2: 3320
Take Profit 3: 3330
Important Notes
-Always set a Stoploss to protect your capital in all trading situations.
-Prioritize trading upon confirmed signals within the analyzed price zones.

Trading the Impulse Rally Retracement — Price and Time Symmetry Fundamental —
Trend is observed from an impulse run’s lowest/highest point and projected outwards in symmetrical fibonacci retracement via price/time from the first reversal candle to the end of the rally, creating crosshairs. These ‘crosshairs’ visually represent the trending ‘price distribution projection’ in price/time symmetry.
Using this concept, I draw a ‘projection trend line’ from the bottom or top of the impulse run thru the projected 78.6% price/time retracement value, to identify the price distribution structure in a linear form.
Now to introduce my STOP LOSS TRIANGLE.
This is a concept of decaying price and time as an underlying move towards our theoretical projection, where if the underlying enters our built faded cross-section, the SL is triggered to avoid sideways consolidation and decaying contract premiums.
This ‘right’ triangle that is ‘sclene’ by nature is created by taking the furthest projection in price/time symmetry (78.6%) and drawing a vertically placed straight line to the highest/lowest point in the rally previously identified. Here, I create a ‘right triangle’ by turning 90 degrees towards my final point, which is made by the nearest projection in price/time symmetry (38.2%). In its entirety, this forms the stop loss triangle

BTC/USDTRight now, BTC is at a crossroads. We've completed the weekly Fibonacci retracement and returned to the main trading zone.
It's crucial to hold the key level at 94,400.
If we succeed, the next target is 99–100K for BTC.
At that point, we should watch for a local correction — we likely won't break through 100K on the first attempt.
Altcoins should also catch up accordingly.
Finally, everything looks nice locally, and it's a good time to start building strong swing positions

Bearish Divergence has appeared.Bearish Divergence has appeared.
Immediate Support lies around
203 - 208
Next Support lies around 178 - 188
Bullish Momentum will resume once
it will cross 222.
