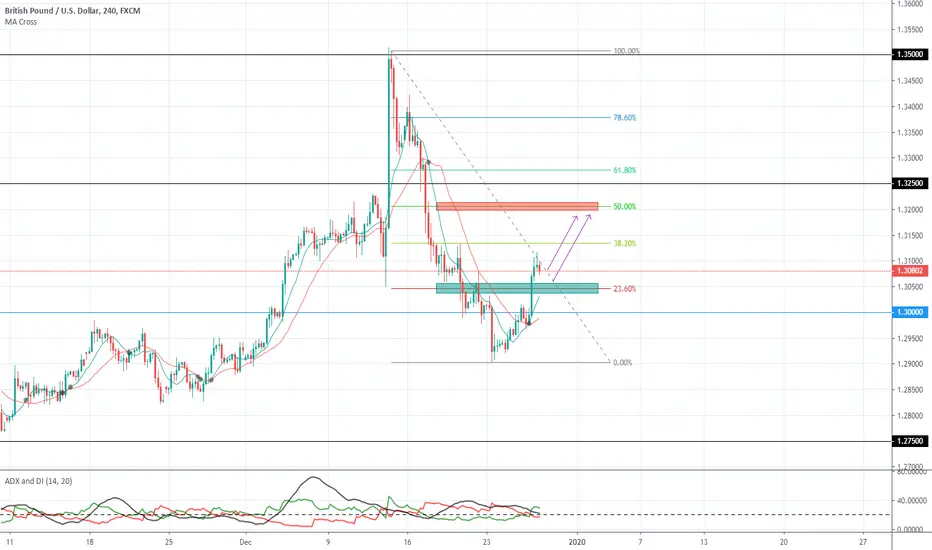
GBPUSD Looking for thar Retracement in H4GBPUSD on a Uptrend Retrace Since Brexit waves came in;
Daily candle above Ichimoku Cloud;
Above 1.2969 Support;
Ma, ADX and Di Cross for the upside;
Cheers,
Kingzman
Fibonnacci

THETA/BTC - GOING TO PUMP SOON!Theta earlier this month before BTC took off had a beautiful breakout of a long term wedge that developed, turns out it was either a false breakout or Bitcoin pushing it back down!
What I see here is a Re-test of the wedge and then this one taking off toward the 61.8 fib level and beyond. Momentum is hooking up and one of my other indicators also caught this and screamed to long. If you see the other calls it made for Theta it does a great job.
Theta for a fundamental side of things is also being featured at SDC19 0 Samsung Developer Program Conference.
They will be featured at the conference to demo integration in smart TVs. Remember THETA was developed with Youtubes Co-creator so they have real connections.
SO you have TA and Pumpamentals aligning!
Trade, Chart, Learn, Repeat!
Coach K
Twitter: @coachkcrypto
Looking to learn from a certified teacher and coach?
Telegram: @coachkcrypto
Send me a message and ill get you started!
Disclaimer: This is not to be taken as financial advice - This is what I am doing

USDCHF Short IDEAUSDCHF is looking great for a sell. We have broken out of the ascednding channel after rejecting a key resistance level. We have now retraced right into the golden fibonnaci pocket. Once we break the corrective pattern i will be looking to go short!

WDP Buying position at 150Hello All,
It looks like the triangle is now broken by the bottom => Short to 150.
Around 150 looks like a good opportunity to had a Long position :
TP 1: 175
TP 2: 189
TP 3: 204
This is just an idea, so if you have some advice please feel free to comment below :)
Thanks,
Mathieu

GER30: Wait for confirmation candle...- Pennant chart pattern formed indicating a bullish continuation of trend.
- Wait for confirmation candle
- On the W1 timeframe price is respecting the 61.8% level
- H1 timeframe is showing an uptrend and price retraced within the pennant.
- We are looking for price to break outside of the pennant and retest it before entering the trade

CAD/JPY Fundamental : Canadian are having an election October 21 that could lead to a weak dollar and Japan have just close a trade agreement with United states that will surely advantage the yen.
Technical : I'am seeing a huge short opportunity on the CAD/JPY pair, I have use the Fib Channel to determine that the short therm uptrend could revers and follow the long therm trend. I've personally enter this position at 81.800 (blue line) where the trend line and the 150 EMA have joint, I haven't put a stop loss but I've put alert 10, 20 and 30 pips higher to make sure that the downtrend is not broke. One of my take profit is 250 pips lower that I think will be touch in the next to days where the Level 0.618 of Fib Retracement cross the 0.236 line of the Fib Channel
Remember, before investing, you should always make your own opinion, this analysis is only my personal point of view and is not a investissent advice.

Consolidation phase for UJBulls eyeing that resistance on the H4. Multiple rejections at that price point due to Fibonnaci 61.8 retracement zone. If the resistance holds, may look for high probability sells.


BTC sill bullish - Actualisation 10/7Second Technical analysis for me !
Today 10/07, actualisation of my ideas from yesterday for BTC/USDT !
On the chart on 1 day, we can see :
- BTC Dominance going higher
- Volume is going hiher
- RSI compare to yesterday
K 20 to 40 : + 20
D 12 to 23 : + 10
Ecart : +10
- MACD
The MACD Cross again the signal line and we can see the first green candle !
BTCUSDT Still bullish today. We are testing the resistance right now and i think will go higher !
Step 1 : 13 880 $
Step 2 : 14 372 $
Step 3 : 14 771 $
Step 4 : 15 169 $
don't forget to put your stop loss very tight !
Only idea, not financial advise !
if you love the idea, don't forget to put a like ;)


EURUSD - EDUCATION - 15. JUNE. 2019DACAPITALTRADING V2.0:
Welcome to DACapitalTrading, We provide any kind of Technical and Fundamental Analysis
for Forex and Crypto-Currency Markets every day!
-
1 HOUR
Very bearish price action on friday with a strong negative closure for last week.
4 HOUR
Pullback after forming a med-timeframe Double top with a strong reaction.
DAILY
Bearish waving market turned bullish with a strong reaction and pullback afterwards.
OVERALL
Bullish market with over 50% Pullback of previous week price action + wave formation,
expecting market to drop below previous week lows and rise very strong instantly afterwards.
Very good setup with high probability, we patient to get good entries next week :)
Good luck
Leave us a comment or like to keep our content for free and alive.
Have a great week everyone!
ALAN

Starbucks - How long will it stay overbought? Using Fibonacci retracement: SBUX next resistance is $85.75 .
If we brake above this line with high volume, it confirms the extended bull trend; meaning we could spend some more time in overbought conditions.
RSI and OBV confirm strong uptrend since July 2018. Check weekly time-frame for a clear view.

GBPJPY Bounced off of monthly counter trendline. Went up to .236 weekly retracement level. Looking for price to bounce off daily trendline and continue to rise. Buy entries at 136.6 & 137.605. TP at 142.55. Long-term to D 61.8 extension TP 159.992.

Bitcoin Key Fibonnaci Resistance LevelWe currently have a neutral view on bitcoin and are currently monitoring the next Fibonnaci level at around 6278. If Bitcoin doesn't rise above this level and consolidate we are expecting Bitcoin to fall towards the previous Fibonnaci resistance level at around 5522 which is now acting as support. Additionally, we are keeping an eye on the RSI which is currently at 76, if it falls below 70 before reversing upward again, but this time remaining below 70 and then the RSI falls again below the prior low this would generate a bearish signal.

TRON: Constructive or ready to CRASH? Multi time frame analysisTron: Which way from here?
*If you find this analysis helpful let me know!
Taking away all emotion and looking at the picture from all time frames this is what I see.
Weekly:
We need to recognise TRON is still very young to look at from a bigger picture but we can start to see some clear structure
We are currently in a broader triangle consolidation so looking for signs of a break either way.
Also had two touches off 52 week moving average BUT failed to react to the downside in a significant manner.
Also holding above the 25% line of blue pitchfork the last two weeks.
What I see as POSITIVE is that TRON bottomed late 2018 (not in 2019) and most cryptos that are recovering/constructive did this.
We are also still above the BLUE 0.618 retracement from this rally off the bottom which is also constructive.
Daily:
Currently stuck between 100 and 200 day moving averages but if you dig deeper there was good support off the 200DMA in terms of volume.
On the daily you can also see the bottom trendline forming triangle has had 4 touches now and failed to break.
For the BEARS however you can see we have not closed above the RED 0.618 fib that is measured from the HIGH forming the top of the triangle and the low.
Again a break of the triangle would show clear direction as these levels are also guarded closely by the fibs.
4HR:
We have just popped outside the near term downtrend.
Also shows clearly the reaction off lower trendline (and 200DMA).
Even if we start pulling back towards the BLUE 0.5 fib I'll watch the RSI and volume to find market direction.
All in all there is potential this is a double top BUT you would need to see some larger downside momentum to validate this. For the BULLS, it's all about the bottom trendline and 200DMA.
If this pitchfork holds you may start to pack your bags to the moon BUT for now it is 100% SPECULATIVE on my behalf until we at least test/surpass the median line (just my rule).
Hope this helps!

AUDUSD SELL SHORT MULTIPLE CONFIRMATIONS!Hi all, AUDUSD is looking very great for a short position to get into on Monday! EMA indicating a downtrend due to price cross, Fib retracement has reached 61.8 as well. Very aggressive bearish movement as well. Catch some PIP$!

ADABTC Bearish Deep Crab - Its time to consolidateADA has made a great bullish move to the upside, filling out the entire equidistant channel in the chart
The parameters for a Bearish Deep Crab have all been met
Point D still needs to be verified by a reversal in price action in the next few days.
Bearish divergence on all time scales up to one day
Plotted targets are your shallow retrace (38.2), moderate retrace (50%), and golden zone (61.8)
The degree of retracement will be influenced by the price action of bitcoin, if there is a big sell off, look for a deeper correction for ADABTC
Thoughts or comments are welcome
Posting these helps me learn, hope others find some value here
Good luck traders

Expecting another leg down for the Aussie dollar- The Westpac Consumer Confidence released by the Faculty of Economics and Commerce Melbourne Institute dropped to -4.8% in March (Previously 4.3% in February).
- On a technical level, the pair just bounced off a major daily S/R level before heading down. We are currently shorting the pair after a small pullback and a rejection of the 0.5 Fib level.
- Entry: 0.70653
- SL: 0.70800
- TP: 0.70287
I will start posting trades as a way to build a personal journal. You should always do your own analysis before entering a trade.

EURUSD Technical BUY1) Fibonacci hit three times on level 38.2%
2) RSI Positive setup
3) MACD Positiv Setup
Will climb at least up to level 61.8%
Note: USD is about to fall, this could help EURUSD to rise fast.

GBPCAD CORRECTION 4HFX:GBPCAD Is doing a correction. The price reached the latest top, GBP strength is high and CAD strength is low. RSI is making a divergence and the price could reach the previous support wave

EURUSD: LongPotential continuation of a long order.
Wait for confirmation candle.
Price has been in a consolidation state holding between support and resistance level.
Bullish candle around resistance level, wait for price to test and retest the resistance level before entering the trade.

USDZAR Target Price 13.31498 R-Multiple 2.50REnter 50% Retracement of Pin Bar. Stop Loss at 1.618 Fibonacci Level Area. Target Price comes in at 13.31498.
