Fibonnacci

Natural Gas Buy Setup Developing
Natural gas has recently fallen down to a confluence area of support. This support area consists of a long term trendline originating from the low in March 2016, a short term trendline, the 61.8 fib retracement of the March 2016 low to November 2018 high and the 3.00 whole number level. Price has been ranging around this area of confluence for several days now, even briefly managing to close above 3.00 before retreating back below it. If price can close above 3.00 again on a daily basis a long position will be entered. Stop will be on a close below 2.80 and take profit at 3.80. Be cautious because the 200 daily moving average sits above price at 3.12 currently, any sign of price reversing at this level and the trade should be exited. A conservative trader may wait until price has closed above the 200 DMA before entering the trade however risk reward starts to become less favourable.
NOTE: This is not recommendation to buy or sell, it is simply for educational purposes.

S&P500 in a Range - Profits! The S&P500 is currently trading in a nice range between 2620 and 2810 points. The Fibonnaci level of 61.8% acted as a really good resistance (triple top). Price just bounced for the third time on the 2620 level and could go back up to 2810. However, if trend reverses and breaks below 2620, we could see a big drop. Also note a little divergence with the MACD; it has a good chance to be corrected on the upside.
I believe that good news from US-China trade and reasonable inflation could give the S&P enough momentum to go back to the upper limit. Watch for fundamental news.

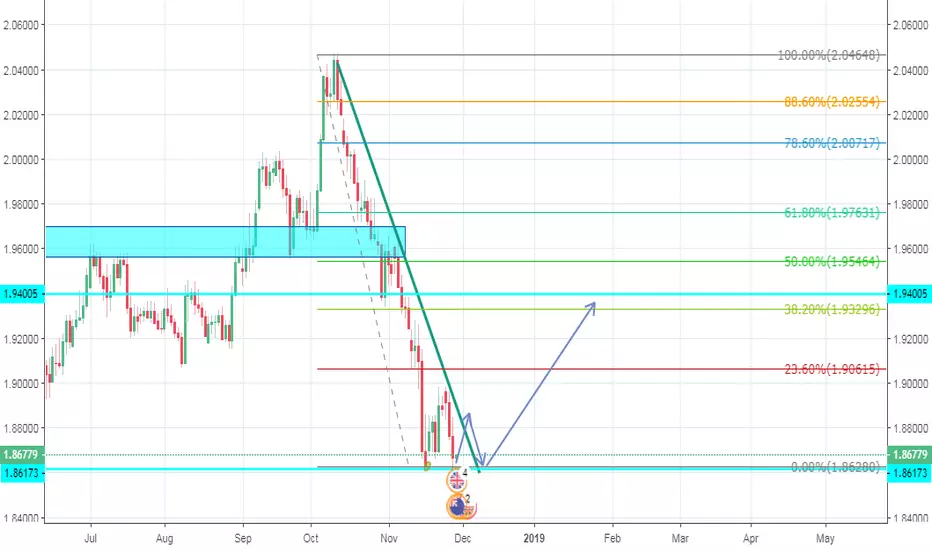
GBPNZD BUY IDEA LONG TERMGBPNZD Daily
In #gbpnzd, we're looking at a buy idea. First off the pair has created a sharp but clear enough downward trendline and started to bottom out at major support of 1.86150. We can see a W or double bottom formation forming, we'll have to see if price breaks out of the trendline and start heading towards the upside or create a third leg and then start flying for hundreds of pips yet it is still early for it. When we place our fib from the high to the low, there is a sight resistance at the 38.2 point of the fib. we could see price hit that and consolidate for a bit or start dropping.
When the pair starts to create more and more confirmations I'll call it out in the telegram channels and our Instagram.
instagram: @lehforex
telegram: t.me


EURUSD SHORTWill probably exit at the 23.6 fib retracement since it is in conjunction with the key level. A simple look at the lower timeframes will expose exhaustion also. Just my analysis. All trades are actually taken.

USDCHF COMPRA1º Podría retroceder hasta el nivel 38,20 o nivel 50 del Fibonnaci y formar el canal de tendencia de subida hasta 1,0038 aproximadamente o la resistencia en 1,0053 aproximadamente.

Dow Jones + The rest of the worldThese are my views on why the Dow has probably topped out.
All markets tend to follow the US markets which is why a crash in the Dow Jones will likely result in a crash worldwide.
My arguments are presented below:
FA:
- Longest bull market recorded in history
- US debt is worrisome +21B debt (dollar in trouble?)
- Private debt ATH (particularly US student loan debt is worrisome)
- Enormous geopolitical concerns (need I specify?)
- Severe overvaluation of stocks
- Interest rates have been on a steady rise
- US imposing Tariffs
TA (see chart):
-Fibonacci resistance fan is hit every time a major crash has occurred since the crash of 1987 (confluence - see below)
1. Big Volume drop
2. RSI massively overbought (usually happens before crashes, see the downward trend)
3. VIX topped out (usually does before crashes)
This is not financial advice - DYOR
Yours truly //Pman

Trading opportunities Volkswagen - Symmetrical triangleVolkswagen currently moving in a symmetrical triangle, multiple trade opportunities available;
- Short 0.768 fib
Entry: ~€151
Target: ~€142
Stop: €152-€153
- Long 0.382 fib
Entry: ~€142
Target: ~€148
Stop: ~€140
- Short/Long breakout of triangle
Target break upwards: €168
Target break downwards: €122

GASBTC Daily Chart with Fibonacci RetracementsDaily Setup for GAS/BTC via Binance.
We a sitting around weekly lows, which seems like a good time to start to accumulate at these lower levels.
coinmarketcap.com
neo.org
$6.19 USD (10.06%)
0.00094059 BTC (10.52%)
0.34447083 NEO (11.38%)
Share
Watch
Market Cap
$62,679,747 USD
9,527 BTC
3,488,930 NEO
Volume (24h)
$1,629,931 USD
247.73 BTC
90,726 NEO
Circulating Supply
10,128,375 GAS
Total Supply
17,190,378 GAS
Max Supply
100,000,000 GAS

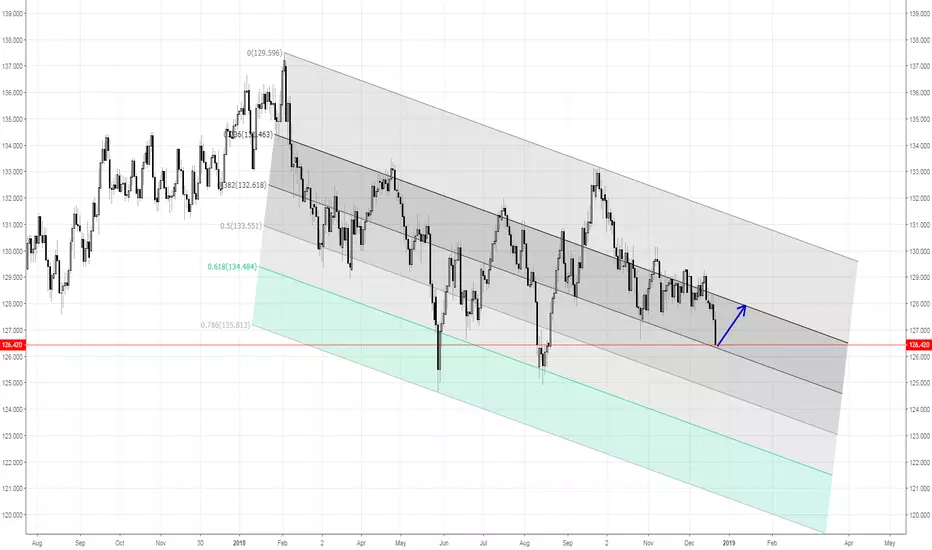
USDJPY II/279FX:USDJPY Levels to watch #USDJPY #MinorPullback #BearishCrab #FX
USD/JPY Technical Levels
Resistance: 113.75 (December 2017 high), 114.74 (November 2017 high), 115.00 (psychological hurdle)
Support: 113.20 (200-week MA), 112.66 (10-day MA), 111.12 (August high)
FXStreet

Nintendo Correction OverNintendo finished its ABC correction and has begun a new impulse wave. Breakout above bull flag confirms uptrend. MACD formed a bullish cross over and the Stoch is trending up. RSI is approaching oversold on the daily, so there may be a slight pullback in the near future, but its still < 50 on the weekly. First target is the 78.6% fib, which was a previous support level. This is about $49 - $50. Next is the 100%, ie the previous high, at about $57.
My opinion not financial advice

BTC Existing Trend Possible Outcomes So I think we will see a retrace to the 20 and 50 MA or the 31% fibonacci retracement which support is the strongest even though these 3 levels are very close to each other around the 6560-6630 levels. From there we will go back up to test this resistant point again at 6730. If we have a convincing breakout from there which I am fairly confident that we will, we will then test the 61-62% fibonacci retracement level around the 6900 levels. If we see enough volume pile up at the 6730-6750 levels again whenever we are testing it again then this is a good sign we could breakout from this level and test the 62% retracement. If we enough volume at the 6900 levels(62% retracement from previous rally) then this is also a good sign we could test the falling wedge upper trendline. From there we are most likely to fall back down and test the 62% level as a support. If that holds and we go back up we will probably break that falling wedge upper trend line which is a humongous bullish signal if done in a convincing manner. From there we will test the 200 MA and probably get rejected if volume is not out of this world. From there we will then test the upper trend line again as resistance turned into support.
Save 10% on fees at Bitmex if you use this referral link:
www.bitmex.com
Please like, follow, and comment with your idea below!
Thanks,
Chris

EJ (EUR/JPY) at 0.5 fib levels daily waiting for the Breakout b.
EJ EJ (EUR/JPY) at 0.5 fib levels daily waiting for the Breakout b.o. at it's current price to make the higher high,economic calendar releases can affect this currency as news too.
Indicators and Oscillators are signalling that i's on ob levels or over bought levels in my DeMarker, Macz-Vwap and Rsi-Ema, it's above my sma & ema levels, including my atr's stops and bb-emas.
V9 fractals showing patterns, tux ema scalper and psar good for signalling of the b.o breakout in it's currrenct price may pullback beyond the 0.5 fib levels in higher highs and lower lows

GBPUSD - The pair failed to break out the downtrend lineGBPUSD failed to break out the trend line which may significate that the price will at least reach the Fib 50 around 1.2965.
More over on H4 we can notice that the forming rising wedge is being broken down by the price. All these information can reasonably give us confidence that the price will continue its fall.
Trading idea:
Sell GBPUSD
E: 1.3060
SL: 1.3150
TP1: 1.2970
TP2: 1.2930

Gold/ XAUUSD DAILY Hi Guys,
For my XAUUSD analysis I used cypher patterns, Fibonacci retracement and extensions to determine whether this trade is a bullish or bearish trade.
My conclusion is that it is a bullish trade that has the potential to reach 1223 mid-October

Gold is ready to rally - Short Covers & Elliott WavesInstitutional investors are getting ready to take profit and cover their shorts on gold. Price could spike.
Price is hitting a strong resistance and about to cross the 180 days MA. If break is confirmed, a safe entry is possible. Based on my wave count and aggressive method, I'm aiming for entry at the1195. I believe we could reach the 1225 resistance level before another pullback.

USD/CAD - Technical AnalysisAnalysing with Ichimoku clouds has given me the impression bearish sentiment is going to continue on this pair.
Strong sell signal from a bearish kumo twist and kumo breakout, labelled in the chart.
A TK death cross has also appeared following the kumo break out.
Recent low is at 1.28863. My fibonnaci level show price has violate the 50.0 mark and will continue to descend until 61.8.
Alligator indicator also show bearish sentiment
If Price violates 4H candle low, expect downtrend to strengthen and bearish kumo clouds to expand

BUY D1 CHFJPY 158pips? Its looking like a bullish D1 BAT on here ?
We may be looking at reversal to the upside in most JPY pairs in next few days. If it is, CHFJPY is going ahead.
Follow @bizlus
Remember to trade your plan

USDCAD 4H SHORT / 61.8 / Trendline We're still waiting to break our wedge on the daily. We're hoping this initial position will bring us to the break to provide us with a tremendous risk to reward.

BTC/USD Fibonnaci 30 min chart Chart the S&R wait for breakdown look for confirmation in your indicator and oscillator rsi,macd,macz,vwap,stochastic,demarker etc.
