IPH 40% move coming?IPH has recently emerged from a descending wedge pattern, supported by bullish divergences in both the RSI and OBV, along with several divergences observed in shorter time frames. A pullback to the $5 level is anticipated, as the stock appears weaker on these smaller time frames. If IPH can maintain its position above the recent low of $4.40, it will indicate a structural shift, establishing higher highs and higher lows. My initial target is in the $6.50 range, followed by a potential move just above $7, representing a 40% increase. Good luck and happy trading 🍀
Fibretracement

Bearish Retest Setup After BreakdownPrice broke down from the recent bounce and lost the 0.098–0.101 zone, which lined up with the 23.6–38.2 fibs. That area is now likely to act as resistance. Momentum is still bearish. MACD histogram is red and expanding, and no signs of reversal yet. On the daily timeframe, MACD has just started to cross bearish, which adds weight to the downside bias.
If price retests that 0.098–0.101 area and shows weakness (like rejection wicks or small-bodied candles), it’s a clean short opportunity. First target would be the recent low around 0.092, and if that breaks, the next key level is 0.077.
Any push above 0.102 would invalidate the setup for me.

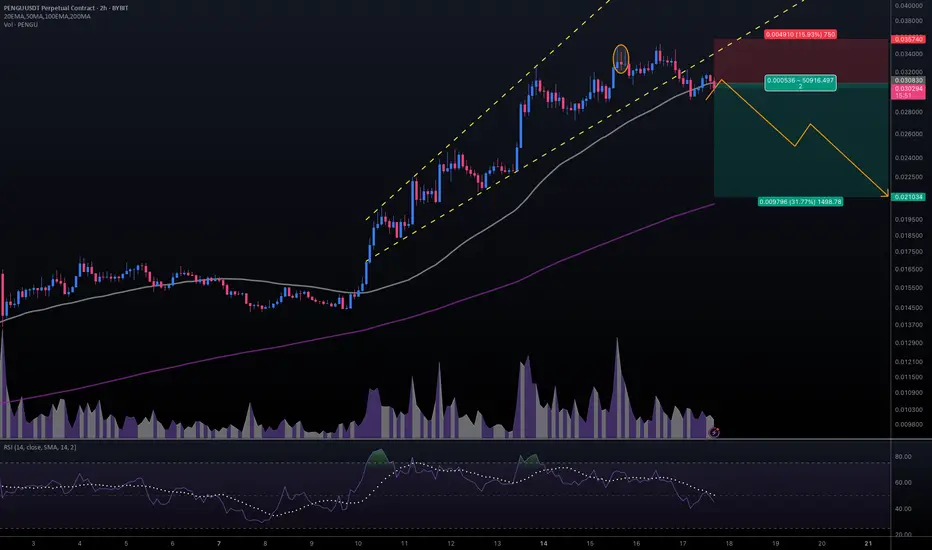
#PENGUUSDT #2h (ByBit) Broadening wedge breakdownPudgy Penguins printed an evening star then lost 50MA, seems to be heading towards 200MA support next.
⚡️⚡️ #PENGU/USDT ⚡️⚡️
Exchanges: ByBit USDT
Signal Type: Regular (Short)
Leverage: Isolated (2.5X)
Amount: 5.0%
Entry Targets:
1) 0.030830
Take-Profit Targets:
1) 0.021034
Stop Targets:
1) 0.035740
Published By: @Zblaba
CSECY:PENGU BYBIT:PENGUUSDT.P #4h #PludgyPenguins #Meme pudgypenguins.com
Risk/Reward= 1:2.0
Expected Profit= +79.4%
Possible Loss= -39.8%
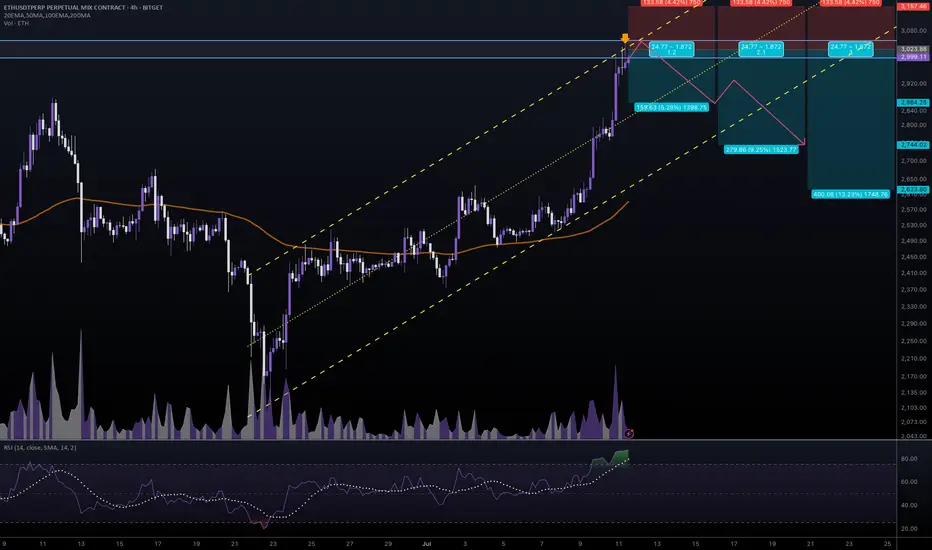
#ETHUSDT #4h (Bitget Futures) Ascending channel on resistanceEthereum printed a gravestone doji followed by a shooting star, RSI is overbought, local top seems in.
⚡️⚡️ #ETH/USDT ⚡️⚡️
Exchanges: Bitget Futures
Signal Type: Regular (Short)
Leverage: Isolated (9.0X)
Amount: 5.0%
Entry Zone:
2996.99 - 3050.49
Take-Profit Targets:
1) 2864.25
2) 2744.02
3) 2623.80
Stop Targets:
1) 3157.46
Published By: @Zblaba
CRYPTOCAP:ETH BITGET:ETHUSDT.P #4h #Ethereum #PoS ethereum.org
Risk/Reward= 1:1.2 | 1:2.1 | 1:3.0
Expected Profit= +47.5% | +83.3% | +119.0%
Possible Loss= -39.8%
Estimated Gaintime= 1-2 weeks
#BCHBTC #1W (Binance) Big falling wedge breakoutCRYPTOCAP:BCH just regained 50MA weekly support in sats, performing better than CRYPTOCAP:BTC
Seems likely to continue bullish towards 200MA resistance, probably after a pull-back.
⚡️⚡️ #BCH/BTC ⚡️⚡️
Exchanges: Binance
Signal Type: Regular (Long)
Amount: 7.0%
Current Price:
0.004885
Entry Targets:
1) 0.004657
Take-Profit Targets:
1) 0.006329
Stop Targets:
1) 0.003987
Published By: @Zblaba
CRYPTOCAP:BCH BINANCE:BCHBTC #BitcoinCash #PoW bitcoincash.org
Risk/Reward= 1:2.5
Expected Profit= +35.9%
Possible Loss= -14.4%
Estimated Gaintime= 4-7 months

TUBE INVEST OF INDIA at Best Support This is the 4 hour Chart of TIINDIA.
TIINDIA is holding within the Fibonacci retracement golden zone.
If this level is sustain , then we may see higher prices in TIINDIA.
Thank You !!

MCX - 5-Wave Impulse Complete, Correction Ahead?The recent price action in MCX has completed a 5-wave impulsive sequence, giving us valuable insights into potential upcoming moves.
The Larger Picture (Daily Timeframe) :
Starting from the prior major low, we have witnessed a clean impulse structure unfolding.
Wave 3 topped at 7,048.60, completing its previous impulse sequence.
Following this, a textbook ABC corrective structure unfolded into Wave 4, completing near 4,408.15. The internal symmetry within this ABC correction was near perfect, with Wave C nearly matching Wave A (100% projection).
Post Wave 4, the price resumed higher into Wave 5, where we now observe signs of completion.
Wave 5 Extension and Target Zone
Wave 5 extended strongly and has already entered its projected target zone:
100% projection of Wave 1 placed near 8,330.
1.618 extension projection reached near 8,922.
Ideal Correction Zones
Now that Wave 5 may have completed or is very close to doing so, we shift focus to probable retracement areas where price may find support in case of a corrective phase:
0.382 retracement at 6,853.50
0.5 retracement at 6,386.60
0.618 retracement at 5,919.65
Dynamic Update Note
The correction zones have been plotted based on the current observed Wave 5 high. Should Wave 5 extend further, these support levels will be recalculated accordingly. Traders are advised to keep monitoring for further price action confirmation before positioning.
The overall Elliott Wave structure here reflects the market may now enter a corrective phase as per standard wave behavior after a completed 5-wave advance.

Is Altseason Around the Corner? BTC.D looks tired AF!BTC dominance just hit the top of a rising wedge that has been building for over a year. Price is stalling at 65.64 percent, sitting right against long-standing resistance.
Momentum is weakening. Stochastic RSI is at 72 and starting to roll over. RSI is sitting just under 70 and showing early signs of fading.
The structure suggests we are close to a decision. If BTC dominance starts to fall from here, the conditions for an altcoin run are in place.
Key levels to the downside are already mapped. First is 59.97 percent. Then 58.70 percent. After that, 56.88 percent. The 100-week simple moving average is also sitting at 56.51 percent. If dominance breaks below that level, it opens the door for a larger shift in market flow.
Previous retracements in BTC dominance have aligned with strong moves in altcoins. This current setup is technically clean and nearing resolution.
It is not confirmed yet, but the signals are starting to stack. This is a moment worth watching.

#XRPUSDT #4h (Bitget Futures) Descending channel near breakoutRipple just printed a dragonfly doji resting 50MA regained support, looks ready for short-term recovery.
⚡️⚡️ #XRP/USDT ⚡️⚡️
Exchanges: Bitget Futures
Signal Type: Regular (Long)
Leverage: Isolated (8.0X)
Amount: 5.2%
Entry Zone:
2.2438 - 2.2088
Take-Profit Targets:
1) 2.3535
2) 2.4493
3) 2.5450
Stop Targets:
1) 2.1199
Published By: @Zblaba
CRYPTOCAP:XRP BITGET:XRPUSDT.P #4h #Ripple #MadeInUsa xrpl.org
Risk/Reward= 1:1.2 | 1:2.1 | 1:3.0
Expected Profit= +45.7% | +80.1% | +114.5%
Possible Loss= -38.2%
Estimated Gaintime= 1-2 weeks

XAUUSD Bearish Setup! OB Rejection + FVG + 61.8% Fib PremiumGold (XAUUSD) | 4H Chart – High-Probability Bearish Setup
XAUUSD is setting up for a bearish move as price taps into a premium zone confluence, including an Order Block (OB), Fair Value Gap (FVG), and a 61.8% Fibonacci retracement. Smart Money Concepts (SMC) traders will recognize this setup as a textbook scenario for a bearish continuation toward a Weak Low target.
🔍 SMC Breakdown:
Market Structure:
The market has shifted bearish after breaking the previous low and forming a lower high. The internal structure confirms bearish order flow, giving us confidence in continuation to the downside.
Liquidity & Inefficiency Play:
Recent sweep of buy-side liquidity above minor highs.
Rejection at premium pricing indicates Smart Money has triggered sell programs.
Internal liquidity pools were engineered and swept, confirming manipulation.
Entry Confluence Zone (Kill Zone):
🔴 Order Block (OB):
3,372 – 3,380 — bearish OB formed before strong impulse move.
🟣 Fair Value Gap (FVG):
Perfect overlap with the OB, leaving a gap that price has now rebalanced into.
📐 Fibonacci Levels from Swing Low to High:
61.8% = 3,373
70.5% = 3,377
79% = 3,380
This entire zone aligns with institutional premium pricing — the high-probability reversal range.
📉 Bearish Projection:
Expecting price to reject from OB/FVG zone and move toward the discount zone, targeting unmitigated lows and imbalance fills.
Key Downside Targets:
50% = 3,368
Full Extension = 3,333 (Aligned with Weak Low)
This level also sits near the 0.00% Fib level — a clean liquidity magnet.
🧠 Chart Ninja Entry Plan:
🔹 Entry: 3,373 – 3,380 (OB + FVG + Fib Premium)
🔻 Stop Loss: Above 3,381 (invalidate OB)
📉 Take Profit: 3,333 (Weak Low + Fib Completion)
⚖ RRR: ~1:4+ — high-confluence sniper setup
💬 Ninja Wisdom:
You're not trading random candles — you're trading intentional liquidity shifts.
This setup screams Smart Money footprint: OB rejection + inefficiency fill + premium pricing.
Be the sniper — not the trigger-happy retail trader. 🥷🎯
📍 Save this setup before it plays out — backtest and learn from it!
🔁 Drop your analysis below – agree or see it differently?
👣 Follow @ChartNinjas88 for daily institutional-grade setups on Gold & more!

USDJPY Pullback? Watch OB + Fib Confluence for the Next Buy WaveUSDJPY | 30-Min Chart – Smart Money Buy Setup in Progress
After a sharp bullish rally, USDJPY is setting up for a classic retracement buy scenario. We're now watching a key confluence zone between Fibonacci levels, a bullish order block, and internal trend structure — all lining up for a high-probability long setup.
🔍 Trade Breakdown:
📉 Pullback Expected Before Next Rally:
Price rejected near short-term resistance and is retracing from local highs.
Retracement aligns with key OB + 61.8–79% Fib zone = institutional entry zone.
🟣 Order Block (OB) Demand Zone: 143.086 – 142.828
Last bullish candle before explosive rally = demand OB.
OB sits within premium Fib retracement = Smart Money buy zone.
📐 Fibonacci Levels (Swing Low to High):
61.8% ≈ 143.200
70.5% ≈ 143.000
79% ≈ 142.828
This is the kill zone for institutional longs — where Smart Money typically enters before expansion.
🔵 Projected Play:
Retracement to OB/Fib confluence.
Bullish rejection from OB zone.
Impulse move targeting previous highs and beyond.
💡 Target Level: 144.396 (sits just above prior high and aligns with -27% Fib extension)
📉 Current Bias:
Short-term retracement ➝ Mid-term bullish continuation
Expecting price to dip into OB then launch.
🧠 Chart Ninja Entry Plan:
🔹 Entry Zone: 143.086 – 142.828
🔻 SL Below: 142.650 (below OB/Fib + structure wick)
📈 Target: 144.396
⚖️ RRR: 1:3+ — high confluence risk-managed buy
🔍 Technical Confluence Checklist:
✅ OB demand zone
✅ 61.8–79% retracement
✅ Bullish market structure
✅ Internal channel support
✅ Momentum slow before entry
📍 Save this chart — don’t chase, let price come to you
💬 Comment if you're watching this OB too
👣 Follow @ChartNinjas88 for precision-based setups daily

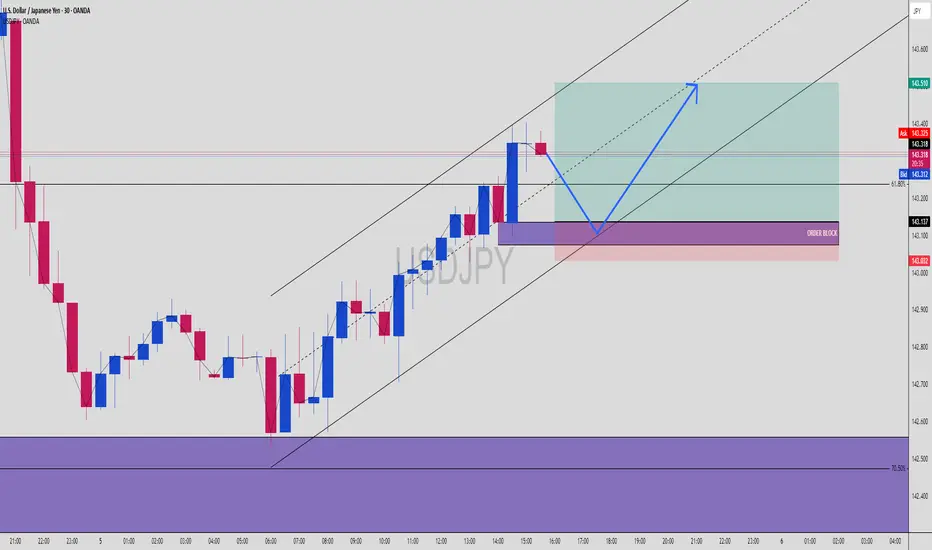
USDJPY Buy Setup! OB + 61.8% Fib + Trend Channel ConfluenceUSDJPY | 30-Min Chart – High Probability Buy Setup in Progress
USDJPY is currently respecting a bullish market structure within a well-defined ascending trend channel. Smart Money Concepts (SMC) traders are watching for a precise reaction at the confluence of a key Order Block (OB), Fibonacci retracement levels, and mid-channel support.
🔍 Trade Breakdown:
Bullish Market Structure
Price has shifted from bearish to bullish after forming a key higher low and continuing with higher highs within the trend channel. The structure is being respected with multiple taps on both upper and lower channel boundaries.
Internal Liquidity & Order Flow:
Price previously swept sell-side liquidity below the recent swing low and sharply reversed, confirming internal liquidity engineering and institutional involvement.
Currently, we’re seeing price stall after rejecting the upper channel and OB zone. A retracement into the discount zone is anticipated before continuation.
🟣 Order Block Zone (OB): 143.032 – 143.137
A clear bullish OB formed after a strong impulsive move, marking the last down candle before the bullish break of structure.
Located just above the 61.8% Fibonacci level — strong confluence.
📐 Fibonacci Levels from Last Swing Low to High:
61.8% = 143.137
70.5% = 143.032
Potential reaction zone aligns perfectly with OB + trendline + psychological round level (143.000 area)
📊 Buy Setup Expectation:
USDJPY is expected to retrace into the OB/Fib confluence zone before a bullish continuation toward the upper boundary of the trend channel and beyond.
🔵 Projected Path:
Price dips into OB → reacts to 61.8–70.5% retracement → bullish reversal → break to fresh highs near 143.510 or higher
🧠 Chart Ninja Entry Plan:
🔹 Entry Zone: 143.032 – 143.137 (OB + 61.8–70.5% Fib)
🔻 SL Below: 143.000 (beneath OB and psychological level)
📈 Target: 143.510 (channel top + previous supply zone)
⚖️ RRR: Approx. 1:3+ — high precision Smart Money entry
💬 Ninja Wisdom:
Patience before profit. Wait for price to return to the zone where institutions left footprints — the OB at equilibrium pricing. Combine OB + Fib + channel and you're trading like the banks.
Retail buys the breakout. Smart Money buys the pullback. 🥷📚
📍 Save this chart before the setup triggers!
🧠 Do you see the same confluence? Comment your entry/TP/SL plans ⬇️
👣 Follow @ChartNinjas88 for more sniper setups on major FX pairs every session!
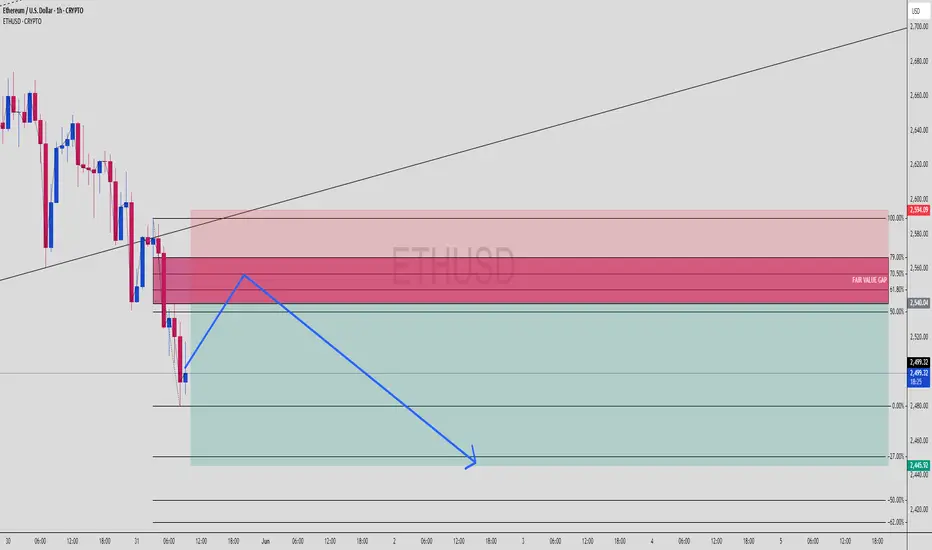
ETHUSD Bearish FVG Play | Premium Rejection Loading?Ethereum (ETHUSD) 1H Smart Money Bearish Setup | FVG + Fib Confluence
Textbook short scenario lining up on ETHUSD as it retraces into a premium zone filled with imbalance. Let’s unpack the key ingredients of this setup for the squad.
🔍 1. Trade Idea Summary
Price dumped sharply, leaving a clean Fair Value Gap
Retracement into premium (Fib 61.8%–79%) zone
Confluence of:
✅ FVG Supply
✅ Fib retracement zone
✅ Internal structure breaker
Targeting sell-side liquidity near 2,445 for a smooth RR 1:3+ setup.
📊 2. Key Zones on Chart
Entry Zone: 2,540 – 2,590 (FVG + 61.8%–79% Fib)
Strong High for Sweep (if needed): 2,594
TP Zone (Sell Side Liquidity): 2,445
SL: Above 2,600
🧩 3. Smart Money Concept Breakdown
Market made a lower low ➝ bias shifts bearish
Now retracing into the last up candle before the dump (FVG zone)
Expecting:
Premium rejection
Lower time frame CHoCH
Push to sell-side liquidity
⚙️ 4. Execution Plan
Let price enter FVG zone
Wait for M5 or M15 bearish break of structure
Confirm with:
OB rejection
Entry confirmation candle
Ride it down to TP or trail SL at midpoint
💡 5. Trader Tips:
Watch volume drop as price enters FVG — sign of weak buyers
Don’t force entry — let structure confirm
⚔️ Comment "ETH Breakdown 🔪" if you're eyeing this short
📈 Save this setup & follow @ChartNinjas88 for real-time sniper breakdowns
🎯 DM “TRADE” for access to my sniper SMC playbook
#BTCUSDT #4h (Bitget Futures) Ascending trendline breakdownCRYPTOCAP:BTC lost 50MA that may act as resistance now, retracement down to 200MA support seems next.
⚡️⚡️ #BTC/USDT ⚡️⚡️
Exchanges: Bitget Futures
Signal Type: Regular (Short)
Leverage: Isolated (19.0X)
Amount: 5.0%
Current Price:
107480.5
Entry Zone:
108234.7 - 109274.5
Take-Profit Targets:
1) 106010.9
2) 103944.6
3) 101878.3
Stop Targets:
1) 111050.5
Published By: @Zblaba
CRYPTOCAP:BTC BITGET:BTCUSDT.P #4h #Bitcoin #PoW bitcoin.org
Risk/Reward= 1:1.2 | 1:2.1 | 1:3.0
Expected Profit= +47.9% | +84.0% | +120.1%
Possible Loss= -40.1%
Estimated Gaintime= 1-2 weeks

Buy AMARA RAJA For Long Term With Target of 3000 Amara Raja Finished Its Correction As Per Fib Retracement
Buy Amara Raja For Long Term

CHFJPYPrice has been making consistent HHs & HLs on H4. I'll continue looking for buys as long as price respects the support at 169.750.

AUDNZD SELLSPrice looks bearish. The overall target would be 1.09151 but, price would have to break below the H4 support.

AUDJPY SELLSOANDA:AUDJPY can definitely sell off to the 93.250 area. Daily double top, daily 61.8% retracement and H1 support broken. I'd look for price to make another LH before entering sells.

COIN 6/20 340C'sFilled at 1.95 avg this idea is a fib setup. We have a nice double bottom on the daily inside the golden zone. Targeting the -2.36 (424-429 area) which is in the area of ATH's as well as weekly sellers.

RUSSELL 2000 failed breakout and consolidation We are back in this blog space after a couple of days holiday. The RUSSELL 2000 ETF AMEX:IWM failed at the same price point which it failed back in Nov 2021. It seems Price having a memory. It failed at the same price it failed in Nov 2021. After it failed from the top on 16th Dec 2024 it has recently retraced back to the 0.236 Fib retracement level @ 2237. It has been consolidating at that level and if it breaks down then the next support is @ 2167 .
Before the AMEX:IWM breaks out form this pattern it has to complete the wedge forming consolidating pattern. In my opinion the direction will be decided by the TVC:US10Y . As long as the TVC:US10Y stays below 4.5% the AMEX:IWM can consolidate here and then my break upwards as long as the bull market remains intact.
Direction of AMEX:IWM will be determined by TVC:US10Y

#BTCUSDT #4h (Bitget Futures) descending channel breakoutBitcóin just regained 20EMA support, printing a three-white-soldiers pattern. Looks good for bullish continuation from here.
⚡️⚡️ #BTC/USDT ⚡️⚡️
Exchanges: Bitget Futures
Signal Type: Regular (Long)
Leverage: Isolated (10.0X)
Amount: 4.9%
Entry Zone:
98356.7 - 97312.9
Take-Profit Targets:
1) 102615.4
1) 106215.9
1) 109816.3
Stop Targets:
1) 93834.3
Published By: @Zblaba
CRYPTOCAP:BTC BITGET:BTCUSDT.P #4h #Bitcoin #PoW bitcoin.org
Risk/Reward= 1:1.2 | 1:2.1 | 1:3.0
Expected Profit= +48.9% | +85.7% | +122.5%
Possible Loss= -40.9%
Estimated Gaintime= 1-2 weeks

$MSFT short term consolidation within a upward trending channelNASDAQ:MSFT stock price has stagnated since Aug 2024. Since hitting a peak of $ 468 in July 2024 the NASDAQ:MSFT stock has been consolidating sideways. But the stock is still within the upward sloping channel in a weekly price chart. We are bullish if the price is above the midpoint of the upward sloping regression channel which lies $380.
We should remember from Louis Yamada that ‘The bigger the base, the higher in space’. So, the consolidation in NASDAQ:MSFT can result in a major breakout. The daily Fib retracement of 0.236 lies $ 406. Accumulate NASDAQ:MSFT between $406 and $380.

#ZECUSDT #1h (ByBit) Falling broadening wedge breakoutZcash regained 50MA support and broke out bullish on hourly, looks good for short-term recovery towards 200MA resistance and more.
⚡️⚡️ #ZEC/USDT ⚡️⚡️
Exchanges: ByBit USDT
Signal Type: Regular (Long)
Leverage: Isolated (10.0X)
Amount: 4.8%
Current Price:
49.41
Entry Targets:
1) 48.62
Take-Profit Targets:
1) 52.63
Stop Targets:
1) 46.61
Published By: @Zblaba
$CRYPTO:ZEC BYBIT:ZECUSDT.P #Zcash #Privacy z.cash
Risk/Reward= 1:2.0
Expected Profit= +82.5%
Possible Loss= -41.3%
Estimated Gaintime= 2-3 days
