MATIC climbs the uptrend line.As you can see in the chart, MATIC has built a local growth channel and is waiting for the general market movement that depends on BTC. MATIC is a solid project in the second layer of ETH worth observing.
Fibretracement

The CRO maintains a local growth channel.The CRO maintains a local growth channel. He created the 2 closest supports at a price of $ 0.4103 and $ 0.3908. It is a very good project that is developing strongly, it is worth looking at it in the long run.

SOL has created a downward channel.SOL has created a downtrend channel in which the price is currently moving. It broke previous support to $ 98.80. The support line is around $ 72.8 at the 0.786 Fib Retracement level, the first resistance is around $ 110 and the second is around $ 138.7.

ETH drops to around 0.786 Fib.ETH is approaching an important support zone that would have to hold the price. Currently, the price is stagnating around $ 2,500. The next support is 0.786 Fib Retracement. Big drops in BTC are also reflected in ETH.

XLM is about to leave the triangle.XLM is struggling to maintain the $ 0.24 level. We approach the exit of the triangle, we should observe the direction in which we leave the designated zone. Another support at $ 0.20. in the case of a downward move. If the XLM begins to gain strength, it may attack the price of $ 0.275.


EURCAD Bearish Divergence, yet Longing Chances Too 07/02/2021 this instrument has got two scenarios
seem bearish to our eye as it has done its Distribution after showing some Regular Bearish Divergence with MACD which is the sign of trend reversal and a retracement unto the Fibonacci Golden areas but it is conditioned to break the blue trend line and if so the we can have our 2 bearish TPs...
if not
then we have the Bullish scenario which we can target Minimum of 1.71 CAD of our Fibonacci expansion .27% where we have specified it as Long TP.
Remember it is on the Weekly time frame so we may need to be more focused on fundamental of the market to get the grip of our Final decision and use the technical chart as a confluences along with it...
we are having mostly Bearish sentiment on this but we kept the Bullish back door open yet
which side do you think it goes?

Nifty analysis with Time Speculation D, Appendixthis is an appendix to the
please return to this analysis after watching the said analysis video for specified dates and Said Prices

$GTC/USDT 4h (Binance Futures) Falling broadening wedge breakoutGitcoin bounced several times on 200MA support and seems ready for recovery now, let's enter on the retest.
Current Price= 12.501
Buy Entry= 12.150 - 11.114
Take Profit= 14.921 | 18.030 | 22.997
Stop Loss= 9.433
Risk/Reward= 1:1.5 | 1:2.91 | 1:5.17
Expected Profit= +28.28% | +55.00% | +97.70%
Possible Loss= -18.90%
Fib. Retracement= 0.382 | 0.559 | 0.786
Margin Leverage= 1x
Estimated Gain-time= 3 weeks
Website: gitcoin.co

XRP - Next targetsHeading down towards the previous support level of 0,73894. Lets see if we can hold that level and bounce back up towards the 0.382 fibonacci level of 0,79935. We also formed a death cross so not looking good at the shorter timeframe.

$STMX/USDT 1D (Binance Futures) Symmetrical triangle breakoutStorm X reversed and double broke-out bullish, continuation is in play but we believe a last retest of TL & 50MA is likely first.
Current Price= 0.02420
Buy Entry = 0.02103 - 0.01848
Take Profit= 0.02863 | 0.03749 | 0.05297
Stop Loss= 0.01533
Risk/Reward= 1:2 | 1:4 | 1:7.5
Expected Profit= +44.89% | +89.73% | +168.07%
Possible Loss= -22.42%
Fib. Retracement= 0.618 | 0.786 | 1
Margin Leverage= 1x
Estimated Gain-time= 2 months

DOTUSDT Long Biased BINANCE:DOTUSDT
Bullish Indications
1- HH & HL
2- Bullish engulfer
3- Moving within channel S&R
Bearish Indications
1- Price is still within 1D support zone
2- Resistance from 0.618 Fib level
I am long biased, however if 0.618 Fib level (HH) is not broken) then sell below this level with trade plan mentioned on chart.
Please support this idea with comment and like.
Thanks and Good luck

EURAUD Trade PlanOANDA:EURAUD
Bearish Indications
1- Bearish engulfer
2- Rejection from resistance at 1.59415, which is also previous neckline support for Head & Shoulder
3- channel trendline resistance
4- 0.5 Fib level retracement for a bearish trend started from Aug, 21
4- bearish divergence
However there are few but strong Bullish Indications
1- HH & HL on 4H timeframe
2- strong bullish momentum on RSI
So, I am short biased for smaller timeframe. It may continue back bullish trend after testing 0.236 Fib level.
But I have given two trade plans for the either side, mentioned on chart.
Please support with comment and like.
Thanks and Good luck

EURUSD Trade Plan for LongOANDA:EURUSD
Bullish indications
1- HH & HL
2- Bullish Engulfer
3- Bounced from weekly support at 1.11934
4- Retracement from 0.5 Fib level
5- ABCD pattern is in formation
Plan A below is given for long.
Plan A
Buy at 1.12929
Stop loss 1.12547
Target1 1.13677
Target 2 1.14252
But for plan B, wait for confirmation of continuation of downward trend
Please comment below for any suggestion, follow and support the idea if you like it.
Thanks and good luck for trade

$ANKR/USDT 4h (Binance Futures) Symmetrical triangle on supportAnkr Network is holding above 100EMA and looks ready for another bullish move.
ANKR is a DeFi / BSC / BC / DotEco token, more information on www.ankr.com
Current Price= 0.13156
Buy Entry = 0.12915 - 0.12267
Take Profit= 0.14701 | 0.17053 | 0.19442
Stop Loss= 0.11178
Risk/Reward= 1:1.5 | 1:3.16 | 1:4.85
Expected Profit= +33.54% | +70.90% | +108.84%
Possible Loss= -22.44%
Fib. Retracement= 0.618 | 0.883 | 1.117
Margin Leverage= 2x
Estimated Gain-time= 2 weeks
Contracts:
#ERC20 0x8290333cef9e6d528dd5618fb97a76f268f3edd4
#BEP20 0xf307910a4c7bbc79691fd374889b36d8531b08e3
#BEP2 ANKR-E97

Bloktopia possible cup and handle pattern about to form?It looks like block is trying to break out of the rising wedge, by formulating a cup and handle pattern. We shall see if this cap or facts.

$NWC/USDT 1D (KuCoin) Parallel channel on midline supportNewsCrypto is up-trending on macro view and bullish are stepping in on that 100EMA retest, let's catch next dip!
Risk/Reward= 1:2| 1:4.3 | 1:8.1
Expected Profit= +46.39% | +99.87% | +188.23%
Possible Loss= -23.25%
Fib. Retracement= 0.702 | 0.893 | 1.117
Estimated Gain-time= 3 months
Current Price:
1.0990
Entry Zone:
1.0032 - 0.8928
Take-Profit Targets:
1) 1.3876
2) 1.8946
3) 2.7321
Stop Targets:
1) 0.7275

DJI WEEKLY - FIB RETRACEMENTMy highly unorthodox perspective of the upcoming correction. Stay safe, over and out.
NOTE: This is not finacial advice.

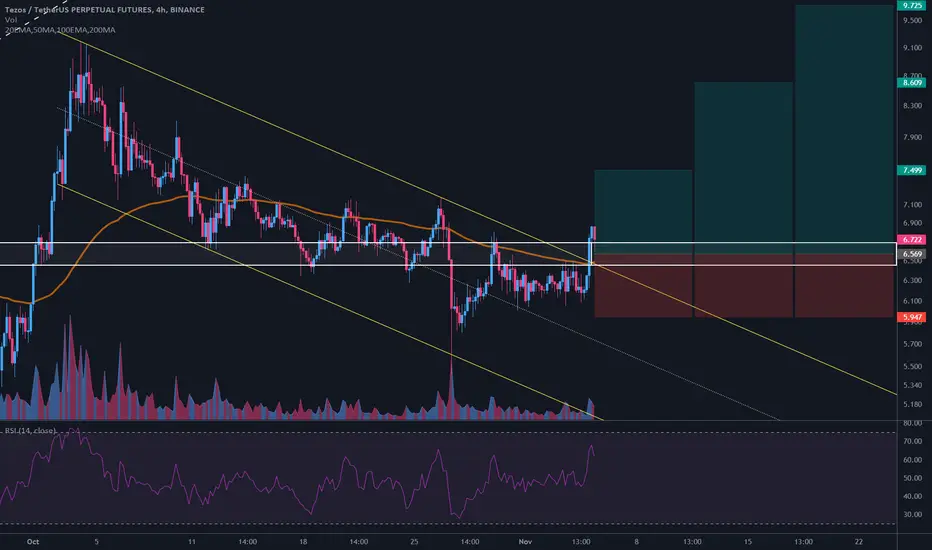
$XTZ/USDT 4h (Binance Futures) Descending channel breakoutTezos regained 100EMA and this time it seems ready to resume the up-trend for good!
Working with a PoS consensus algorithm, this is one of the fastest growing ecosystem for NFT, DeFi / BSC and Gaming, more info on tezos.com
Current Price= 6.722
Buy Entry = 6.685 - 6.453
Take Profit= 7.499 | 8.609 | 9.725
Stop Loss= 5.947
Risk/Reward= 1:1.5 | 1:3.28 | 1:5.07
Expected Profit= +28.32% | +62.10% | +96.08%
Possible Loss= -18.94%
Fib. Retracement= 0.618 | 0.883 | 1.117
Margin Leverage= 2x
Estimated Gain-time= 3 weeks
$RVN/USDT 2D (Binance Futures) Big bull pennant on supportRavencoin revisited 50MA support and so far strong bullish reaction, let's step in.
More information about that PoW (Proof Of Work) coin / P2P (Peer To Peer) network on ravencoin.org
Current Price= 0.10890
Buy Entry = 0.10872 - 0.10132
Take Profit= 0.13573 | 0.16358 | 0.19291
Stop Loss= 0.08743
Risk/Reward= 1:1.75 | 1:3.33 | 1:5
Expected Profit= +29.24% | +55.76% | +83.69%
Possible Loss= -16.75%
Fib. Retracement= 0.618 | 0.883 | 1.117
Margin Leverage= 1x
Estimated Gain-time= 3 months

$NKN/USDT 12h (Binance Futures) Falling wedge break and retestNew Kind of Network successfully retested both 50MA & 200MA support and is looking good for bullish continuation!
More information about that IoT (Internet Of Things) blockchain on nkn.org
Current Price= 0.36868
Buy Entry = 0.35361 - 0.32951
Take Profit= 0.42385 | 0.51873 | 0.61993
Stop Loss= 0.28652
Risk/Reward= 1:1.5 | 1:3.22| 1:5.06
Expected Profit= +24.09% | +51.87% | +81.50%
Possible Loss= -16.11%
Fib. Retracement= 0.618 | 0.883 | 1.117
Margin Leverage= 1x
Estimated Gain-time= 2 months

CESC LTDPassed the below parameters, weekly Congestion, fib retracement golden zone broken, RSI above 60, increasing volume. Let's wait and watch this stock

$TOMO/USDT 1h (Binance Futures) Descending channel near breakoutTomoChain is looking good for a bounce here after regaining 50MA support, more information about that coin on tomochain.com
Current Price= 2.0807
Buy Entry = 2.0857 - 2.0323
Take Profit= 2.2697 | 2.4610 | 2.6433
Stop Loss= 1.8917
Risk/Reward= 1:1.25 | 1:2.38 | 1:3.47
Expected Profit= +20.36% | +38.94% | +56.64%
Possible Loss= -16.34%
Fib. Retracement= 0.618 | 0.883 | 1.117
Margin Leverage= 2x
Estimated Gain-time= 5 days
