DOT/USDT 1DInterval Resistance and SupportHello everyone, I invite you to review the DOT chart in pair to USDT, on a one-day timeframe. First, we will use the blue lines to mark the downtrend channel from which the price has gone up.
Moving on, we can move on to marking support areas when we start a larger correction. And here, the first support is at $5.47, the second support is at $5.07, the third support is at $4.74, and the fourth support is at $4.41.
Looking the other way, we see that the price is fighting the resistance at $6.16, which so far has no strength to break. However, if it manages to break out above, the second resistance is at $6.40, the third at $6.75 and the fourth at $7.18.
Please look at the CHOP index, which indicates that we are gaining more and more energy, the MACD indicates that we are close to entering an uptrend, while the RSI also shows a rebound and a lot of room for continuation of the move.
Fibretracement

BNB/USDT 1DInterval Resistance and SupportAs the second chart in the review, we looked at BNB against USDT, as well as on a single-day timeframe. First, using the yellow line marked with the local straight line of the downtrend from which the price comes up, and then with the help of the blue line marked with the straight line of the downtrend at which the price returns.
Now let's move on to the designations of support places. And as you can see, we have the first support at $303, the second support at $296, the third support at $290, and the next support at $284.
Looking the other way, we can also determine the places where the price should be on the upward path. And here we have the first very strong resistance at the price of $310, which the price concerns, however, quickly returned, the next resistance is at the price of $322, and then the third resistance at the price of $338.
As you can see the CHOP index actually, that the energy quickly gathers strength. MACD indicator indicating entering an uptrend. While on the RSI, a visible strong increase may cause a temporary stagnation or correction.

Daily BTC 1DChart - resistance and supportHello everyone, I invite you to every Monday's cryptocurrency review. Let's start by checking the current situation on the BTC pair to USDT, taking into account the one-day interval. The last few days have been troublesome for many investors and a lot of fears have popped up around the cryptocurrency market, which significantly lowered the valuation of Bitcoin. However, one day was enough to rebuild the losses and here, first, we will use blue lines to mark the local downtrend channel, from which, as you can see, the price has definitely moved upwards.
Now we can move on to marking the places of support in the event of a correction. And here, in the first place, it is worth marking the support at the price of $ 23178, the second support at the price of $ 22353, the third at the price of $ 21650, then we have a strong support zone from $ 20993 to $ 20045.
Looking the other way, also using the Fib Retracement tool. First, we will mark a strong resistance zone from $24034 to $25226, only when the price breaks out of this zone and positively tests it will open the way towards the resistance at $28802.
As we can see after turning on the Cross 10 and 30 EMAs, we can see that they are still in a downtrend, but there is a definite change in direction.
Please pay attention to the CHOP index, where we can see that the energy is gathering strength very slowly, the MACD indicator is on the verge of entering an uptrend, while the RSI has a definite increase, we see that we are approaching the upper limit, which may slow down the current growth or give local correction.

Daily ETH 4HChart - resistance and supportHello everyone, let's look at the ETH to USDT chart on the 4-hour time frame. As you can see, the price quickly rebounded and returned above the downtrend line.
Let's start with the support line and as you can see the first support in the near future is $1616, if the support is broken then the next support is $1569, $1531 and $1493.
Now let's move on to the resistance line, as you can see the first resistance is $1662, if you manage to break it, the next resistance will be $1743 and only when we break it can the price move on.
Looking at the CHOP indicator, we see that the energy has been used for the current large increase, the MACD indicates an uptrend, while the RSI has reached the upper limit, which may slow down the price increase for a while.

LTC/USDT 1DInterval Resistance and SupportI invite you to review the LTC chart in pair to USDT, on a one-day interval. First, we will use the blue lines to mark the uptrend channel from which the price came down.
Moving on, we can move on to marking support areas when we start a larger correction. And here, the first support is at $83, where the price is currently located, the second support is at $77, the third support is at $70, and then we have the fourth support at $60.
Looking the other way, we see first resistance at $88 to $91, then second resistance at $94 to $97, then support at $100, then support at $105.
Please look at the CHOP index, which indicates that there is some energy left for further movement, the MACD indicates that we are moving in a downtrend, while the RSI has a rebound and we are approaching the lower limit of the range.

Daily BTC 1DChart - resistance and supportHello everyone, I invite you to check the current situation on BTC in pair to USDT, taking into account the one-day interval. First, we will use the blue lines to mark the uptrend channel in which the BTC price is moving.
Now we can move on to marking the places of support in the event of a correction. And here in the first place it is worth marking the support zone from $ 22963 to $ 20415, then we have support at $ 20415, the next support is $ 19187, but when we fall below, we can see a drop around the very strong support zone from $ 17590 to $ 15502 .
Looking the other way, we can determine the places of resistance in a similar way. We will first mark the resistance zone from $23,700 to $25,604, when we manage to break it, we have a second resistance at $28,306, then the price has strong resistance at $31,806.
As we can see on the EMA Cross 10 and 30, they indicate the continuation of the uptrend
The CHOP index indicates that we have a lot of energy for a new move, the MACD indicator indicates a downward trend, while the RSI shows a visible rebound, but we are still in the upper part of the range.

BTCUSDT - Descending Triangle After loosing a key Weekly on a move to the downside, next question is where to next right? Spent the morning trying to second guess the market and in essence try predict the price. Garbage. Trade the moment and whats in front of you. Knowledge is power.
Well respected in my opinion backed by some decent fibs is a descending triangle. Fibs drawn from highs to lows, where 0.618 resistance levels within the triangle seem to be well respected. The 3rd of which is an estimate.
Breakouts, I suspect are outside the triangle, with each of the previous Fibs at 0.618 acting again as resistance. Target low should the price break down, be the fib extensions 1:1, in red. 1 particular of interest is the nPoc at 22,500.
Note: 4 consecutive days where the price hasnt broken higher then the day (or previous day close). Ill consider bullish momentum should we break above yesterdays close price, especially a closing a day.

Daily BTC 4HChart - resistance and supportHello everyone, let's look at the BTC to USDT chart on a 4-hour time frame. As you can see, the price is moving below the local downtrend line.
Let's start with the support line and as you can see the first support in the near future is $23313, if the support is broken then the next support is $22848 and $22185.
Now let's move on to the resistance line, as you can see the first resistance is $23785, if it breaks down, the next resistance will be $24060, then $24296 and then the resistance zone from $24517 to $24837.
Looking at the CHOP indicator, we see that the energy is used to decrease the price, the MACD indicates a local downtrend, while the RSI has a strong rebound and is approaching the lower end of the range.

Daily review of BTC interval 4HHello everyone, I invite you to review the BTC pair to USDT taking into account the interval of four hours. First, we will use the yellow line to mark the local line of the falling trend under which the price is currently moving.
Now we can move on to marking the support areas in case of a deeper correction. And here, in the first place, it is worth marking the support at the price of $ 21,412, then we have a support zone from $ 21,007 to $ 20,666, but when we fall below this zone, we can see a drop to around $ 20,339, then to the price of $ 19,868 and even $ 19,265.
As we can see, EMA Cross 10 and 30 indicate continuation of the downtrend.
Looking the other way, in a similar way, using the trend based fib extension tool, we can determine the places of resistance. First, we have resistance at $22,300, once we break it, we have resistance at $22,891, then there is a zone of strong resistance from $23,341 to $23,797, and then price can move towards $24,432 resistance.
Please pay attention to the CHOP index which indicates that there is still a lot of energy left for the move, the MACD indicator indicates the maintenance of the local uptrend, while the RSI is moving in the lower part of the range.

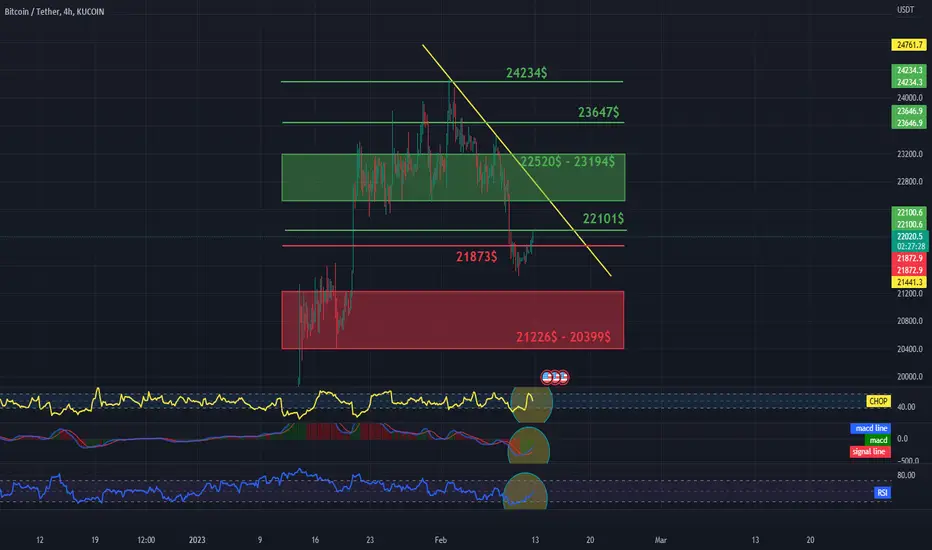
Daily review of BTC interval 4HHello everyone, let's look at the BTC to USDT chart on a 4-hour timeframe. As you can see, the price is moving below the local downtrend line.
Let's start with the support line and as you can see the first support in the near future is $21873, if the support is broken then we have a support zone from $21226 to $20399.
Now let's go from the resistance line, as you can see the first resistance is $22,101, if we manage to break it, then we have a strong resistance zone from $22,520 to $23,194, then resistance at $23,647 and $24,234.
Looking at the CHOP indicator, we see that there is still a lot of energy left for a further move, the MACD indicates entering a local uptrend, while the RSI shows an increase and room for the next move.
Daily review of BTC interval 4HHello everyone, let's look at the BTC to USDT chart on a 4-hour time frame. As you can see, the price is moving below the local downtrend line.
Let's start with the support line and as you can see the first support at which the price stopped is $21890, if the support is broken then the next support is $21237 and $20412.
Now let's move to the resistance line, as you can see the first resistance is $22443, if you manage to break it, the next resistance will be $22806, then we have a strong resistance zone from $23078 to $23368 and then resistance at $23731.
Looking at the CHOP indicator, we see that the energy has been used, the MACD indicates a local uptrend, while the RSI has a strong rebound.

Daily review of ETH interval 1DAs the second chart in today's review, we'll be looking at ETH versus USDT on a one-day timeframe. First of all, using the blue lines, we can mark the uptrend channel in which the price is currently moving.
Now let's move on to marking the places of support. We will use the Fib Retracement tool to mark the supports, and as you can see we have the first support at $1563, the second support at $1470, the third at $1393, and then we can mark the strong support zone from $1319 to $1208.
Looking the other way, we can also mark the places where the price should encounter resistance on the way to increases. And here we can mark a strong resistance zone from $1666 to $1825, then we will move towards resistance at $2032
The CHOP index indicates that we have a lot of energy for the next move. The MACD indicator is in a downtrend. On the other hand, we see a rebound on the RSI, and we maintain a downward trend.

BTCUSDT - Fibs and nPocNicely aligned fib retracement with fib risistance fan. 0.618 and 0.66 nicely aligned with Naked point of Control (nPoc). Possible target high 24.4k. Notice nPocs aligned with Fibs for confluence. Interesting. Thereś a nPoc at 24500, Nice ;) 23,075 is an nPoc just below CC 0.618 currently drawn. Fib fan 0.75 is a good level of support in my opinion should we retrace further.

SOL - USDT 4HChart, targets and stoplossHello everyone, let's look at the SOL to USDT chart on a 4-hour time frame. As you can see, the price is moving in the local uptrend channel.
Let's start with the determination of the support line and as you can see, in the first order, it is worth marking the support zone from $ 24.33 to $ 23.55, if the support is broken, then the next support is $ 22.79, then we have the second support zone from $ 21.70 up to $20.33..
Now let's move on to the resistance line, and here again we will start by marking the resistance zone from $25.16 to $25.87, if we manage to break it, the next resistance will be $26.81, and then around $29.44.
Looking at the CHOP indicator, we see that there is some energy left for the next move, the MACD indicates the limits of the return to the local uptrend, while the RSI is moving in the middle of the range and tries to break above the downtrend line.

CholafinCholafin stalled its upward rally due to market correction but its taken support near its 78% fib retracement level & trying to regain its upward rally towards 750 level.
Could be bought with stoploss below its 50% fib retracement level ; 702.

XLMLikely completed a HTF running Flat which is as follows :
Wave B extends beyond the start of wave A
Wave C finishes above the end of Wave A
Wave A must breakdown into 3 sub wave ABC
Wave B must Breakdown into 3 sub wave ABC
Wave C must subdivide into 5 waves (in the case of XLM an Ending diagonal)
the ending diagonal is a precursor to a strong reversal.
Likely the forever bottoms in around .06c & up only from now on, any dips will be eating up by the XLM bulls & Algos.

How to do accurate entries using the 50% fib levelThis strategy will require you to be able to distinguish between the impulsive move and the retracement since we only apply the fib retracement tool to the impulsive move.
What you do is just lay your fib from the body to the body (not the wicks) then identify the 50% retracement level.
Now if you're an aggressive trader you can set a pending order or just execute an instant entry once price reaches your 50% retracement level.
On the other hand if you're a less aggressive trader, you will make a decision based on what price action will reveal at the 50% retracement level. I'll leave it to you to decide what kind of trader you are.

UNIUSDT, 1HBINANCE:UNIUSDT Bullish Gartley (Targets Pending) & Potential Bearish Bat (CD leg pending)
C to D leg Bat can extend to 1.618 to 2.618 of fib retracement

USCAD UPDATE Following CPI Report Welcome back! Let me know your thoughts in the comments!
**USDCAD - Listen to video!
We recommend that you keep this pair on your watchlist and enter when the entry criteria of your strategy is met.
Please support this idea with a LIKE and COMMENT if you find it useful and Click "Follow" on our profile if you'd like these trade ideas delivered straight to your email in the future.
Thanks for your continued support!
Brian & Kenya Horton, BK Forex Academy

$ETH/USD 1W (#Coinbase) Huge rising wedge on supportEthereum is falling sharply while RSI is printing new ATL, time to be opportunist and place some juicy bids on 300MA and below!
Current Price= 1030.88
Buy Entry = 915.64 - 739.86
Take Profit= 1265.98 | 1632.40 | 1998.81
Stop Loss= 534.62
Risk/Reward= 1:1.5 | 1:2.75 | 1:4
Expected Profit= +52.94% | +97.21% | +141.47%
Possible Loss= -35.41%
Fib. Retracement= 0.236 | 0.382 | 0.5
Margin Leverage= 1x
Estimated Gain-time= 1 year
Tags: #ETH #ETHUSDT #WETH #Altcoin #PoW #Eth2 #PoS #Governance #SC #DApp #DeFi
Website: ethereum.org
Contracts:
#Mainnet
#ERC20 0xc02aaa39b223fe8d0a0e5c4f27ead9083c756cc2
#BEP20 0x2170ed0880ac9a755fd29b2688956bd959f933f8
#BEP2 ETH-1C9
#AVAXC 0xf20d962a6c8f70c731bd838a3a388d7d48fa6e15
#SPL 2FPyTwcZLUg1MDrwsyoP4D6s1tM7hAkHYRjkNb5w6Pxk

Bitcoin 2nd bottom dec '22 / jan '23This scenario is inspired by previous encounters with the 'red ring of death'.
Combined with the fact that historically BTC made double bottoms (2nd bottom always a bit higher than the 1st one).
RSI wise it wouldn't surprise me neither as these setups are made quite often.
It's not improbable.

BNB - BACK BELOW 100??More downside in Binance to come.
Simple AB=CD Patterns repeating here.
If it rallies to around 250 then that would set up a 3rd ABCD pattern down to the 100 area.
Not quite time to Buy the Dip.. 🤔🤔

#CCJ is setting up for a bounce to the top sideAs you can all see from the daily chart CCJ pulled back on the Fib levels to that .50 area we wicked and are now potentially heading back up to potentially make new highs, me personally i would of much rather liked a pull back to .786 area before we got to see a new run to the top but either way i'm ready, looking at the options chain flow the 35 call for May 20 expiry looks to be primed as well as 34 and 32 call has a ton of oi on them as well waiting for numbers to update on the volume from yesterday to see how much is rolling into the oi or if we get a reduction in the oi levels we know people may be rolling out of those trades either way we should get an opportunity to make some nice gains off this play.
