FIL 4H BUY / SUPPORT ZONEFIL 4H support is now at ~$6
Enter 50% at the current price
and try to set some BUY orders near the support zone
If FIL stays above the trendline,
the Take-Profit target would be 5%, 10%, and 15% from your entry
Cheers
FIL

Filecoin forecast #FilusdtIt seems that the price is moving towards the liquidity zone
It's hard to predict right now, but I expect such price movement in the coming hours
I will update the analysis when we reach that area

Filusdt Breaks Descending channelSeems Like fil Is Ready For Bullish Impulse
descending Channel Breakout Has Already Confirmed In h4 Timeframe expecting 35 to 40% Bullish move

Filcoin , technical analyst 🥺Friends, this shows that we are in the neck line, and we will go up to the specified areas. I hope you will profit, because dear friends, I lost all my capital with a mistake, in the past days, and now I am zero, if you can help me, there is no obligation. If you want, help me, tell me in the message. privately to give my wallet number.help me please 😞🥺☹️😥😫😭💔🙏

Filecoin FIL Price Targets after the FSB meetingThe Finance Stability Board said today that many stablecoins won`t meet the requirements stipulated in its recommendations for cryptocurrency asset regulation.
This could have have ripple effects in the entire crypto industry!
My price targets for Filecoin FIL are:
FIL/USDT short
Entry Range: $7.80 - 8.50
Take Profit 1: $7.30
Take Profit 2: $6.50
Take Profit 3: $5.60
Stop Loss: $9.60

🔥FILECOIN IS GOING TO MAKE ANOTHER 40% PUMP AFTER THIS🔥 Hi friends! Filecoin is the biggest storage blockchain platform in the world. Like other storage platforms, its use case is relatively simple to grasp. Unlike centralized storage platforms like Google Cloud and Microsoft Azure, it uses decentralize storage platforms.
Now FIL grows after the huge dump. If you know the main trigger of this pump, write in the comments.
📊 TRADING PLAN FOR FILECOIN:
Filcoin consolidates inside the channel but already breaks the value area up. It confirms the bulls presence. Actually, we need to wait the breakout of the channel up and the test is at support to open a long trade trade.
I recommend you open a long trade when the price break the channel up and successfully test it as a support.
🚩 If the price will make a false breakout of top of the channel, it will be a good signal to open a short trade because this accident shows the bulls weakness. You can see the same case at the beginning of December (red area), when the price break the important value area but break it down and the price fall for -35%.
✅ MY TARGETS FOR FILECOIN:
🔥 $4 - the key level
🔥 $4.35-4.5 - the value area
🔥 $5 - the key level
💻Friends, press the "boost"🚀 button, write comments and share with your friends - it will be the best THANK YOU.
P.S. Personally, I open an entry if the price shows it according to my strategy.
Always do your analysis before making a trade.

FIL/USDT 500% Potential from here so Which is Good Entry?#FIL/USDT Technical Analysis:
Currently, $FIL is trading at $6.10, which is a significant -97.65% down from its all-time high.
The cryptocurrency has gone down -99% from its peak but has recovered well in the past three months, rising up to 300%.
It is still 122% up from its recent low in December.
At present, the market is in an uptrend, but a significant upward rally is expected only after some more retracement.
It is possible that the price could drop by another 20% from its current level before an upward trend begins.
The best entry point for investors would be at the support level area.
For the cryptocurrency $FILUSDT to be fully in bullish mode, it needs to break upward the resistance level at $9.
Once this happens, the price could reach the target of $26 in the next bull market.
It is possible that the price may go higher, but a minimum target of $26 seems reasonable.
Investors should keep an eye on the support level at $4.80 and the resistance levels at $8.95 and $26.10.
If you find this analysis helpful, please like and appreciate it. Follow me for more real-time updates on cryptocurrencies.
Thank you.

FILUSDTFILUSDT at 6H follows its triangular accumulation wedge, reaching its narrowest part, that is, it could break at any moment. your wedge.
In its favor is the RSI, which is highly bullish, and the MACD bullish.
On the 1H chart:
RSI: Exhaustion of Buyer Forces
Supports: 5,938 / 5,869
Resistances: 6,099 / 6,260
Filecoin is the world's largest decentralized storage network, which allows users to store, request and transmit data through a verifiable marketplace. Filecoin is fully open source. The protocol runs on a reliable system that combines Proof of Space-time (PoSt) and Proof of Replication (PoRep), which provides a solid foundation for storing the world's most valuable datasets, minimizes economic barriers, and allows users to take advantage of your networking capabilities. IPFS, a Web3 file system on this system, allows developers to access data over the network.

FILUSDTThe daily FILUSDT is currently on the lower edge of the accumulation wedge, with plenty of room to rise, even more so with the RSI indicating extreme exhaustion of selling forces.
If it breaks down, it will look for MM200 which will be a powerful support at $5,132
--------------------------------------------------------------------------------------------------------------------
Here are the supports and resistances on the M45 team:
Let's start with the support line:
6,002 / 5,846
Now let's move on to the resistance line:
6,188 / 6,335
RSI with exhaustion of selling forces, has plenty of energy for further upward movement.
---------------------------------------------------------------------------------------------------------------------
Filecoin is a decentralized platform for data storage. The Filecoin project was launched by technology company Protocol Labs, based in California, in 2014. The main objective of Filecoin is to create an efficient solution for data storage, based on IPFS (InterPlanetary File System) decentralized network protocols. The main idea is that its users install special software that allows you to store data on PC hardware. As a reward, users receive Filecoin.

FIL ANALYSIS (30M)Hi, dear traders. how are you ? Today we have a viewpoint to SELL/SHORTthe FIL symbol.
For risk management, please don't forget stop loss and capital management
When we reach the first target, save some profit and then change the stop to entry
Comment if you have any questions
Thank You

FIL 1H BUYFIL 1H support is now at ~$6.755
Enter 50% at the current price
and try to set some BUY orders near the support zone
If FIL stays above the trendline,
the Take-Profit target would be 5%, 10%, and 15% from your entry
Cheers


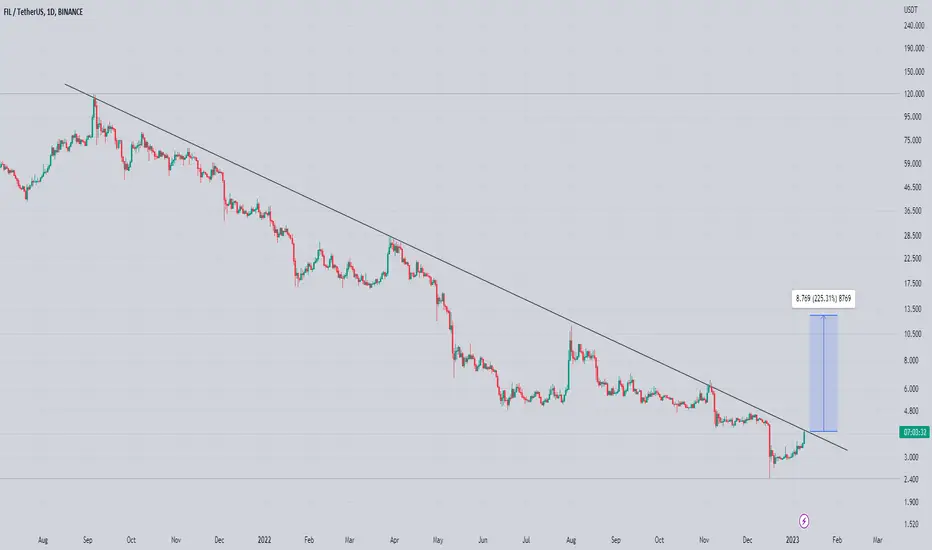
FILUSD looks bullish againIn November 2022 we predicted that Filecoin will drop below 3 $:
Now, it's a time for an update and upside targets!
FILUSD looks pretty strong.
The price came back above the resistance which should be acting as a support now.
We may see a few days of consolidations above this key level (5$) which would be very bullish, however it would not be unexpected to see a rally continuation towards 8-9$. MACD indicator shows a positive momentum and it looks strong for bulls. Moreover, If the price breaks above this range, it can shoot up to 11 $ which would be our final target for this short-term trade.
Long-term the price may go much higher.
Good luck!

Polback to trendline & high reng next big shortUse by... ez7_strategy🥇
Legs
MTR (major trend reversal)
Breakeven

Filecoin - No Danger No glory.
- Filecoin lost -98% from his ATH.
- ICO managed to get 200M$ in 2017, VCs dropped a lot and made so much benefits in 2021.
- When whales will be tired and start to rebuy, the bounce could be very aggressive.
- This project is huge and was listed in all Top Exchanges ( Coinbase, Binance, Kraken, Cryptocom, etc )
What Is Filecoin (FIL)?
Filecoin is a decentralized storage system that aims to “store humanity’s most important information.” The project raised $205 million in an initial coin offering (ICO) in 2017.
Filecoin aims to store data in a decentralized manner. Unlike cloud storage companies like Amazon Web Services or Cloudflare, which are prone to the problems of centralization.
----------------------------------------------------------
Trading Zones
----------------------------------------------------------
- Buy : 4.50$ (Buy a bit)
- Rebuy : 2.50$ (Fire Buy)
----------------------------------------------------------
TP1 : 25$ (security TP)
TP2 : 120$
TP3 : 230$ (ATH)
----------------------------------------------------------
Happy Tr4Ding !

FIL short term SHORT oppurtunityI do think FIL is in its accumulation phase, a pullback to 6.5 area would make sense, nothing to out of the ordinary indicator wise, but I am noticing a slight trend of distribution from the $2.50 area.
I have short entry at $7.33 and will take profits at 6.75-6.55
5x leverage, not risking a pump to 8.35 and getting liquidated. I dont think $8.20+ will happen without a pullback

FilusdtTesting Trendline In daily Timeframe Incase Of breakout Expecting massive bounce
Entry Would Be only Valid After Breakout
Safe Sl Area Would BE Below Last Swing Low
FIL will be 4$ or 2$ soonThese mean coins have artificial pump by whales, they get huge profit and sell all their coins so market dump again, i request you don't 2x leverage to loose your principle amount, select 1x only, these whale play with your emotions and earn profit, this is not a financial advice but trade by your own analysis


✳️ Filecoin Bullish Breakout... The Beginning (145% Mapped)If you zoom out, you can see that Filecoin (FILBTC) is still trading near the bottom compared to its April All-Time High... Let me show you:
Telling us that there is still plenty of room left for additional growth.
Its been only a few days since our last trade idea for this pair and it is already moving strong... Great, but as I just mentioned, there is more.
The volume today is the highest in more than a month.
This high volume to break above MA200 and EMA100, confirming a real bullish move, not fake, and also opening the doors for so much more growth.
Patience is key.
Don't get greedy.
Remember that complacency and greed will be the problem in a few weeks, not fear and doubt; things change.
Namaste.

FILUSDT(Filecoin) Daily tf Range Updated till 18-02-23FILUSDT(Filecoin) Daily timeframe range. its very healthy with some good amount of volume right now. #7.944 is resistance for now, if it breaks clean it got clear space till #9.525. that depends if money flow keeps on.

Filecoin FIL price goes up against the market trendWhile almost the entire cryptocurrency market has entered a correction phase, FIL buyers decided that this was the perfect time to provoke a price increase) Who are we to contradict them?)
Given the good and complete development of the previous idea, it is worth updating our thoughts on the possible future price of the Filecoin token
Looking at the chart, we see two targets for growth: roughly speaking, $7 and $10 , and the two have a real chance to be reaching in the near future.
If you are a medium- or long-term investor who believes in the prospects of the Filecoin project, then the following advice is for you: the closer the price is to $5, the larger your FIL buy orders should be. After all, looking at the global chart, the prospects for FILUSD price growth are at least x10.
_____________________
Did you like our analysis? Leave a comment, like, and follow to get more
