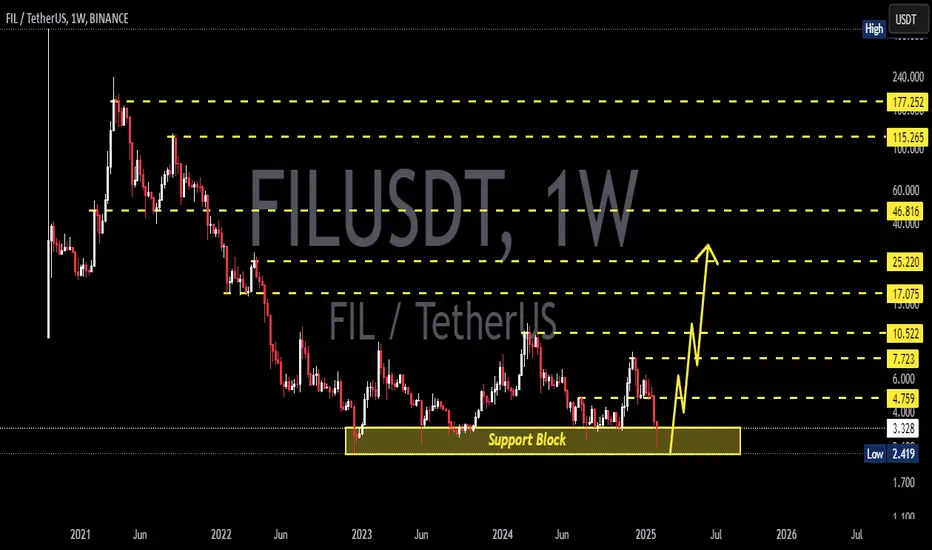
Filecoin: Your Altcoin ChoiceThis chart has perfect symmetry. Filecoin is doing good because the 2025 bottom and ATL is coming as a long-term double-bottom. This double-bottom is 2 years and 5 months long.
The previous market bottom happened in December 2022. This time it is April 2025. As can be seen on the chart, the December 2022 low was pierced on a wick but the action is set to close above this level. Giving us a perfect double-bottom and also a perfect reversal signal. The signal becomes strong when the week closes in a few hours above 2.3215 thanks to the high volume on the current session.
A new All-Time High is possible and everything is possible in this 2025 bull market. A lower low long-term would invalidate the new ATH potential but here we have a technical double-bottom so the potential remains open.
I am mapping a 2,722% target on this chart but this is me being conservative. As I mentioned elsewhere, the reason why I will be wrong by the end of this bull market is because the end targets will be much, much higher than what is shown on the chart, and that's ok. I rather my followers secure huge profits rather than missing the train (or rocket) due to greed.
There is no need to earn or aim for 1,000,000%. It is better to make wins, to win, secure profits, continue trading and grow. We are here long-term. The market is here to stay. There is no need for unrealistic planning and expectations. It is better to win, be a winner, achieve success and take money home.
Trading is a money game and we are here to make money, no doubt about it, make no mistakes.
Confusing the goal with skewed expectations can lead to bad results.
We just want the win and we are grateful for everything that comes our way. Gratitude, equanimity and piece of mind, stability and emotional control will lead to trading success.
It is not about the entry timing, the price or the chart, it is about you, your emotions and personal growth.
Expand your mind, and your money grows.
Open your heart and get whatever you want.
Seek first the kingdom of heaven, mental control, and whatever you want will be yours.
Namaste.
FIL

FIL can touch 1$ in the coming weeksFIL / USDT
The price just brokedown the Huge trading range (2022-2025) on weekly chart and price still find difficulty to restore the broken support
Our view for this coin in mid term is bearish and few weeks we can see FIL hits 1$ 📉
This is my macro view for FILUSD as long as price doesn’t reclaim the support with strong volume
Best of wishes

Breaking: Filecoin's USDFC Now on SushiSwap $FIL To Surge 250%The Filecoin's -backed stablecoin $USDFC has extended its services to the Sushiswap platform where users can now swap USDFC seamlessly on SushiSwap, making it easier than ever to access!
Furthermore, by providing liquidity to the FIL/USDFC pool, you can earn fee income.
This strategic move by Filecoin ( LSE:FIL ) is set to make LSE:FIL go parabolic in the coming week with an anticipated 250% surge in the horizon.
As of the time of writing, Filecoin ( LSE:FIL ) is down 6.24% losing the $3 pivot currently down to $2.66. The asset is approaching oversold levels as hinted by the RSI at 37.60. However, the daily chart pattern depicts a symmetrical triangle, a breakout above the ceiling of the triangle could cement the grounds for the 250% surge.
What Is Filecoin (FIL)?
Filecoin is a decentralized storage system that aims to “store humanity’s most important information.” The project raised $205 million in an initial coin offering (ICO) in 2017, and initially planned a launch date for mid-2019. However, the launch date for the Filecoin mainnet was pushed back until block 148,888, which is expected in mid-October 2020.
Filecoin Price Live Data
The live Filecoin price today is $2.67 USD with a 24-hour trading volume of $171,672,956 USD. Filecoin is down 6.34% in the last 24 hours. The current CoinMarketCap ranking is #47, with a live market cap of $1,728,274,124 USD. It has a circulating supply of 647,135,072 FIL coins and the max. supply is not available.

Filecoin FIL Will Continue Bear MarketHello, Skyrexians!
Recently we made the most hated article about Bitcoin Dominance growth, but this chart reflects great what can happen soon. The mistake of the most traders here is that they are sure that alseason will come now. Most of crypto shows weakness and we need to be more realistic. Today we take a look at BINANCE:FILUSDT as an example of bear market continuation for risky assets!
Let's take a look at the weekly chart. Current bear market can be seen as an ABC. The most common mistake that people think that wave B is an accumulation, but this is redistribution and the new mark down phase is starting now. The support will be broken because there is no other way. There was a chance for altcoin season in November when price has formed the anticipated wave 1, but wave 2 has broken this belief and now we are in the wave C. Current wave is wave 3, but to the downside. Targets are very low, they cannot be measured, but FIL may easily touch $1. This bear market will be finished with the ending diagonal, like most of major trends. This information is not for panic, but be ready for the big crash again. Anyway, now there is a great price for long term accumulation, the only one question will you be able to see -70% from the current portfolio value?
Best regards,
Skyrexio Team
___________________________________________________________
Please, boost this article and subscribe our page if you like analysis!

Breaking: Filecoin Reclaims $3 Surging 4.80% Today The price of Filecoin ( LSE:FIL ) saw a noteworthy uptick in price surging 4.80% today, breaking key resistance albeit the crypto market in a bullish trend. LSE:FIL is enroute the $4 mark.
The decentralized storage system that aims to “store humanity’s most important information has been constrained in a consolidation zone for almost 2 months without a clear cut direction, sticked in the $2.70 price zone.
Should Filecoin breakthrough the $3.3 pivot point and possibly the 1month high that is serving as the the resistant point ($3.5), LSE:FIL could secure a move to the $4 zone and consequently a breakout to $7-10.
Filecoin Price Live Data
The live Filecoin price today is $3.12 USD with a 24-hour trading volume of $131,402,802 USD. Filecoin is up 3.50% in the last 24 hours, with a live market cap of $2,016,455,965 USD. It has a circulating supply of 645,941,959 FIL coins and the max. supply is not available.

FIL: The Life-Changing Setup You Can’t Ignore!FIL has been in a massive 3-year accumulation, just like LINK before its explosive run. The setup is textbook perfect—and the window to get in won’t stay open forever.
Right now, FIL is at historical lows, setting up for a potential 600%+ move. If you're sleeping on this, you might be making a huge mistake. Don’t be that kind of stupid.
Entry: NOW
TP: 19
SL: 1.8

FILUSDT - Buy now or regret later!FIL is literally one of the hidden gems in the market.
The probability of a strong rebound is increasing significantly in the coming days. The coin has reached its strongest support level, a key historical reversal point.
Investing in it now is a golden opportunity, with a target of $27.
The bottoms have already formed across many altcoins—now is the best time to buy
Best regards Ceciliones🎯

FIL BUYHI friends
According to the pullback we had, we can enter into the transaction with risk and capital management.
*Trade safely with us*

fil going to the moooon !#FIL has a bullish pattern in the low time frame and also the long time frame the market has completed the down waves and now its going to make another rise after correction phase check out my daily time frame on fil 👇👇👇

FIL can fly !#FIL has a super bullish pattern in long term analysis 👇👇👇
in lower time frames there are some liq zones which can make the market rise so i think there should be another down spike and a huge rise after that

#FIL Ready to Make a Mega Bearish Move? Bears Getting ReadyYello, Paradisers! Is #FIL on the verge of a massive collapse, or will the bulls step in at the last moment? Let’s break down the latest setup of #Filecoin:
💎#FILUSDT is forming a textbook descending triangle, a pattern that typically signals a bearish continuation. The price has been making lower highs while holding a crucial support zone around $2.45—a clear sign that sellers are in control.
💎A breakdown below $2.45 could trigger a sharp sell-off, with the next major support sitting around $0.82. If #FILUSD loses this level, it could enter price discovery to the downside, leading to extreme volatility.
💎On the bullish side, a breakout above the descending resistance line would invalidate the bearish setup. A strong daily close above $4.00 could flip the trend, targeting a move toward $6.00 and beyond. However, until that breakout happens, caution is warranted—trading inside a descending triangle without confirmation is dangerous.
The market is at a make-or-break point. We will see if #FIL breaks below support and plunges lower or if the bulls stage a surprise comeback. Let us know in the comments!
MyCryptoParadise
iFeel the success 🌴

FIL USDTfil...how strong is it holding on to the current support..? This is not trading advice, it is best to do your research first before starting to trade

Filecoin Dips 8% Amidst Proof of Data Possession (PDP) LaunchThe Filecoin ecosystem is at a pivotal moment, balancing technological innovation with market volatility. Amidst a broader downturn in the crypto market, including Bitcoin’s slide, Filecoin ( LSE:FIL ) has experienced an 8% decline. However, beneath the price dip lies a significant fundamental development—the introduction of Proof of Data Possession (PDP), a breakthrough mechanism enhancing data accessibility and storage security.
PDP and Fast Finality (F3) Reshape Filecoin’s Future
The Filecoin ecosystem is making strides with the introduction of Proof of Data Possession (PDP), which complements the existing Proof of Replication (PoRep). PDP enables efficient, periodic verification of stored data without the need for resource-intensive decoding. This advancement is particularly beneficial for hot storage solutions like Storacha and Akave, the first adopters of PDP.
The PDP rollout follows a structured timeline:
- February 2025: Final contract optimizations, Curio-PDP pipeline development, and integration with Storacha.
- March 2025: External audit, PDP explorer launch, and monitoring of storage provider performance.
- End of March 2025: PDP goes live on Filecoin Mainnet, marking a major milestone in decentralized storage security.
Fast Finality (F3) Accelerates with New Activation Mechanism
Filecoin’s Fast Finality (F3) mechanism, originally requiring two network upgrades, now features a delegated authority mechanism for quicker activation. This smart contract-based approach allows the Filecoin implementation teams to set key F3 parameters on-chain, reducing delays while maintaining security and transparency. With faster finalization, Filecoin enhances network usability, making storage transactions more efficient. The F3 contract is live and open for community review.
FIP-00XX: Per-Sector Fee Proposal to Improve Economic Sustainability
A new proposal, FIP-00XX, aims to replace the batch balancer fee with a per-sector fee, optimizing Filecoin’s economic model. This change encourages sector batching and proof aggregation, reducing gas costs for Storage Providers (SPs) while improving scalability. The proposal eliminates outdated gas-limited constraints, allowing the protocol to evolve with fewer bottlenecks.
Technical Outlook: Is a Bullish Reversal in Sight?
As of writing, LSE:FIL is down 7.92%, trading within a bearish pattern. However, the token appears oversold, with the Relative Strength Index (RSI) at 32.54, suggesting an impending trend reversal. Historically, RSI levels below 35 have signaled buying opportunities, hinting at a potential shift in momentum.
Support and Resistance Levels
- Support: The 1-month low pivot is currently acting as a temporary support for $FIL. If the price holds above this level, we could see a rebound; however, a break below could trigger further downside.
- Resistance: The 38.2% Fibonacci retracement level at $4.70 is acting as a strong resistance. A breakout above this point could send LSE:FIL into a bullish phase, with $15 as a long-term target.
Furthermore, LSE:FIL is currently trading below key moving averages (MAs), further reinforcing its oversold nature. A decisive move above the 50-day MA would strengthen the bullish case, attracting traders looking for a reversal.
Conclusion
While LSE:FIL faces short-term bearish pressure, its technical indicators and fundamental developments suggest an optimistic long-term outlook. The launch of PDP and F3 advancements could boost adoption, reinforcing Filecoin’s role in decentralized storage. Traders should watch for a breakout above $4.70, which could pave the way for a strong recovery.
The question remains—will LSE:FIL capitalize on its technological progress and defy market weakness? Only time will tell, but the foundations for a strong comeback are certainly in place.

FIL short-down FILUSDT Signal
🔹 Key Resistance Level: $3.35 – $3.50
🔹 Important Support Levels: $3.148 – $2.940 – $2.738
Analysis:
FIL price has been moving in an uptrend within a rising wedge pattern and has now reached the key resistance zone of $3.35 – $3.50. If this level is broken, followed by confirmation with a pullback, the uptrend is likely to continue. However, failure to break this resistance could lead to a price correction toward the mentioned support levels.
📌 Trading Strategy:
✅ Sell Entry after breaking the uptrend and confirming below $3.148
🎯 Targets: $2.940 – $2.738
🛑 Stop Loss: $3.30
⚠ Important Note: Risk management should not be ignored!

FIL breaks out of triangle!📊 FIL recently broke out of a triangle pattern, gaining momentum as it moves toward the key $3.55 resistance.
Key Levels to Watch:
Resistance: $3.55 → Price is testing this level, and its reaction here will be crucial.
Support: $3.14 → If the price faces rejection, this zone could act as strong support.
SMA 9: $3.38 → Currently supporting the uptrend, showing short-term bullish momentum.
For now, all eyes are on $3.55.
If you have any thoughts, let me know.

FILUSDT 1WFIL ~ 1W Analysis
#FIL This is the lowest support for now.Buy from here if you still have a Conviction on this Coin with a target of 20%+
Is Filecoin Dead? Is Filecoin Dead? 😵
The worlds first decentralized storage system that aims to “store humanity’s most important information.” Has seen a notable uptick of $237 as of 2021 but as of the time of writing, Filecoin is trading at $2.90.
After raising $205 million in an initial coin offering (ICO) in 2017, Filecoin was embraced by the public as the first decentralized storage platform but ever since the surge to an ATH (All time high) of $237, Filecoin drastically decreased in value losing about 90% of total value.
So is Filecoin dead? ☠️
The answer is a big NO. 😒
Filecoin is very much alive because it is open-source and decentralized, which means that all governance is in the hands of the community.
Which brings me to my recent post about community being the utility.
Filecoin understood the value and importance of the community that is why for over 7 years they have prioritized their community more than the token itself.
The only reason Filecoin isn’t performing well is the fact that the community have not realize Filecoin is governed by them ! 🤣
On the Filecoin platform, developers have the opportunity to create cloud file storage services like Dropbox or iCloud.
Anyone can join Filecoin and start storing their data or earn money by providing space for someone else's funds.
The creators of Filecoin opted for their blockchain technology to run the network and their token with their own consensus.
But then why do we need a decentralized storage system? 🤨
1️⃣ Data Ownership & Privacy: Unlike centralized storage, decentralized systems ensure you control your data. No big tech snooping or single-point failure risks! 🔒
2️⃣ Cost Efficiency: Decentralized networks use unused storage globally, making it cheaper and scalable compared to traditional providers. 💾
3️⃣ Resilience & Redundancy: With files spread across nodes worldwide, your data stays safe, even if some servers go down. 🌍
From the aforementioned points above, you will agree with me that Filecoin is here to stay with such intriguing and innovative features.
💎 We have always look forward to a project woven with utility, driven by the community. In my opinion until i change Filecoin offers both.
Technical outlook
As of the time of writing, the LSE:FIL coin is down 11%. This is, however, in tandem with the general crypto landscape. as we saw BTC dip to $91k and ETH to $2k. The general crypto landscape is in a bloodbath even as pro-crypto president Donald Trump is elected. For Filecoin, immediate support lies in the 1-month low; however, in the case of extreme selling pressure, the LSE:FIL coin might dip to as low as $2.114, a level that aligns with the 23.6% fib extension level. Similarly, if a trend reversal should occur, the pivot point lies in the 38.2% fib retracement tool. A breakout above that zone could result in a bullish run.


FIL READY TO EXPLODECurrently we are forming minor wave (ii) of major wave 3.
wave (ii) is near about to end and we may see FILUSDT rallying soon

FIL/USDT BullishIn my opinion, FIL is in a reaccumulation zone with the potential to reach the $11$ zone again. It is also possible to reject the first target around $7.10$. I am prepared for every outcome. I am only spot trading here. On the longer timeframe the zone 14-15$ is on the table, but that depends on the overall market conditions. Good Luck.

Alikze »» STRK | Trading range🔍 Technical analysis: Trading range
- It is in a downtrend on the 1D daily time frame.
- Currently, it is in the area between 0.33 and 0.42 as a trading range.
- In case of support in the 0.39 area, it can grow up to the supply area.
🛑 The most important resistance: 0.586
- Due to the fact that there is demand in the current area, this failure can happen from above.
- He has tested the swing several times. According to the momentum, there is an expectation of failure from above.
- But if there is consolidation below the 0.39 area and there is a break from the bottom, the bearish scenario will gain strength.
💎 Alternative scenario: Considering that the formation of a bearish flag pattern is given, if the 0.39 area is not maintained and stabilizes below the area, we can expect confirmation of the bearish flag pattern, which with the breaking of the trading range area can be a correction as much as the previous leg. experience another.
»»»«««»»»«««»»»«««
Please support this idea with a LIKE and COMMENT if you find it useful and Click "Follow" on our profile if you'd like these trade ideas delivered straight to your email in the future.
Thanks for your continued support.
Best Regards,❤️
Alikze.
»»»«««»»»«««»»»«««
BINANCE:STRKUSDT

FILUSD Accumulation almost over. Next stop $19.00.Filecoin (FILUSD) has been consolidating around its 1W MA50 (blue trend-line) for the past 4 weeks and appears to be at the end of the Lower Highs pattern similar to the one in 2019/20.
Both patterns held FIL's historic Support Zone, printed identical 1W RSI Cup formations and the past pattern initiated a strong 1-year rally above the Symmetrical Resistance Zone once the Lower Highs broke. Essentially the Descending Triangle patterns are Accumulation Phases before the Bull Cycle's main rally.
As a result, even though one last test of the Support Zone is technically viable, the upside at this time is already considerably greater than the risk involved, so in our opinion it is worth going long and have a modest 1W MA200 (orange trend-line) Target at $19.00.
-------------------------------------------------------------------------------
** Please LIKE 👍, FOLLOW ✅, SHARE 🙌 and COMMENT ✍ if you enjoy this idea! Also share your ideas and charts in the comments section below! This is best way to keep it relevant, support us, keep the content here free and allow the idea to reach as many people as possible. **
-------------------------------------------------------------------------------
💸💸💸💸💸💸
👇 👇 👇 👇 👇 👇

FILUSDT 1WFIL Update ~ 1W
#FIL still in a bullish trend. If you still have Conviction on this coin,. Buy gradually on this support block. with a minimum target of 20%++
