Filecoin shortFilecoin bounced off the upper boundary of descending channel. Bearish movement to support level 5.12 is expected to happen.
FILUSDT

Filusdt long Filusdt
Shopping area of the first step: Market
The range of the second step: 5.22
Loss limit: stabilization below 5 dollars
Goals: 6.5, 7.2, 8, 9

FIL stuck in channel - not a time to buy or sellFIL is stuck in a continuation pattern, which is called a "channel". Unfortunately, this indicates that the momentum will continue down, if it started this channel when it was going down.
However, with a little bit of hope and luck, if it breaks this channel, it can look promising, and the TP level would be around $7.5.
Vice versa, if it fails and goes lower, well then that's really bad news.
Otherwise, continue monitoring this.

FIL MAY TARGET 1,618 FIBO LEVEL* None of what i write here is not an investment advice. Please do your own research before investing in any digital asset.
* Never take my personal opinions as investment advice, you may lose your money.

FILUSDT 4H Price slowed down after falling, normal sign? LONGHello everyone
I have prepared a new signal for you, I write every day 10 profitable trades for the Russian and English audience, I think it will not be difficult to like and comment on the idea, your feedback is very important to me Go to the channel there is a lot of useful information.
FILUSDT After falling by -35% for 40 days, it is in the consolidation zone
I have identified two local zones on the chart, a local support zone and a local resistance zone, I think that the price will still come to the local support zone and the asset will show a reversal towards the $6 zone
Entrance $5.59
Stop 5.32$ behind the support zone
Take profit 5.80-6$

FIL ready to move up?!Hey, looks like a mini Altseason going on ... FIL just started the journey upwards. What do you think

FIL (trading range)FIL / USDT
FIL still moving in range
The bulls have the higher chance
However, we need a breakout directional from either way to determine the next move
Wait the breakout or breakdown and make the trade

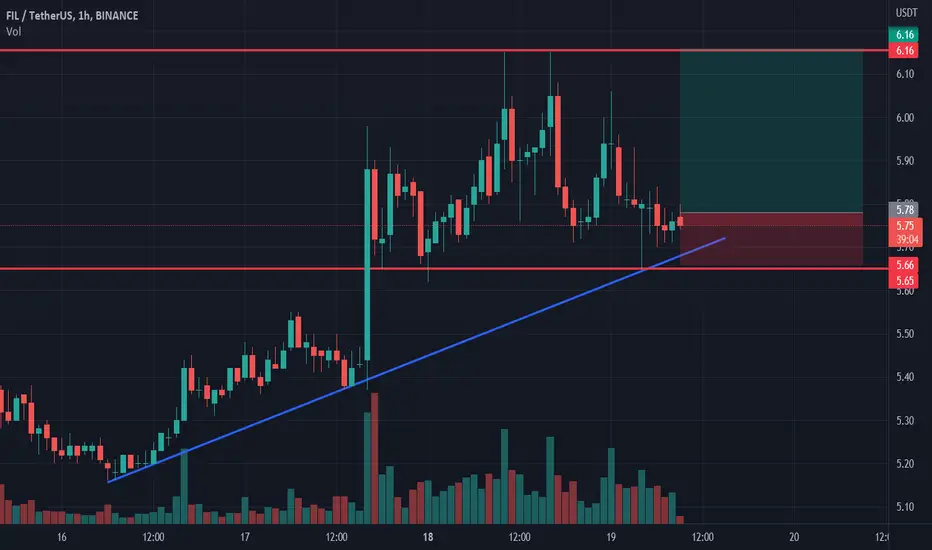
Filecoin longFilecoin bounced off the ascending trendline. Asset bounced off the support level. Bullish movement to resistance level at 6.16 is expected to happen.
Filecoin breaking out$Filecoin "Double Bottom Reversal pattern"
As we can see on the chart the Filecoin currently succeds to breaks trend line and if price could stay above yellow neckline pattern and breaks $6.2 then i am so Bullish and i expecting we will continue bullish move to $7.5 and then $9.5📈
But as i said we should see the price stay above neckline or not.

THE BEST TIME TO ENTER FILI`ve made an analysis about FIL coin yesterday where I`ve said that I`m expecting it to reach at least 20$ in a couple of months and said the reason why I think so. For now I`d like to try a thing that I haven`t benn doing since last year - trading. Recently I`ve been only investing because of a lack of time now I want to try to return to the time when I was looking at the chart for at least 10 times in a day.
So as we can see there are couple of divergences on a chart from different indicators such as RSI and MACD histogram. We made a break out recently and we have to test it before going further. The same I`m expecting to see on BTC.
I`m going to add some coins to my long position at 5.6$. I think that price may go lower but I don`t want to miss this opportunity and not to buy at this price at all.
Surely there can be a strong impulse that can break all of this divergences but in my experience it has less than 50% chance of happening. But in case of that I still have an opened LONG position so I won`t miss that pump and a chance to make some money.
Thank you for your opinion. GL

FILUSDTHello Crypto Lovers,
Mars Signals team wishes you high profits.
This is a 4-hour-time frame analysis for FILUSDT
Here, you see R1 which used to be a support line and the well support of the price is clear on it. And S1 is a support area, as well. Now we have the price fluctuating below R1 and we expect it to rise to this line and then face a decline. If it moves above R1 and gives us confirmation candles and fixes there, we predict more rise for it.
Warning: This is just a suggestion and we do not guarantee profits. We advise you to analyze the chart before opening any positions.
Wish you luck

Runeusdt inverse head and shoulders....Our last bullish analysis on Rune was not triggered as we didn't get the strong 1H breakout candle we needed for entries....
Am proposing this riskier but more rewarding entry.
We will be needing an impulsive 1H breakout of that cute inverse head and shoulders for entries on the retest.
Like and subscribe......1:48R which goes to 1:5.5R on scale-in.

Filusdt looking for longs.....If this setup plays out as shown, I will be going long after Brk and Retest for aa average 1:2.9.
Like and Subscribe.


going to reversalhi again and again
be ready with great reversal hope it’s general reversal, not just temporary.
DON'T FORGET SL

fil daily scalei highly recommend to buy this coin in about these levels for investing about 1 or 2 year .... very good support level which is indicating the accumulation zone

FILUSD: adios muchachos, see you at the bottom.FIL, IMO, has a really ugly chart. Appears a bearish 'B wave' triangle is triggering which will send this crypto into the teens or, perhaps, single digits. Buyer beware..

FILe predict long termThe one-year forecast for File shows that the file could grow 10x, but then fall sharply in 2023 to $ 4.5

FILUSDT Greetings to all👋
We broke through the support of $ 6.70, I think if we gain a foothold below, the asset will fly down!
If, as I presume on the chart, this is a false breakdown and the price returns to the $7 zone, then you can look at the countertrend breakdown!
✅Do not forget to visit the channel there is a lot of useful information about trading.

FIL going down again ? Hello Trades,
We may be forming a Descending triangle on FIL now which is a bearish continuation pattern.
Target : 6.80
Fil is now standing on a strong support, Hopefully it can hold it and this pattern fail.
Some of you gonna ask, why I drawed the lines with candles under
I wanted to post this idea on 4h chart, but it seems that the real support is closer than that of lower timeframes shows.
-
Educational :
The descending triangle is a bearish formation that usually forms during a downtrend as a continuation pattern. There are instances when descending triangles form as reversal patterns at the end of an uptrend, but they are typically continuation patterns. Regardless of where they form, descending triangles are bearish patterns that indicate distribution.
-
Thumb up if you agree !
Follow for more.
Have a nice day.

FIL/USDT Analysis #TheCryptoCityFIL Analysis
This is my idea. I have tried my best to bring the best possible outcome to this chart, Do not consider it FINANCIAL ADVICE.
So let's see how the market reacts in the coming days.
This chart is likely to help you in making better trade decisions
I am not a market maker I could be wrong.
Everything is on the chart.
Everything Depends On BTC Movement
Thank you


FILUSDT Analysis (Local Vision)Hello friends.
Please support my work by clicking the LIKE button👍(If you liked). Also i will appreciate for ur activity. Thank you!
Everything on the chart.
Entry: market and lower
Target zone: 9.8 - 11$
after first target reached move ur stop to breakeven
Stop: ~7 (depending of ur risk). ALWAYS follow ur RM .
Risk/Reward: 1 to 3
risk is justified
Good luck everyone!
Follow me on TRADINGView, if you don't want to miss my next analysis or signals.
It's not financial advice.
Dont Forget, always make your own research before to trade my ideas!
Open to any questions and suggestions.
