FILUSDT BINANCEFILUSDT Technical analysis Update
FIL/USDT currently trading at $27.9
SUPPORT ZONE
Buy level: $27.1 -$29.5
Stop loss: $26
TP1: $38.5
TP2: $58
Max Leverage 10x
Always keep Stop loss
Note: please do your own research before investing. Never invest money that you can't afford to lose.
FILUSDT

Filecoin (FIL) Buy ZoneFilecoin (FIL) Buy Zone
--------------------
BIAS
Mid-Term : Bullish
Risk : Medium
Filecoin is still holding with strength above our $35 long term key level, which means we remain bullish in mid term.
--------------------
$FIL/USDT LONG SETUP
Leverage : x3 - x5
Entry Price : 33.25 - 35
Mid-Term
TP 1 : 35.9
TP 2 : 37.25
TP 3 : 39.87
TP 4 : 41.5
Long-Term
TP 5 : 46
TP 6 : 49.9
TP 7 : 54.75
TP 8 : 65
Stop Loss : 30.25
*Maximum 3% of Portfolio.
*Unload 12.5% at each TP. Whenever TP 2 hits, Move stop loss to entry.
--------------------


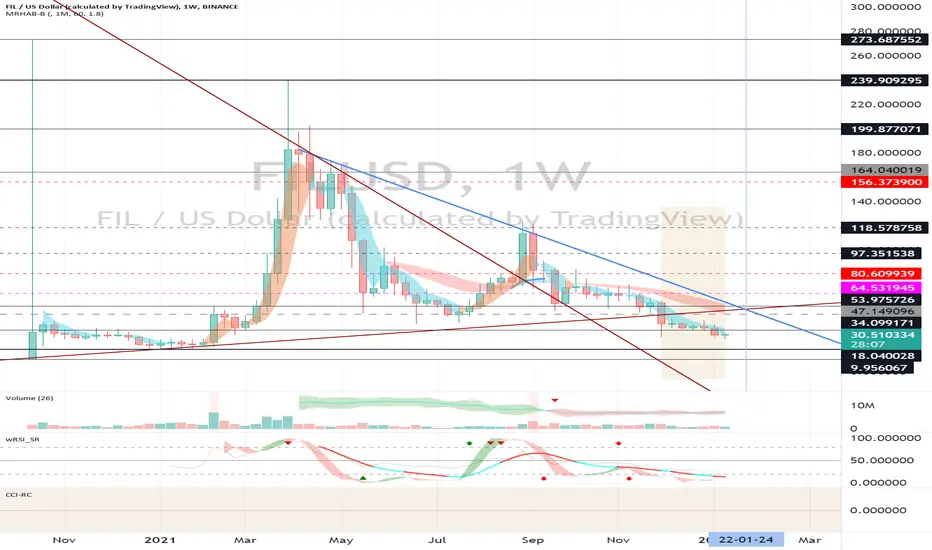
Filecoin (FIL) - January 17Hello?
Welcome, traders.
If you "follow", you can always get new information quickly.
Please also click "Like".
Have a nice day.
-------------------------------------
(FILUSD 1W Chart)
It must rise above the 47.149096 point to turn into an uptrend.
Now that we're out of a sharp decline, we need to see if we can sustain the price above the 34.099171 point around the week that includes January 24th.
-------------------------------------
(FILBTC 1W chart)
It must rise above the 0.000969 point to turn into an uptrend.
------------------------------------------
We recommend that you trade with your average unit price.
This is because, if the price is below your average unit price, whether the price trend is in an upward trend or a downward trend, there is a high possibility that you will not be able to get a big profit due to the psychological burden.
The center of all trading starts with the average unit price at which you start trading.
If you ignore this, you may be trading in the wrong direction.
Therefore, it is important to find a way to lower the average unit price and adjust the proportion of the investment, ultimately allowing the funds corresponding to the profits to be able to regenerate themselves.
------------------------------------------------------------ -------------------------------------------
** All indicators are lagging indicators.
Therefore, it is important to be aware that the indicator moves accordingly with the movement of price and volume.
However, for convenience, we are talking in reverse for the interpretation of the indicator.
** The MRHAB-O and MRHAB-B indicators used in the chart are indicators of our channel that have not been released yet.
(Since it was not disclosed, you can use this chart without any restrictions by sharing this chart and copying and pasting the indicators.)
** The wRSI_SR indicator is an indicator created by adding settings and options to the existing Stochastic RSI indicator.
Therefore, the interpretation is the same as the traditional Stochastic RSI indicator. (K, D line -> R, S line)
** The OBV indicator was re-created by applying a formula to the DepthHouse Trading indicator, an indicator disclosed by oh92. (Thanks for this.)
** Support or resistance is based on the closing price of the 1D chart.
** All descriptions are for reference only and do not guarantee a profit or loss in investment.
(Short-term Stop Loss can be said to be a point where profit and loss can be preserved or additional entry can be made through split trading. It is a short-term investment perspective.)
---------------------------------
FIL FILECOIN Expected 30 to 50% jump FILUSDT FILBTC FILUSDCFIL FILECOIN Expected 30% to 50% jump FILUSDT FILBTC FILUSDC

FILUSDT-LONGBased on technical factors there is a long position in :
FILUSDT Filecoin
Score 4️⃣
🔵Long Now or set on Key Level 29.00
🟢Target 1 33.00
🟢Target 2 40.00
❌Stop loss 27.30
#K_Level
Every signal has a score from 1 to 5, so accordingly adjust your risk for each signal. The signals with the score of 5 are the most probable ones.
Please support our activity with your likes and comments.

FIL is reaching ₿ottom soon - We are approaching the stage where accumulation prices start to get interesting.
- After an 87% drop from ATH, it doesn't make sense for it to be a distri₿ution.
- The main trend line is overcome, we can see that this is not an impulsive dump ₿ut a slow decline.
- Wave C may take some time to reach the very ₿ottom, after which I would expect a sideways move with HH & HL
-Please leave a comment ₿elow the chart with your opinion on the matter. Thank you :)

There is still the possibility of further correctionOn a daily TF, the trend is negative, and there is still the possibility of further correction. Traders should enter for the target of $ 51 if FIL loses $ 42 and enter for long-term purchases if it tests the $ 20 range.

FILUSDT Descending Broadening WedgeBINANCE:FILUSDTPERP
Im seeing potential breakout in next few hours for FILUSDT. As you can see fil already forms the descending broading wedge on 4h time frame.
This is just my idea and not a financial advice.

FILE LONG TRADE PLANMarket Instrument: FILE
Timeframe: Daily
Analysis: Technical
Structure: Support Level and Falling Wedge
Prediction: Bullish
FILE has gone on a complete wipe-off on its gains since February 2021. And We are on a very important price level which created huge buying pressure to push the prices heavily to the upside. The buyer's interest in alts are fading away these days with the bearish conditions of Bitcoin and weakness in the stock market. I here spotted another important structure that shows a falling wedge, A breakout on this can give us a good sign for the bullish minds with FILUSDT. If we can confirm a possible reversal and a breakout to the upside on the structure we caught up, we have a great potential of revisiting the prices above $100 once again

File Coin will go down a little moreBest Zone to buy near ~$20 , ~$21
Wait Price go Down to PRZ Zone then with good bullish candle (TRIGER) can long

Short to ..22-20 and buy from 22 -40FILUSDT DUMP 20-22 or 24
AND
PUMP 10FEB-22FEB TO 40
No pump to 10 FEB

FIL, STRONG SUPPORT AREA...!Filecoin is going forward to seeing a sensitive area (highlighted in blue).
Be careful! Entry after the retest to the marked point is more safe...
Rsi positive divergence:

Fil/Usdt Filcoin New Top is Coming...Hello Community.
The following chart is the technical analyses of filecoin one of the most powerful project on Big-Data and Clouding.
Thank you

FIL/USDT. FILECOIN POTENTIAL 2600%.the levels are self explanatory.
lets do the 1st target first.
Sending love to all.

Time to buy : When everyone is scared, it means nowThe most important principle in trading. Adhere to your analytical principles And that is what sets you apart from others So let's get into the position by buying the ladder, the first step of which is now

Fil/Usdt!Hi, price has dropped following the BTC ,now It is close to a very strong support zone... if we see any sign of reversal we can fill our bags!
PS: Market is unstable at the moment, so DON'T FORGET MONEY MANAGEMENT!

FILUSDT AnalysisHello friends.
Please support my work by clicking the LIKE button(If you liked).Thank you!
Everything on the chart.
Potential ED on the chart.
Price will rise from the current or through 30$.
open pos: market and lower
target: 40 - 44 - 49
after first target reached move ur stop to breakeven
stop: (depending of ur risk). ALWAYS follow ur RM .
risk is justified
Good luck everyone!
Follow me on TRADINGView, if you don't want to miss my next analysis or signals.
It's not financial advice.
Dont Forget, always make your own research before to trade my ideas!

FIL must buy why buy FIL
Fil is on long time support zone 31.59$
Start accumulating it (31.8$- 21.27$)zone
FIL is also WEB3.0 Project
sell targets according to chart
thank you

High-risk trading - FIL longFILUSDT LONG
entry - $36.8-37
TP 1 - $3.785
TP 2 - 40 .29
Leverage x20 (8% of total margin deposit)

FILECOIN - Long Bullishness ahead!As you can see the accumulation during this phase of the end of the year, continuing 2022 right now on early January. It's like the accumulation previous the big rally that FIL had. The structure is almost the same identical, even the RSI is so identical like the last accumulation.
Just Hodl. Fracture of the last rally tells us about huge movement upside. Lets see how it goes in shaa Allah.

FIL - Oddly Familiar... 🧐FIL is showing us a price action that looks really familiar. In 2020, we had a descending trendline (black) which broke out and then we had a minor descending correction (red) which lead to a double bottom before we had a bullish run.
Similarly, we have having exactly the same sequence of events. The next step based on past price action would be a breakout and a bullrun.
Trade idea:
- Watch for price to break out of the descending correction (red)
- enter with stops below the double bottom
- Targets: 114 - 200 - HODL the rest
Let us know what you think.
Goodluck!

FILUSDT Possibe Long Scenario$FIL $FILUSD
Looking at the setup of FILUSDT ($FIL), if price can make its way back into the macro range and hold above $42, this may confirm that the recent price action is just a deviation of the range. This sets up an opportunity for a possible long to the $50 region
