FILUSDTBINANCE:FILUSDT is deep corrections from latest bull-trend.
Bets support's in 1.90 to 2.150 $ and resistance's 2.50 and 2.80 $.
Please control risk management.
FILUSDTPERP


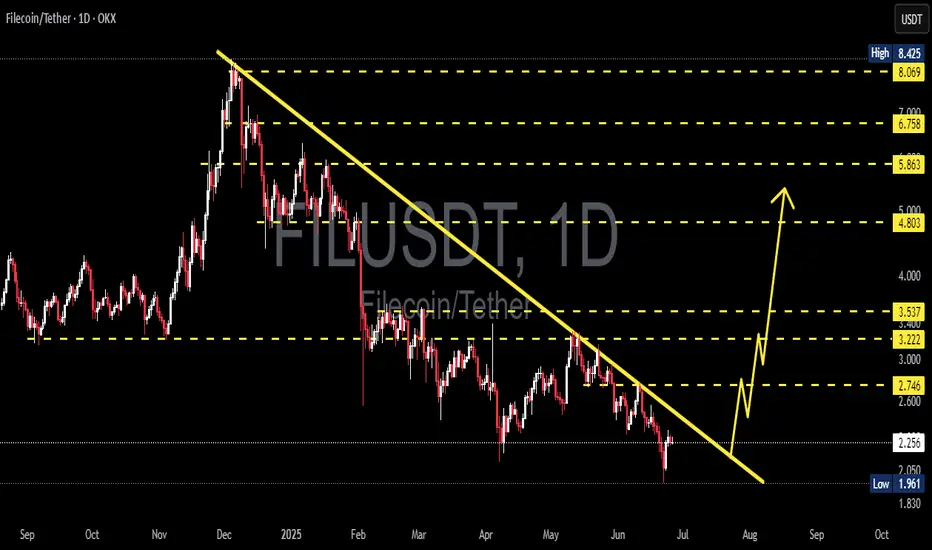
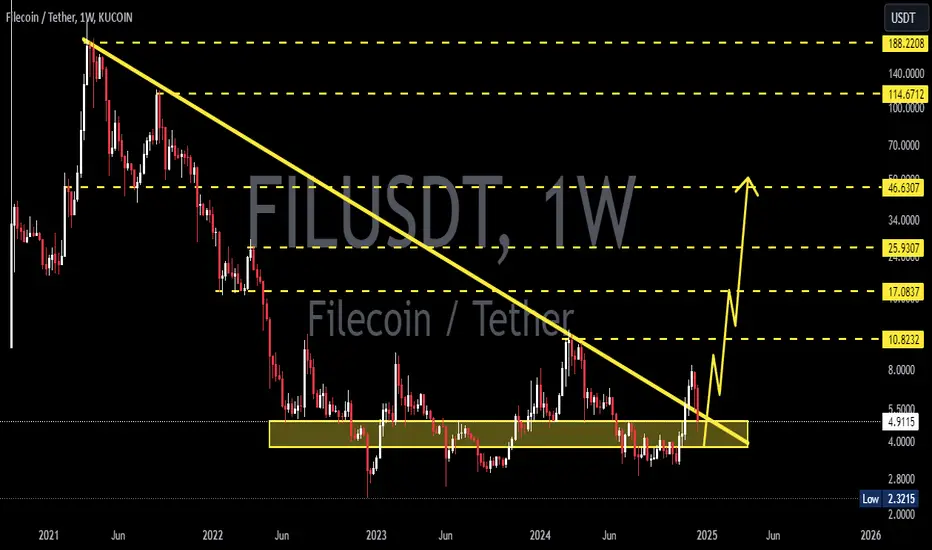
FIL/USDT – Major Trendline Breakout Imminent?The FIL/USDT chart is showcasing a significant descending trendline that has been respected since its peak in late December 2024. Price action has recently approached this trendline again, and a potential breakout scenario is forming. This setup may signal a major shift in trend after months of persistent decline.
🔍 Technical Analysis:
Trendline Resistance:
The long-term descending yellow trendline has capped every bullish rally since early 2025. A breakout above this trendline would be a major bullish technical signal.
Support Level:
Key horizontal support has been held at around $1.96, which has formed a strong base.
Potential Breakout Projection:
Upon breakout, $2.746 is the first resistance to watch.
A successful retest of this level could lead to a stair-step rally targeting:
$3.222
$3.537
$4.803
$5.863
$6.758
And potentially $8.069–$8.425 if momentum continues.
Bullish Pattern:
The projected move shows a potential impulse wave pattern following the breakout, indicating staged profit-taking zones for traders.
🧠 Strategic Consideration:
A daily candle close above the trendline with volume confirmation would be the first sign of trend reversal.
Conservative traders may wait for a retest of the trendline as support before entering.
Targets can be approached progressively based on price action near each resistance level.
⚠️ Risk Management:
Watch for fakeouts near the trendline.
A break below the key support of $1.96 would invalidate the bullish thesis.
FILUSDT 1D AnalysisFIL ~ 1D Analysis
#FIL This is the lowest support for now. Buy if you still have confidence in this coin with a short term target of at least 20%+ from this support.
Spot signalHello friends
As the price reaches the specified support level and buyers enter, you can see that higher ceilings have formed and you can take advantage of this opportunity and now buy with capital and risk management and move towards the specified goals.
*Trade safely with us*

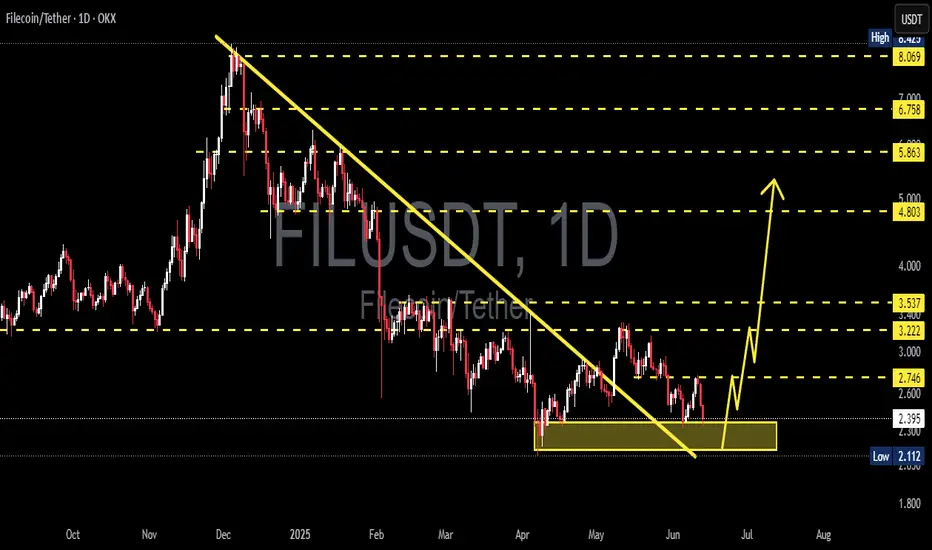
FILUSDT 1D Analysis FIL ~ 1D Analysis
#FIL Buy gradually from here if you still have confidence in this coin with a short term target of at least 15%+ from here.
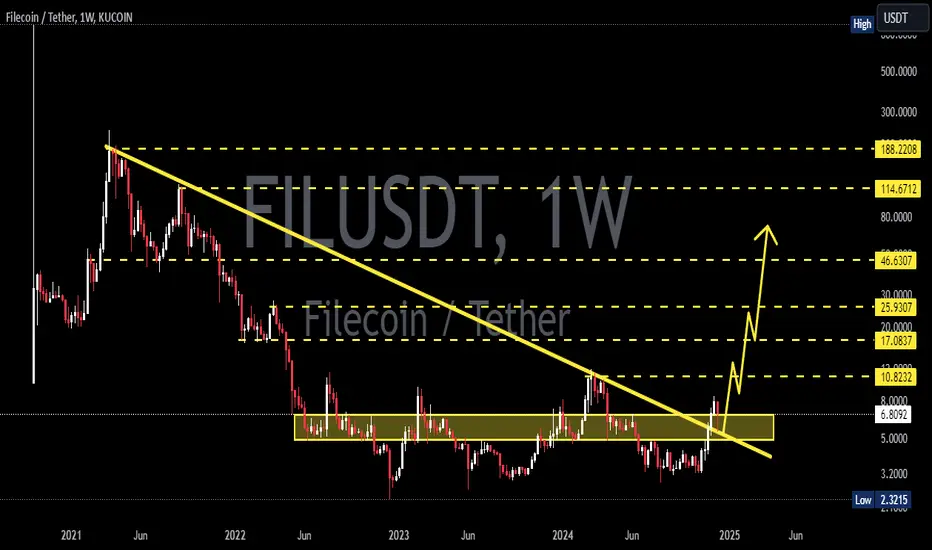
FILUSDT 1W AnalysisFIL ~ 1W Analysis
#FIL Buy gradually from here if you still have confidence in this coin with a short term target of at least 20%+ from here.

FILUSDTFIL is showing signs of a potential trend reversal 📊
Price has formed a higher low and is now approaching the key resistance at 2.485 USDT. A breakout above this level could open the way toward the next major zones around 2.887 and even 3.189 USDT 🚀
However, if rejection occurs, we might see a pullback toward the 2.272 USDT support area 🔁
Currently, momentum is leaning bullish and favoring a move higher, especially if the descending trendline gets broken with strength 💪

FIL bull-pollbakThe Filecoin ( BINANCE:FILUSDT ) chart, after a correction to $2.65, is attempting to pull back to the broken level around $2.77. If it fails to break this resistance, another decline towards support levels at $2.525 and then $2.39 is likely, which could act as a potential starting point for a new upward movement towards targets at $3.02 and $3.30.
🔑 Key Zones on the FIL Chart:
Primary Resistance: $2.77 (Pullback to broken level)
First Support: $2.525
Second Support: $2.39
First Bullish Target: $3.02
Second Bullish Target: $3.30

#FIL/USDT#FIL
The price is moving within a descending channel on the 1-hour frame and is expected to break and continue upward.
We have a trend to stabilize above the 100 moving average once again.
We have a downtrend on the RSI indicator that supports the upward move with a breakout.
We have a support area at the lower limit of the channel at 2.60, which acts as strong support from which the price can rebound.
Entry price: 2.64
First target: 2.72
Second target: 2.78
Third target: 2.87

#FIL/USDT#FIL
The price is moving within a descending channel on the 1-hour frame, adhering well to it, and is heading towards a strong breakout and retest.
We are seeing a bounce from the lower boundary of the descending channel, which is support at 2.68.
We have a downtrend on the RSI indicator that is about to be broken and retested, which supports the upward trend.
We are looking for stability above the 100 moving average.
Entry price: 2.73
First target: 2.78
Second target: 2.86
Third target: 2.95

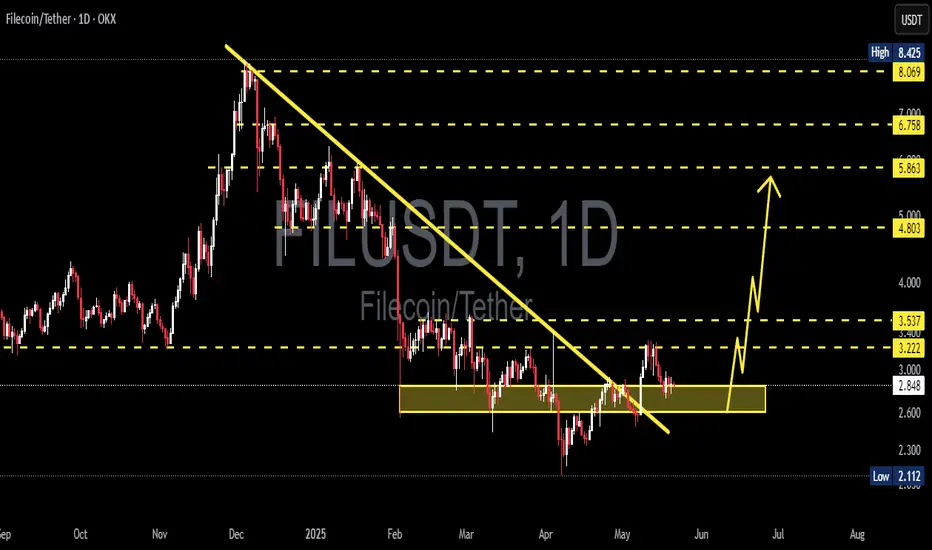
FILUSDT 1D AnalysisFIL ~ 1D Analysis
#FIL Buy after successfully penetrating this resistant line with a short -term target of at least 10%+ from here.

FIL can touch 1$ in the coming weeksFIL / USDT
The price just brokedown the Huge trading range (2022-2025) on weekly chart and price still find difficulty to restore the broken support
Our view for this coin in mid term is bearish and few weeks we can see FIL hits 1$ 📉
This is my macro view for FILUSD as long as price doesn’t reclaim the support with strong volume
Best of wishes

#FILUSDT remains under bearish pressure📉 SHORT BYBIT:FILUSDT.P from $2.616
🛡 Stop loss $2.645
🕒 1H Timeframe
⚡️ Overview:
➡️ The POC (Point of Control) BYBIT:FILUSDT.P is located at $2.766, far above the current price — this highlights strong historical selling pressure.
➡️ Price is forming lower highs and lower lows, confirming a bearish trend.
➡️ The breakdown below $2.616 triggered the short setup with further downside potential.
➡️ Volume spikes during red candles indicate continued seller activity.
🎯 TP Targets:
💎 TP 1: $2.605
💎 TP 2: $2.584
💎 TP 3: $2.570
📢 Watch the $2.616 zone — holding below increases downside probability.
📢 If price moves above $2.645, the setup becomes invalid.
BYBIT:FILUSDT.P remains under bearish pressure — short bias stays valid under current structure.

Filecoin FIL Will Continue Bear MarketHello, Skyrexians!
Recently we made the most hated article about Bitcoin Dominance growth, but this chart reflects great what can happen soon. The mistake of the most traders here is that they are sure that alseason will come now. Most of crypto shows weakness and we need to be more realistic. Today we take a look at BINANCE:FILUSDT as an example of bear market continuation for risky assets!
Let's take a look at the weekly chart. Current bear market can be seen as an ABC. The most common mistake that people think that wave B is an accumulation, but this is redistribution and the new mark down phase is starting now. The support will be broken because there is no other way. There was a chance for altcoin season in November when price has formed the anticipated wave 1, but wave 2 has broken this belief and now we are in the wave C. Current wave is wave 3, but to the downside. Targets are very low, they cannot be measured, but FIL may easily touch $1. This bear market will be finished with the ending diagonal, like most of major trends. This information is not for panic, but be ready for the big crash again. Anyway, now there is a great price for long term accumulation, the only one question will you be able to see -70% from the current portfolio value?
Best regards,
Skyrexio Team
___________________________________________________________
Please, boost this article and subscribe our page if you like analysis!

FIL short-down FILUSDT Signal
🔹 Key Resistance Level: $3.35 – $3.50
🔹 Important Support Levels: $3.148 – $2.940 – $2.738
Analysis:
FIL price has been moving in an uptrend within a rising wedge pattern and has now reached the key resistance zone of $3.35 – $3.50. If this level is broken, followed by confirmation with a pullback, the uptrend is likely to continue. However, failure to break this resistance could lead to a price correction toward the mentioned support levels.
📌 Trading Strategy:
✅ Sell Entry after breaking the uptrend and confirming below $3.148
🎯 Targets: $2.940 – $2.738
🛑 Stop Loss: $3.30
⚠ Important Note: Risk management should not be ignored!

FILUSDT 1WFIL ~ 1W Analysis
#FIL This is the lowest support for now.Buy from here if you still have a Conviction on this Coin with a target of 20%+
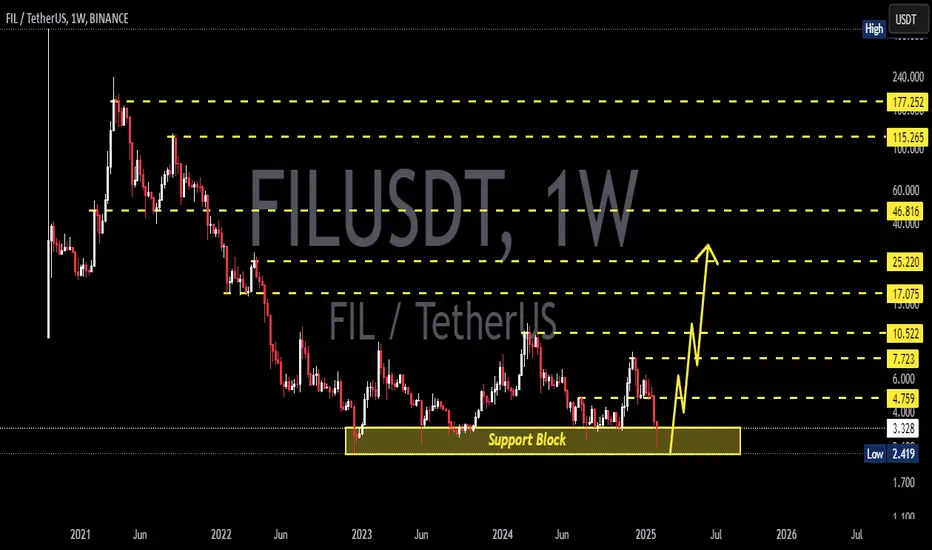
FILUSDT 1WFIL Update ~ 1W
#FIL still in a bullish trend. If you still have Conviction on this coin,. Buy gradually on this support block. with a minimum target of 20%++

#FIL/USDT#FIL
The price is moving in a descending channel on the 1-hour frame and is expected to continue upwards
We have a trend to stabilize above the moving average 100 again
We have a descending trend on the RSI indicator that supports the rise by breaking it upwards
We have a support area at the lower limit of the channel at a price of 5.80
Entry price 6.02
First target 6.15
Second target 6.34
Third target 6.60

#FIL/USDT Ready to go higher#FIL
The price is moving in a descending channel on the 1-hour frame and sticking to it well
We have a bounce from the lower limit of the descending channel, this support is at 4.70
We have a downtrend on the RSI indicator that is about to be broken, which supports the rise
We have a trend to stabilize above the moving average 100
Entry price 4.87
First target 5.22
Second target 5.49
Third target 5.82

FILUSDT 1WFIL Update ~ 1W
#FIL still in a bullish trend. If you still have Conviction on this coin,. Buy gradually on this support block. with a minimum target of 20%++
#FIL/USDT Ready to go higher#FIL
The price is moving in a descending channel on the 1-hour frame and sticking to it well
We have a bounce from the lower limit of the descending channel, this support is at 5.80
We have a downtrend on the RSI indicator that is about to be broken, which supports the rise
We have a trend to stabilize above the moving average 100
Entry price 6.81
First target 7.20
Second target 7.84
Third target 8.40

FILUSDT 1WFIL Update ~ 1W
#FIL Retesting this resistance line.. If you still have Conviction on the coin,. Buy gradually within this support block,. with a minimum target of 20%+